- Integrated canopy management, a low profile axial sprayer, and Crop-Adapted Spraying cut spray volume from ~1,000 to ~400 L/ha, saving 70.5% water.
- CAS and sprayer changes reduced pesticide costs by about 63%, saving about $5,850 CAD per year and roughly $58,500 CAD over 10 years.
- Yield and SWD control remained comparable to conventional practices while reducing labor and improving fruit quality and customer perception.
This text was generated by OpenAI GPT 5 Mini
A 15-acre highbush blueberry operation in southern Ontario reduced annual spray volume by an average of 70.5% and pesticide costs by 63% without compromising commercially acceptable pest or disease control.
The results were not achieved by changing sprayer settings alone. They followed three complementary changes:
- Improving canopy and harvest management
- Replacing an inefficient sprayer
- Using Crop-Adapted Spraying to match spray volume and pesticide rate to the canopy
Together, these changes reduced average spray volume from approximately 1,000 to 400 L/ha and saved an estimated $5,850 CAD in pesticide costs each year.
Why Falcon Blueberries changed their approach
In 2016, serious spotted-wing drosophila (SWD) pressure prompted the growers to reconsider their crop protection program.
The project tracked pesticide use, water use, yield, and operational outcomes against historical values. SWD activity was also monitored for three years, both within the planting and in wild hosts along its border. Results were compared with monitoring data from nearby berry and tender fruit operations using conventional spray programs.
1. Improving canopy and harvest management
The first step was to make the crop easier to protect.
Beginning in 2016, the growers:
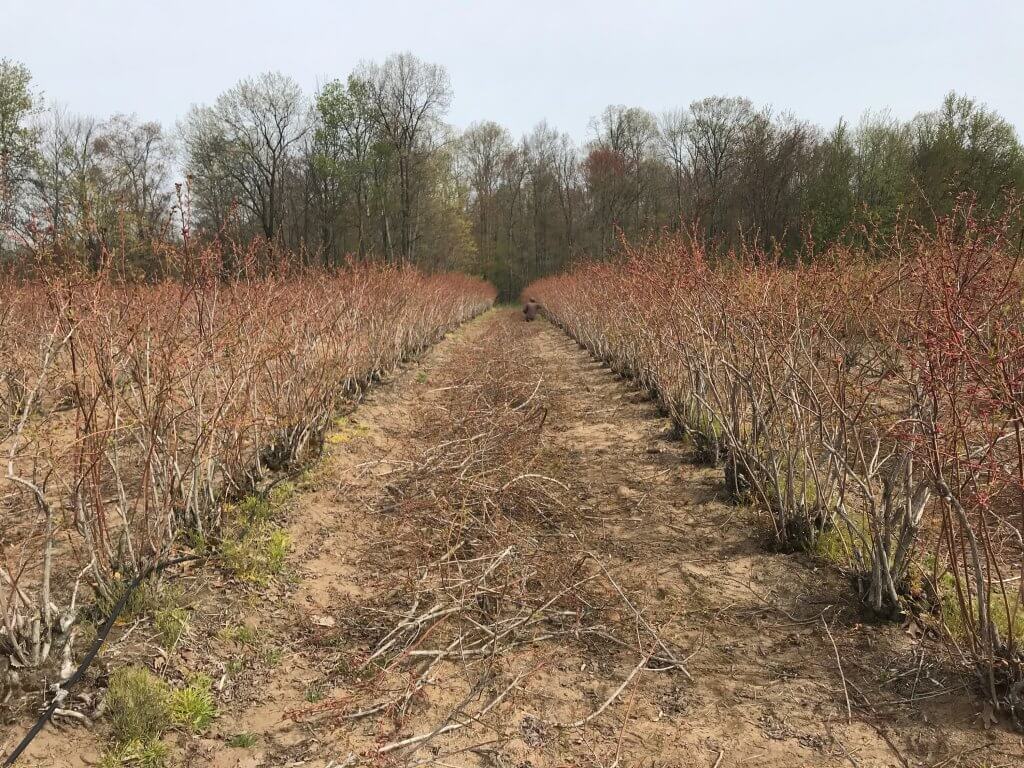
- Conducted their first heavy pruning
- Aimed to remove approximately 30% of the plant material annually
- Picked more frequently and more thoroughly
- Collected and buried dropped and culled berries
Heavy pruning initially raised concerns about lower yield and the possible need for trellising. Instead, the growers observed improved berry quality and spent fewer hours removing damaged fruit on the packing line. They concluded that the improvement in marketable fruit offset the effects of removing plant material.
Pruning also produced a more open and uniform spray target. This was an important prerequisite for reducing spray volume because dense, irregular canopies are more difficult to penetrate consistently.


2. Selecting a sprayer suited to blueberries
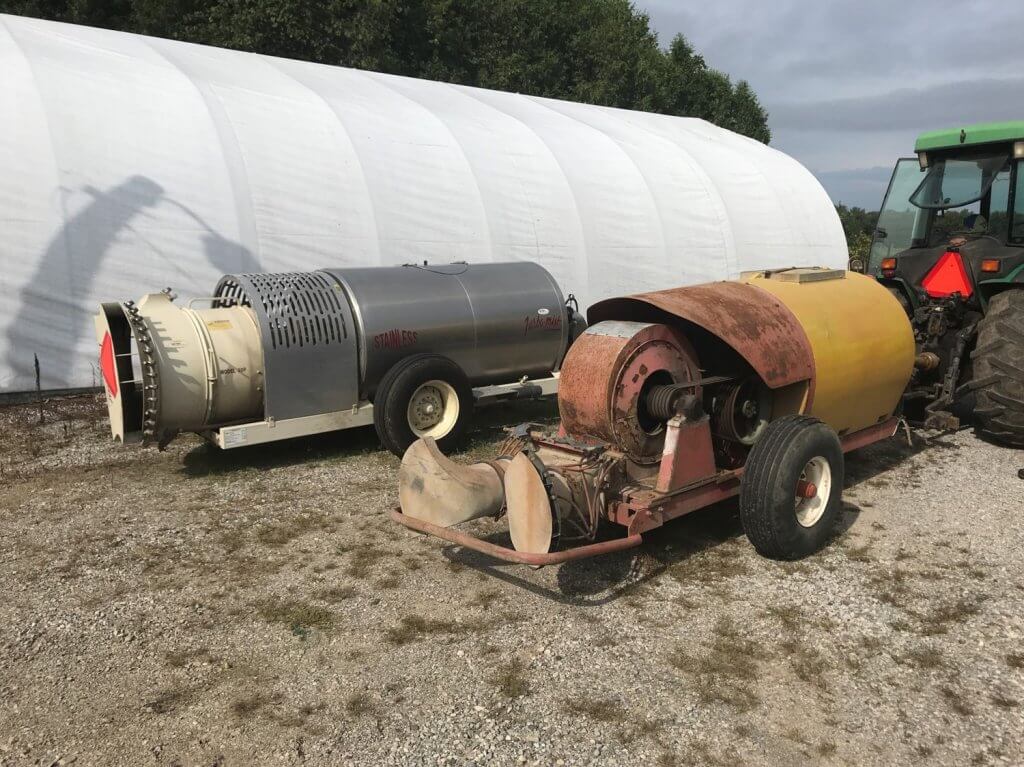
In 2018, the operation replaced its aging KWH air-shear sprayer with a low-profile axial-fan sprayer equipped with conventional hydraulic nozzles.
The KWH sprayer had been designed for standard fruit-tree canopies. It generated air speeds greater than 100 mph and produced an Extremely Fine spray quality. These characteristics were poorly matched to the shorter, denser architecture of highbush blueberries.
The growers considered a cannon-style sprayer that could treat several rows in one pass. However, their priorities were improved coverage and reduced off-target loss. They therefore selected a low-profile sprayer and continued to travel every row.
The new sprayer provided several immediate benefits:
- Better control over droplet size and liquid distribution
- Air direction and volume better suited to the canopy
- Greater reliability
- Lower fuel use
- Less noise
- Elimination of leaks
- Positive nozzle shutoff at row ends
Correcting leaks and eliminating continued discharge during turns reduced spray use by approximately 20% before any further rate adjustment was made.
3. Matching the application to the canopy
Crop-Adapted Spraying, or CAS, provides a structured way to adjust an airblast application to the size, density, and shape of a three-dimensional crop canopy.
Several established dose-expression systems perform a similar function, including Tree-Row Volume, PACE+, and DOSAVIÑA. Although each has value, adoption can be limited by crop-specific requirements or complicated calculations.
CAS formalizes adjustments that experienced applicators often make informally, such as:
- Turning individual nozzles on or off according to canopy height
- Redistributing flow among nozzle positions
- Adjusting travel speed for canopy density
- Changing air output and direction to improve penetration and reduce loss
The blueberry sprayer was calibrated by adjusting air energy and direction, travel speed, nozzle selection, and liquid distribution. Water-sensitive paper was placed throughout the canopy to confirm that the revised settings provided acceptable coverage.
The working coverage targets were:
- At least 85 deposits/cm²
- Approximately 10% to 15% surface coverage
- Achievement of these targets in at least 80% of the sampled canopy
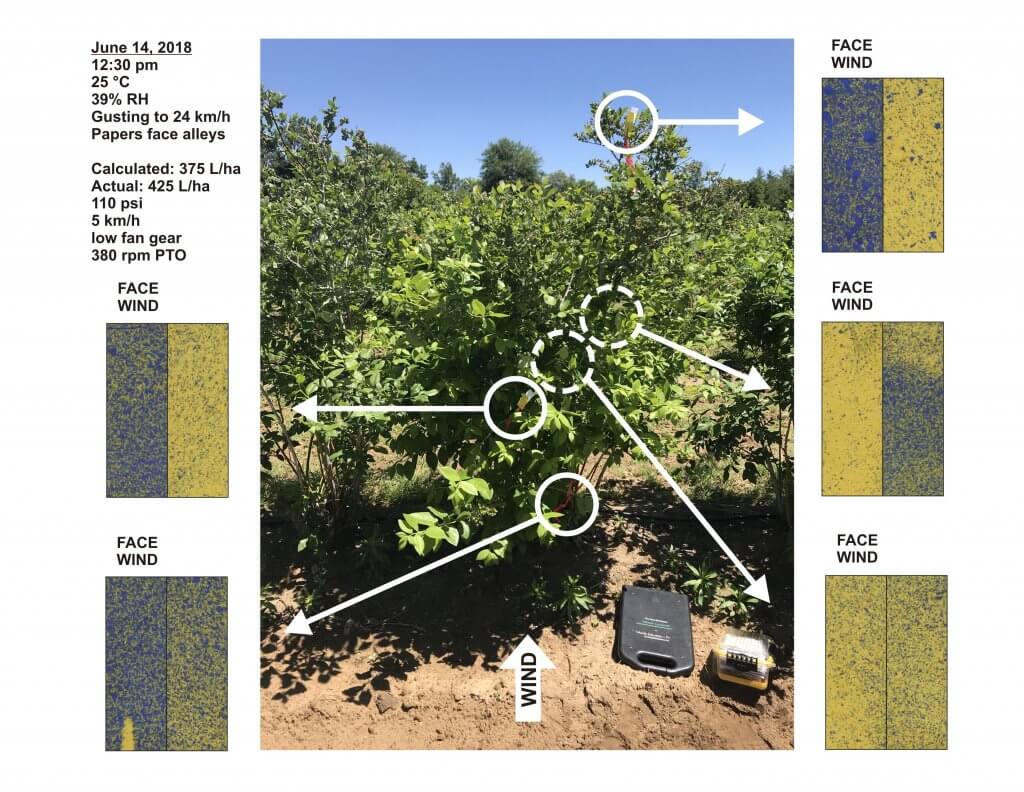
During the first season, coverage was reassessed every few weeks from April through June as the canopy developed.
Spray volume / Pesticide
Once the new sprayer was calibrated to the managed canopy, spray volume declined from approximately 1,000 to 400 L/ha. The concentration of formulated product in the spray mixture remained unchanged. Instead, the calibrated sprayer allowed each tank to treat a larger area while maintaining the required canopy coverage.
Before the sprayer replacement and adoption of CAS, the operation applied approximately 78,260 L of spray mixture annually. Average annual water savings were approximately 55,173 L, equivalent to a 70.5% reduction. That’s almost 1/2 a million liters in 10 years.

The lower spray volume also saved an estimated 15 hours of filling and spraying each year. This reduced labour and equipment time while potentially reducing operator fatigue and exposure associated with mixing and loading
Pesticide costs were compared annually with the farm’s 2017 program using updated product prices. On that basis, the average savings were approximately:
- $5,850 CAD per year
- 63% of the equivalent pesticide cost

Pest and Disease Monitoring
The growers retained responsibility for product selection and application timing. Products were rotated, and treatment decisions were made according to integrated pest management principles.
Air-induction hollow-cone nozzles were installed in the uppermost nozzle positions. The larger droplets produced at the top of the spray plume were more likely to settle if they passed over the canopy, reducing the potential for off-target movement
SWD monitoring
Spotted-wing drosophila traps were monitored weekly from 2018 through 2020. Three traps were placed within the blueberry crop and one was placed in an unmanaged wild host along an adjacent treeline.
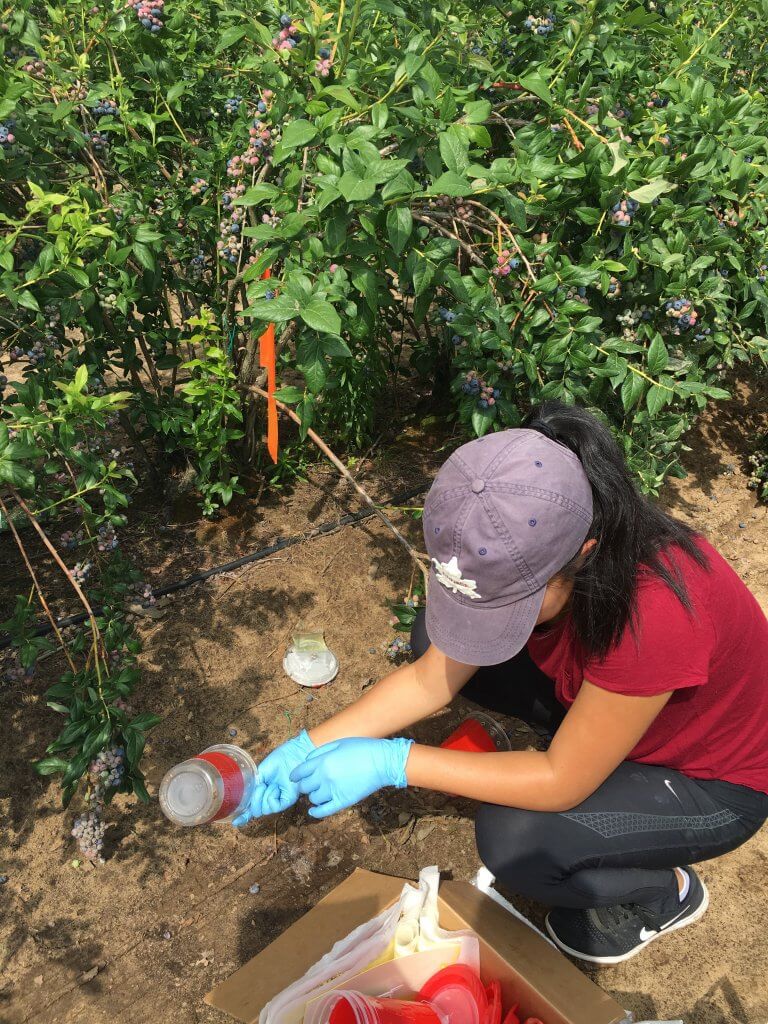
Regional monitoring provided comparisons with other horticultural operations:
- Up to 16 berry and tender fruit sites in 2018
- Approximately 10 to 12 sites in 2019
- Four blueberry, raspberry, and cherry sites in 2020
Average SWD captures were higher at surrounding conventionally managed sites in 2018 and 2020. Captures were higher in the CAS planting in 2019. Across the three monitoring years, the overall difference was negligible.

Trap capture does not necessarily predict the amount of fruit damage. The growers therefore also tested harvested berries regularly. SWD damage remained within commercially acceptable limits, and the growers reported satisfactory disease control.
Because the monitoring was not replicated or subjected to statistical analysis, it cannot establish that CAS provided equivalent control under all conditions. It does indicate that, on this farm, lower spray volumes and pesticide use were compatible with acceptable commercial control.
Yield and seasonal conditions
Yield varied for reasons unrelated to sprayer calibration, including pruning intensity, labour availability, harvest timing, market conditions, and weather.

- 2016: The baseline before any management changes. The farm harvested 12,076 flats, each containing approximately 9 lb of fruit.
- 2017: Following the initial canopy-management changes, harvest increased to 18,335 flats; an increase of approximately 50%.
- 2018: Yield remained essentially unchanged in the first year of CAS.
- 2019: Harvest began about one month late. Low blueberry prices also prompted the farm to stop harvesting approximately one month early. Allowing for the shortened harvest period, production appeared comparable with previous years.
- 2020: Anticipated shortages of seasonal labour during the COVID-19 pandemic led the growers to prune heavily and deliberately reduce the crop.
- 2021: Little pruning was needed following the previous year’s heavy pruning. The resulting denser canopy, combined with unusually high precipitation, contributed to serious anthracnose pressure. More fungicide applications were made than in any other study year, although CAS-calibrated rates and settings were maintained.
- 2022 and 2023: Spotted-wing drosophila pressure was low, anthracnose pressure was moderate, and production conditions were relatively typical.
- 2024: Heavy rainfall contributed to an early start and finish to the season, but yield remained near normal.
- 2025 and 2026: The seasons were generally typical, with no major production disruptions.
These annual differences demonstrate why pesticide use, pest pressure, yield, and weather should be interpreted together. A low-use year may reflect either improved application efficiency or low pest pressure. Likewise, a high-use year may reflect exceptional disease pressure rather than a failure of the calibration method.
Additional benefits reported by Falcon Blueberries
The operation identified several benefits beyond direct pesticide and water savings:
- Reduced pesticide use provided a positive response to questions from U-pick customers.
- Lower environmental pesticide loading aligned with the growers’ production philosophy.
- During a regional fungicide shortage in 2018, the farm had enough unused product to return some to the distributor.
- Reduced early-season disease damage decreased the amount of fruit removed on the packing line.
- Fewer tank fills reduced labour, machinery time, and interruptions during spraying.
Practical implications for all highbush blueberry growers
The results from this farm should not be interpreted as a recommendation to reduce pesticide rates by a fixed percentage. The important principle is to match the application to the canopy and confirm performance. Growers considering a similar approach should:
- Manage the canopy. Maintain a reasonably open and consistent target through regular pruning.
- Correct obvious sources of waste. Repair leaks, confirm positive nozzle shutoff, and prevent discharge during turns.
- Match the sprayer to the crop. Adjust fan output, air direction, nozzle positions, droplet size, travel speed, and liquid distribution.
- Measure coverage. Use water-sensitive paper or another suitable method at representative locations and depths.
- Reassess as the canopy changes. Settings that work before bloom may not be appropriate after the canopy fills.
- Respect the label. Do not reduce application volume or pesticide use below label requirements.
- Document the results. Record settings, weather, water volume, products, pest pressure, coverage, and crop response.
- Make changes incrementally. Confirm coverage and control before adopting larger reductions.
The achievable reduction will vary with canopy size and density, sprayer design, product requirements, pest pressure, weather, and the applicator’s ability to verify coverage.
Conclusion
Over ten years, this southern Ontario blueberry operation substantially reduced spray volume and pesticide costs while maintaining commercially acceptable pest and disease control. These outcomes resulted from a coordinated production-system change rather than from a single calibration adjustment. Canopy management created a more accessible target, the new sprayer provided better control of air and liquid, and Crop-Adapted Spraying supplied a repeatable method for confirming coverage.
The case study demonstrates that meaningful pesticide savings are possible when rate adjustment is based on crop structure, appropriate application technology, and measured coverage. It also reinforces an important limitation: results from one farm should guide further evaluation, not replace on-farm calibration, label compliance, or local validation.
Here’s a narrated PowerPoint presentation of this study (includes data up to 2020):
The monitoring portion of this project was funded by Niagara Peninsula Fruit and Vegetable Growers Association, Ontario Grape and Wine Research and Ontario Tender Fruit Growers in collaboration with private consultants.