Tag: coverage

  • Crop-Adapted Spraying in Highbush Blueberry: Ten years of pesticide savings

    Crop-Adapted Spraying in Highbush Blueberry: Ten years of pesticide savings

    A 15-acre highbush blueberry operation in southern Ontario reduced annual spray volume by an average of 70.5% and pesticide costs by 63% without compromising commercially acceptable pest or disease control.

    The results were not achieved by changing sprayer settings alone. They followed three complementary changes:

    1. Improving canopy and harvest management
    2. Replacing an inefficient sprayer
    3. Using Crop-Adapted Spraying to match spray volume and pesticide rate to the canopy

    Together, these changes reduced average spray volume from approximately 1,000 to 400 L/ha and saved an estimated $5,850 CAD in pesticide costs each year.

    Why Falcon Blueberries changed their approach

    In 2016, serious spotted-wing drosophila (SWD) pressure prompted the growers to reconsider their crop protection program.

    The project tracked pesticide use, water use, yield, and operational outcomes against historical values. SWD activity was also monitored for three years, both within the planting and in wild hosts along its border. Results were compared with monitoring data from nearby berry and tender fruit operations using conventional spray programs.

    1. Improving canopy and harvest management

    The first step was to make the crop easier to protect.

    Beginning in 2016, the growers:

    • Conducted their first heavy pruning
    • Aimed to remove approximately 30% of the plant material annually
    • Picked more frequently and more thoroughly
    • Collected and buried dropped and culled berries

    Heavy pruning initially raised concerns about lower yield and the possible need for trellising. Instead, the growers observed improved berry quality and spent fewer hours removing damaged fruit on the packing line. They concluded that the improvement in marketable fruit offset the effects of removing plant material.

    Pruning also produced a more open and uniform spray target. This was an important prerequisite for reducing spray volume because dense, irregular canopies are more difficult to penetrate consistently.
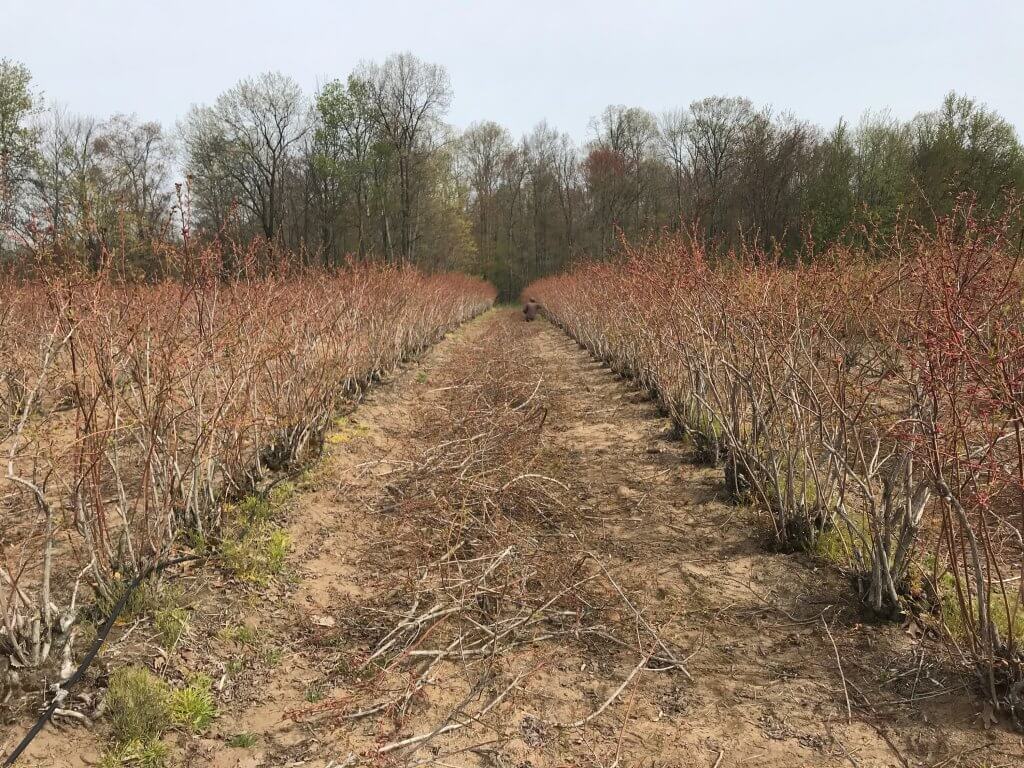
    Heavy pruning in 2016.
    Most years, bushes were pruned ~30% to maintain an ideal size and shape.
    Pickers were educated in how to pick cleanly and dropped / culled fruit was collected and buried.

    2. Selecting a sprayer suited to blueberries

    In 2018, the operation replaced its aging KWH air-shear sprayer with a low-profile axial-fan sprayer equipped with conventional hydraulic nozzles.

    The KWH sprayer had been designed for standard fruit-tree canopies. It generated air speeds greater than 100 mph and produced an Extremely Fine spray quality. These characteristics were poorly matched to the shorter, denser architecture of highbush blueberries.

    The growers considered a cannon-style sprayer that could treat several rows in one pass. However, their priorities were improved coverage and reduced off-target loss. They therefore selected a low-profile sprayer and continued to travel every row.

    The new sprayer provided several immediate benefits:

    • Better control over droplet size and liquid distribution
    • Air direction and volume better suited to the canopy
    • Greater reliability
    • Lower fuel use
    • Less noise
    • Elimination of leaks
    • Positive nozzle shutoff at row ends
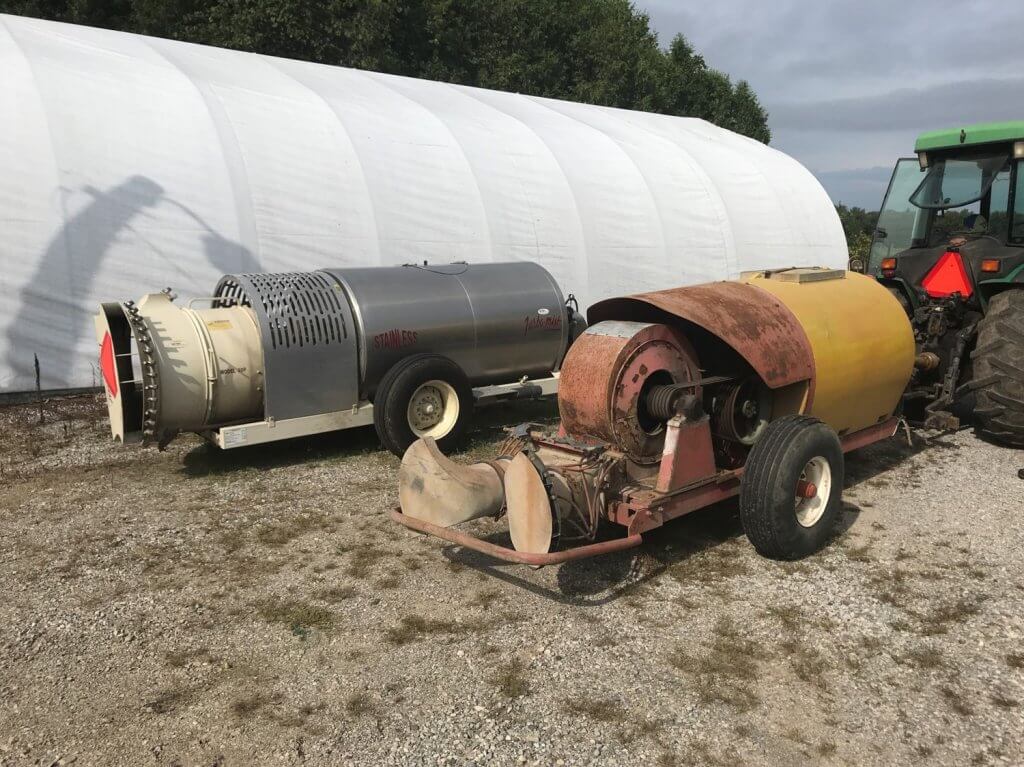
    Fore: An old KWH air shear sprayer. Rear: Low profile axial sprayer with conventional hydraulic nozzles.

    Correcting leaks and eliminating continued discharge during turns reduced spray use by approximately 20% before any further rate adjustment was made.

    3. Matching the application to the canopy

    Crop-Adapted Spraying, or CAS, provides a structured way to adjust an airblast application to the size, density, and shape of a three-dimensional crop canopy.

    Several established dose-expression systems perform a similar function, including Tree-Row Volume, PACE+, and DOSAVIÑA. Although each has value, adoption can be limited by crop-specific requirements or complicated calculations.

    CAS formalizes adjustments that experienced applicators often make informally, such as:

    • Turning individual nozzles on or off according to canopy height
    • Redistributing flow among nozzle positions
    • Adjusting travel speed for canopy density
    • Changing air output and direction to improve penetration and reduce loss

    The blueberry sprayer was calibrated by adjusting air energy and direction, travel speed, nozzle selection, and liquid distribution. Water-sensitive paper was placed throughout the canopy to confirm that the revised settings provided acceptable coverage.

    The working coverage targets were:

    • At least 85 deposits/cm²
    • Approximately 10% to 15% surface coverage
    • Achievement of these targets in at least 80% of the sampled canopy
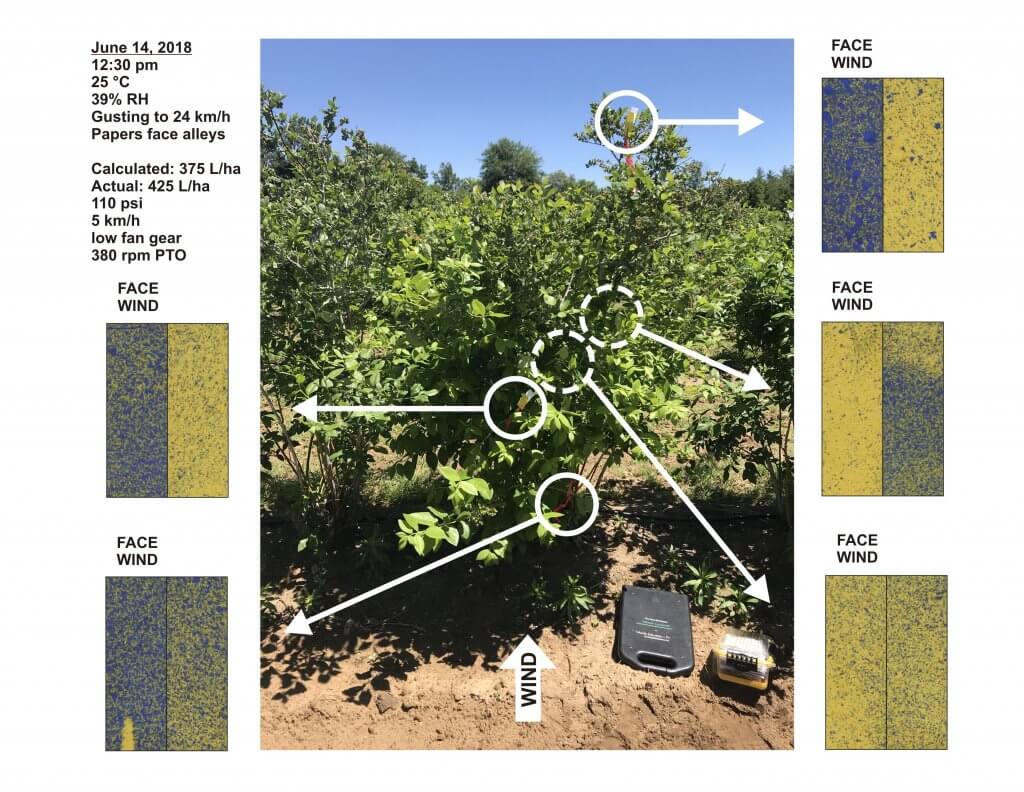
    Example of water sensitive paper coverage on a windy day (worst case scenario) in June, 2018.

    During the first season, coverage was reassessed every few weeks from April through June as the canopy developed.

    Spray volume / Pesticide

    Once the new sprayer was calibrated to the managed canopy, spray volume declined from approximately 1,000 to 400 L/ha. The concentration of formulated product in the spray mixture remained unchanged. Instead, the calibrated sprayer allowed each tank to treat a larger area while maintaining the required canopy coverage.

    Before the sprayer replacement and adoption of CAS, the operation applied approximately 78,260 L of spray mixture annually. Average annual water savings were approximately 55,173 L, equivalent to a 70.5% reduction. That’s almost 1/2 a million liters in 10 years.

    The lower spray volume also saved an estimated 15 hours of filling and spraying each year. This reduced labour and equipment time while potentially reducing operator fatigue and exposure associated with mixing and loading

    Pesticide costs were compared annually with the farm’s 2017 program using updated product prices. On that basis, the average savings were approximately:

    • $5,850 CAD per year
    • 63% of the equivalent pesticide cost

    Pest and Disease Monitoring

    The growers retained responsibility for product selection and application timing. Products were rotated, and treatment decisions were made according to integrated pest management principles.

    Air-induction hollow-cone nozzles were installed in the uppermost nozzle positions. The larger droplets produced at the top of the spray plume were more likely to settle if they passed over the canopy, reducing the potential for off-target movement

    SWD monitoring

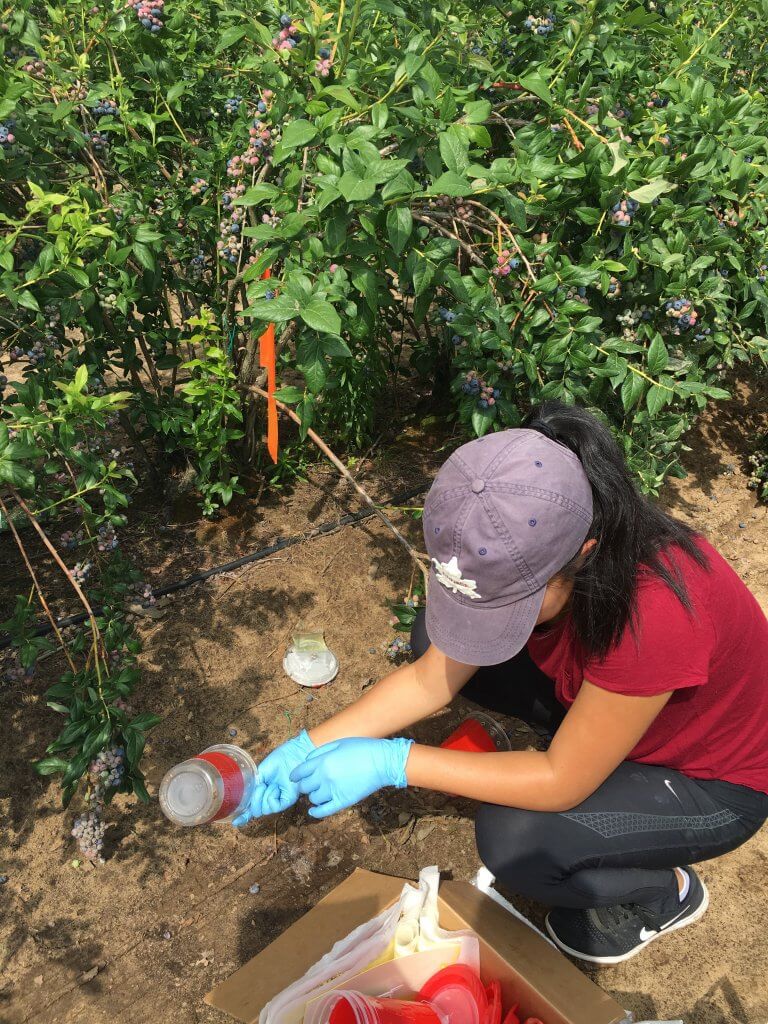
    Spotted-wing drosophila traps were monitored weekly from 2018 through 2020. Three traps were placed within the blueberry crop and one was placed in an unmanaged wild host along an adjacent treeline.
    Regional monitoring provided comparisons with other horticultural operations:

    • Up to 16 berry and tender fruit sites in 2018
    • Approximately 10 to 12 sites in 2019
    • Four blueberry, raspberry, and cherry sites in 2020

    Average SWD captures were higher at surrounding conventionally managed sites in 2018 and 2020. Captures were higher in the CAS planting in 2019. Across the three monitoring years, the overall difference was negligible.

    Trap capture does not necessarily predict the amount of fruit damage. The growers therefore also tested harvested berries regularly. SWD damage remained within commercially acceptable limits, and the growers reported satisfactory disease control.

    Because the monitoring was not replicated or subjected to statistical analysis, it cannot establish that CAS provided equivalent control under all conditions. It does indicate that, on this farm, lower spray volumes and pesticide use were compatible with acceptable commercial control.

    Yield and seasonal conditions

    Yield varied for reasons unrelated to sprayer calibration, including pruning intensity, labour availability, harvest timing, market conditions, and weather.

    • 2016: The baseline before any management changes. The farm harvested 12,076 flats, each containing approximately 9 lb of fruit.
    • 2017: Following the initial canopy-management changes, harvest increased to 18,335 flats; an increase of approximately 50%.
    • 2018: Yield remained essentially unchanged in the first year of CAS.
    • 2019: Harvest began about one month late. Low blueberry prices also prompted the farm to stop harvesting approximately one month early. Allowing for the shortened harvest period, production appeared comparable with previous years.
    • 2020: Anticipated shortages of seasonal labour during the COVID-19 pandemic led the growers to prune heavily and deliberately reduce the crop.
    • 2021: Little pruning was needed following the previous year’s heavy pruning. The resulting denser canopy, combined with unusually high precipitation, contributed to serious anthracnose pressure. More fungicide applications were made than in any other study year, although CAS-calibrated rates and settings were maintained.
    • 2022 and 2023: Spotted-wing drosophila pressure was low, anthracnose pressure was moderate, and production conditions were relatively typical.
    • 2024: Heavy rainfall contributed to an early start and finish to the season, but yield remained near normal.
    • 2025 and 2026: The seasons were generally typical, with no major production disruptions.

    These annual differences demonstrate why pesticide use, pest pressure, yield, and weather should be interpreted together. A low-use year may reflect either improved application efficiency or low pest pressure. Likewise, a high-use year may reflect exceptional disease pressure rather than a failure of the calibration method.

    Additional benefits reported by Falcon Blueberries

    The operation identified several benefits beyond direct pesticide and water savings:

    • Reduced pesticide use provided a positive response to questions from U-pick customers.
    • Lower environmental pesticide loading aligned with the growers’ production philosophy.
    • During a regional fungicide shortage in 2018, the farm had enough unused product to return some to the distributor.
    • Reduced early-season disease damage decreased the amount of fruit removed on the packing line.
    • Fewer tank fills reduced labour, machinery time, and interruptions during spraying.

    Practical implications for all highbush blueberry growers

    The results from this farm should not be interpreted as a recommendation to reduce pesticide rates by a fixed percentage. The important principle is to match the application to the canopy and confirm performance. Growers considering a similar approach should:

    1. Manage the canopy. Maintain a reasonably open and consistent target through regular pruning.
    2. Correct obvious sources of waste. Repair leaks, confirm positive nozzle shutoff, and prevent discharge during turns.
    3. Match the sprayer to the crop. Adjust fan output, air direction, nozzle positions, droplet size, travel speed, and liquid distribution.
    4. Measure coverage. Use water-sensitive paper or another suitable method at representative locations and depths.
    5. Reassess as the canopy changes. Settings that work before bloom may not be appropriate after the canopy fills.
    6. Respect the label. Do not reduce application volume or pesticide use below label requirements.
    7. Document the results. Record settings, weather, water volume, products, pest pressure, coverage, and crop response.
    8. Make changes incrementally. Confirm coverage and control before adopting larger reductions.

    The achievable reduction will vary with canopy size and density, sprayer design, product requirements, pest pressure, weather, and the applicator’s ability to verify coverage.

    Conclusion

    Over ten years, this southern Ontario blueberry operation substantially reduced spray volume and pesticide costs while maintaining commercially acceptable pest and disease control. These outcomes resulted from a coordinated production-system change rather than from a single calibration adjustment. Canopy management created a more accessible target, the new sprayer provided better control of air and liquid, and Crop-Adapted Spraying supplied a repeatable method for confirming coverage.

    The case study demonstrates that meaningful pesticide savings are possible when rate adjustment is based on crop structure, appropriate application technology, and measured coverage. It also reinforces an important limitation: results from one farm should guide further evaluation, not replace on-farm calibration, label compliance, or local validation.

    Here’s a narrated PowerPoint presentation of this study (includes data up to 2020):

    The monitoring portion of this project was funded by Niagara Peninsula Fruit and Vegetable Growers Association, Ontario Grape and Wine Research and Ontario Tender Fruit Growers in collaboration with private consultants.
  • Greenhouse Foggers

    Greenhouse Foggers

    Greenhouse application equipment spans from the humble squirt bottle, to gas-powered foggers, to robots equipped with hydraulic vertical booms. The variety of spray equipment available reflects a variety of needs, just as a carpenter’s toolbox contains different tools designed to do different things. In order to get the most out of foggers and misters, it’s important to understand how they differ from “conventional” hydraulic spraying.

    A greenhouse robotic vertical boom sprayer.
    A greenhouse robotic vertical boom or “tree” sprayer

    Mechanical and Chemical Spread

    For many greenhouses, water is the carrier that dilutes and delivers the chemistry to the target. Water has a high surface tension and tends to bead on target surfaces. Dr. Heping Zhu (USDA, Ohio) created some amazing videos using controlled water droplets and both waxy and hairy leaves. In first video we see how water beads up on a waxy leaf, and as it evaporates, the area touching the leaf surface remains small. In the second, we see the droplet get hung up on a trichome (leaf hair) and evaporate while suspended above the leaf surface.

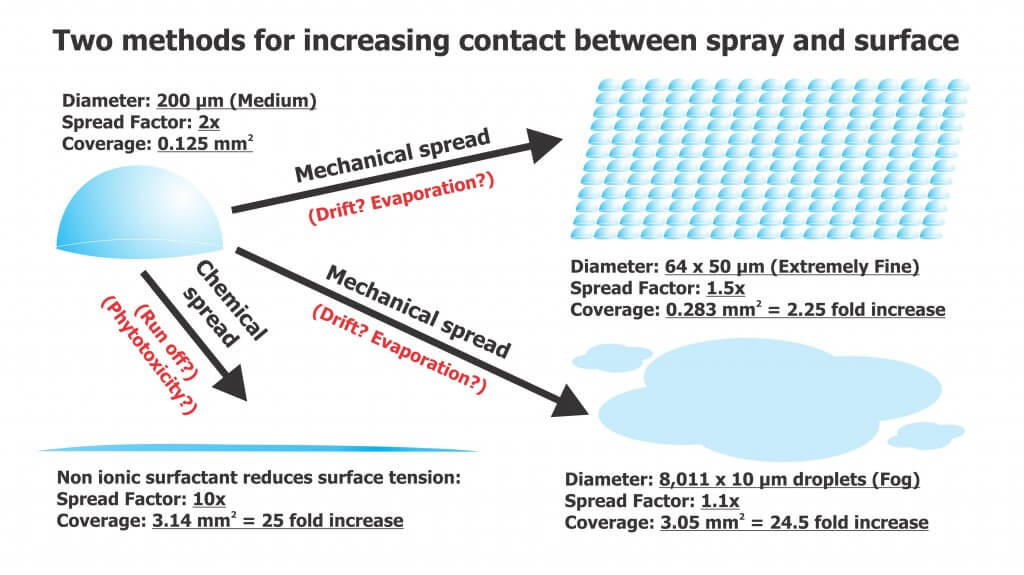
    Neither situation is desirable since the goal of spraying is to maximize the level of contact between droplet and target. Contact can be increased via mechanical spread or chemical spread (see figure below).

    The degree of chemical spread can be increased by adding adjuvants such as non-ionic surfactants to reduce surface tension. In the videos below we see the same controlled droplets with the same volume of liquid, but they now include a non-ionic surfactant. In the first video we see a greater degree of contact with the waxy target surface as the droplet spreads. In the second, the droplet does not get caught by the trichome, but splashes down onto the surface. Some product labels advise the inclusion of adjuvants and others are already formulated with them. In the case of surfactants, be aware of the potential for run-off and phytotoxicity.

    Mechanical spread requires us to break a single, larger droplet into several smaller volumes to increase the degree of contact. This approach usually comes with a caveat about evaporation, but this is rarely a concern in a humid greenhouse. As for the risk of drift, once again, in greenhouses it is a different story than conventional spraying. Spray drift is desirable! Lateral air movement is very important to encourage plant canopy penetration and prevent droplets from merely settling on upward-facing plant surfaces. While some equipment generates its own air, the air currents in the greenhouse are often the primary means for suspended droplets to circulate throughout the space. In either case, air could be considered the carrier instead of water. Too little air flow, or gaps in circulation, will reduce coverage. Too much air flow (specifically, greenhouse air circulation) may cause plants to exhibit stunting.

    Spray Quality (ISO)

    Here’s how ISO/DIS (5681:2019 Equipment for crop protection — Vocabulary 3.2.1) defines the spray quality produced by misters and foggers:

    • (3.2.1.13) MIST: “Spray with volume median diameter between 50 µm and 100 µm.”
    • (3.2.1.14) FOG: “Aerosol spray with volume median diameter under 50 µm where the droplets are effectively suspended in air with little or no settling by gravity.”

    These droplets do not behave like coarser droplets. For more information on droplet movement, survivability, and transfer efficiency, download Purdue Extension’s “Adjuvants and the Power of the Spray Droplet”.

    Water sensitive paper has limited utility when diagnosing coverage from foggers. Sophisticated optical scanners may be able to detect deposits as small as 25 µm, but this is open to debate. Manufacturers do not support the use of papers when quantifying deposits less than 50 µm , and some draw the line at 100 µm.

    In the following image, papers were used to diagnose coverage (from clean water) in a poinsettia greenhouse. The two papers on the right were located in the canopy and sprayed using a thermal pulse fogger and a hardware store style hand pump. The paper on the left was held directly in the path of the fogger while using the smallest nozzle provided with the unit. The spray enveloped the paper (and the person holding it). Close inspection showed tiny deposits, and the SnapCard app detected 4.5% coverage, but this greatly underestimates the actual deposition and does not account for the droplet count.

    UV dyes are the preferred method for analyzing coverage from foggers.

    Fogging and Misting Equipment

    Greenhouse spray equipment can be classified by droplet size, but also by the spray volume they employ.

    High Volume (HV)

    These applications are performed at pressures ranging from 500 to 4,285 kPa (75 to 700 psi) employing flow rates of 3.9 to 5.7 L/min (1 to 1.5 US g/min). They use standard label rates to accomplish a dilute application by broadcasting droplets larger than 100 microns. The goal is to cover all surfaces without incurring run-off. Examples of HV application equipment include backpack sprayers, trailed sprayers and boom sprayers. Practice and self-calibration are necessary to achieve the desired results when using manual HV sprayers.

    Targeted Low Volume (LV)

    These applications are performed at high pressures around 20,685 kPa (3,000 psi) employing flow rates approaching 1 L/min (0.26 US g/min), covering 93 m2 (1,000 ft2). They apply reduced rates over a given area and create droplets between 25 and 100 µm. These are concentrated sprays that do not result in wet foliage. LV applications are particularly good in high-humidity environments, when it is desirable to minimize the moisture on leaves. Examples of LV application equipment include aerosol cans.

    Ultra-Low Volume (ULV)

    These applications employ flow rates approaching 2 L/min (0.52 US g/min), covering 930 m2 (10,000 ft2). They require concentrated solutions, but apply reduced rates per area using droplets less than 25 µm. ULV applications will not raise greenhouse humidity and are a good choice when days are short and nights are long. They are also an excellent way to apply disinfectants for complete space sanitation before starting a new crop. It is important to ensure vents are closed and fans are off during sanitation. Examples of ULV application equipment include total release cans, auto foggers and thermal pulse foggers.

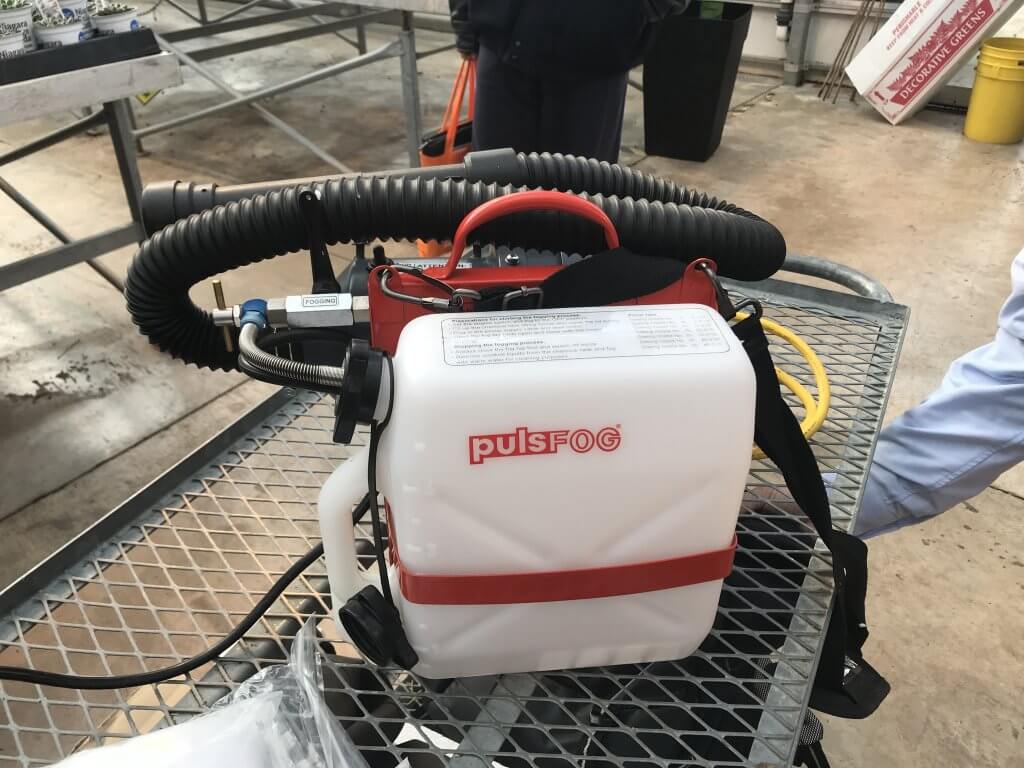
    PulsFOG hand-held ULV cold fogger

    Thermal pulse foggers are unlike other ULV equipment and warrant special consideration. The design of the pulse fogger has remained virtually unchanged since the 1940’s. Smaller, 24 hp machines are used in smaller operations but range up to large 175 hp machines. Tank size ranges from 10 to 50 L, where 10 L should be enough to cover 4,645 m2 (50,000 ft2) in about 10 minutes, depending on crop density. Their range is about 35 m (115 ft) from the point of release.

    Thermal Pulse foggers do not create aerosol using air shear – they use combustion (80 to 100 explosions per second) to shatter spray into a fog and propel it via positive pressure. Heat is a by-product of the engine, making it an unsuitable method for applying biological products.

    However, water-cooled foggers such as Dramm’s Bio Pulse Fogger reduce the exhaust temperature below 100 °C to make the application bio-rational. This has the added advantage of making droplet sizes more consistent and preventing spray from evaporating too quickly before it diffuses to the target.

    Dramm Bio Pulse Fogger.
    Dramm Bio Pulse Fogger

    Using a Fogger

    Dramm recommends that operators use approximately 1 L of carrier in 5 L of spray mix, but a higher proportion of carrier would be required for more viscous products. Start with a full tank of clean, high grade gasoline and once the fogger has been started, run it continuously until the application is complete. Leave it running even when moving between Quonset huts (see below).

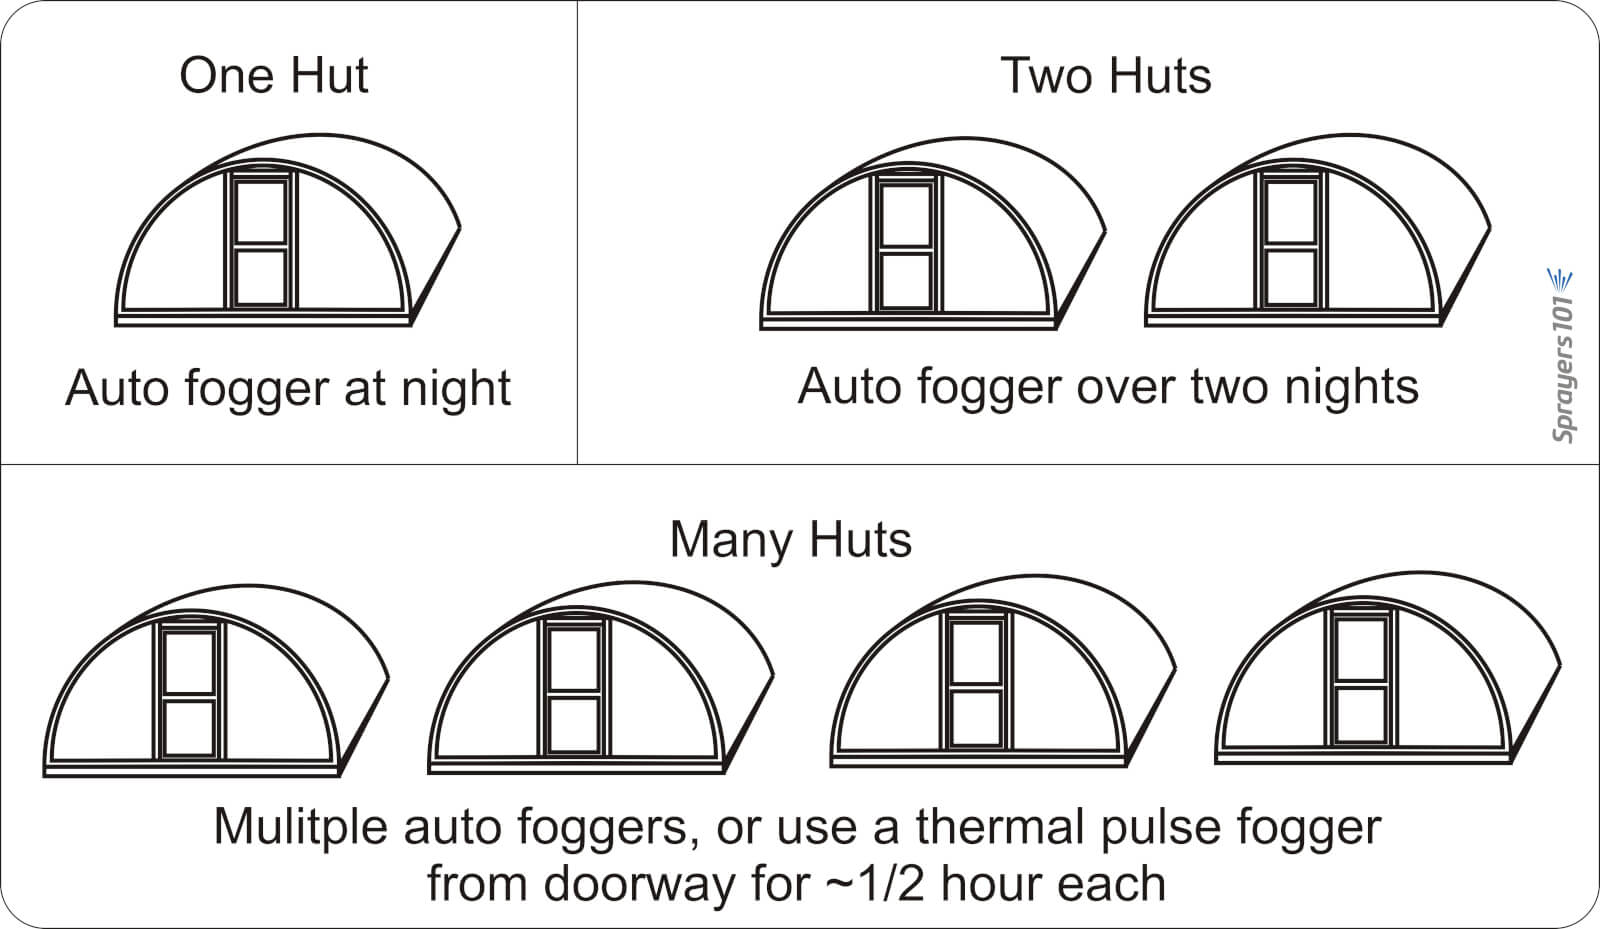
    Know when to use a pulse fogger versus an auto fogger. Auto foggers are convenient because the operator can set them and leave. However, in the case of multiple huts, it is more efficient and timely to use a thermal pulse fogger.
    Know when to use a pulse fogger versus an auto fogger. Auto foggers are convenient because the operator can set them and leave. However, in the case of multiple huts, it is more efficient and timely to use a thermal pulse fogger.

    Do not leave the manual fogger running unsupervised as an auto fogger: If they stay stationary, or aim directly at the canopy (as in hydraulic spraying), they could drench and potentially damage nearby plants.

    When fogging, aim between the plants, such as the alleys and between hanging plants. This allows the fog to expand and permeate canopies for the best coverage. When spraying is done, be sure to release the pressure created in the spray tank to prevent accidental back flow into the gasoline tank.
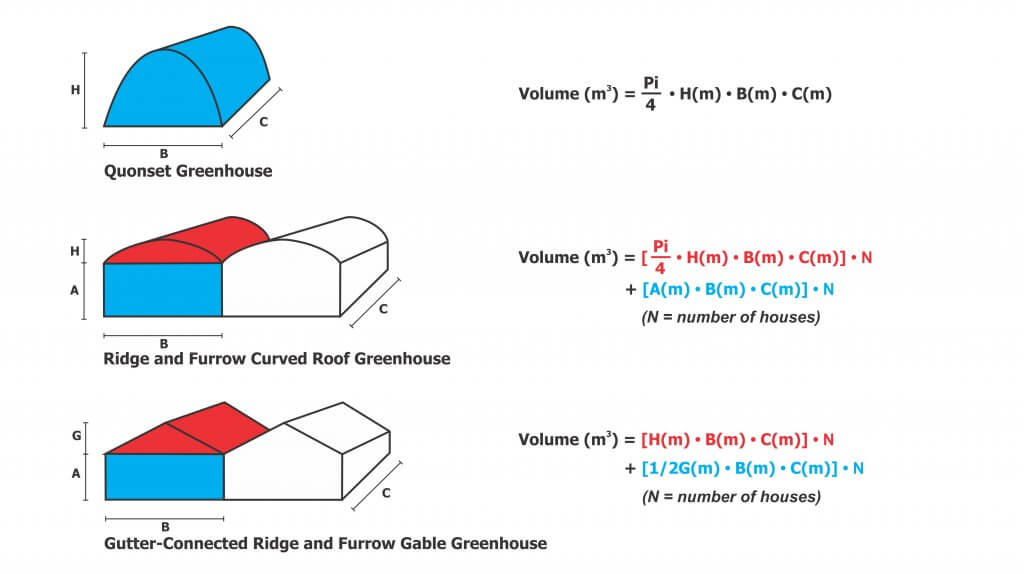
    And, because it’s convenient to include the math in this article, here are the formulae for calculating greenhouse volume to help you determine rates.

    Care and Maintenance

    HV, LV and ULV equipment requires model-specific cleaning and maintenance, according to manufacturer’s instructions. Even when sprayers are kept in prime condition, they are only as good as the operator’s understanding. When the wrong product is applied by the wrong machine using the wrong method, operators risk poor control, crop damage and increased potential for pesticide resistance. For more information, read the instructions that came with your sprayer, or contact the manufacturer.

    Thanks to Louis Damm and Dr. Heping Zhu for their contributions to this article.

    Try our calibration calculator:

  • Florescent Dyes for Spray Coverage Evaluation Part 2

    Florescent Dyes for Spray Coverage Evaluation Part 2

    In 2025 I ran a comparison between five florescent dyes and three UV lamps to determine which combination worked best for tracing spray deposition. If you haven’t read part 1, go do so and come back.

    In early 2026 my colleague and I used the winning combination to evaluate spot sprayer deposition in an onion field, and it worked “OK”. Only “OK”. In fact, I think many of the growers attending that twilight meeting were being polite when they said they could clearly discern the coverage. The fundamental problem was that we required almost complete darkness for the dye to be visible, and even then, you had to hold the lights just right. Photography was nearly impossible.

    That’s when my colleague showed me that I’d brought a knife to a gunfight when he illuminated the scene with a new UV lamp. It was a veritable lightsaber! The high wattage and different wavelength changed everything. I knew immediately that we would have to redo the dye comparison in “light” of this new development.

    The Old (left) and the New (right).
    UV dyes are more easily discerned at twilight or darker. Note that this image was taken while it was still light outside using the new UV lamp.
    A game changer.

    In September, 2026 we returned to Falcon Blueberries to paint the town red (well, green, orange and yellow). The images, which were taken with a cellphone, are stunning and yet they really don’t capture what we were able to see in person.

    Dyes Used

    We used the same dyes, mixed in the same ratios with NIS as in the previous study:

    • Risk Reactor IFWB-C81PT
    • Risk Reactor UVTRACER-G1PT
    • Eco Pigment Blaze Orange SPL15JX
    • Tri Art Fluorescent Yellow Tempura Paint

    We omitted the Phosphor Powder (Zinc Orthosilicate: Manganese CAS#11-47-2) used in the last study because the SDS really didn’t qualify it as non-toxic, and it’s not within reach of most people. Also, you won’t see any photos of the Tempura paint, because there was nothing to see. Historically, I’ve held out hope that it was a viable option, but it’s really only ever worked when super-concentrated and applied by a hand sprayer. So, if you’re doing that, go ahead, but I’ll never use it in a commercial sprayer again.

    Application

    We used the same Turbomist airblast sprayer, and the operational settings aren’t really relevant, here. Suffice it to say we made a single pass with their conventional settings, and left 8 rows between blocks (that is, a buffer of four rows on each side of the pass) to ensure we didn’t cross contaminate the dyes. Then we waited for dark.

    Even in daylight, dye helps visualize spray. Those top nozzles should have been off, but this was a post-harvest mock-up. When the bushes were larger and fuller there would have been better interception at the top.
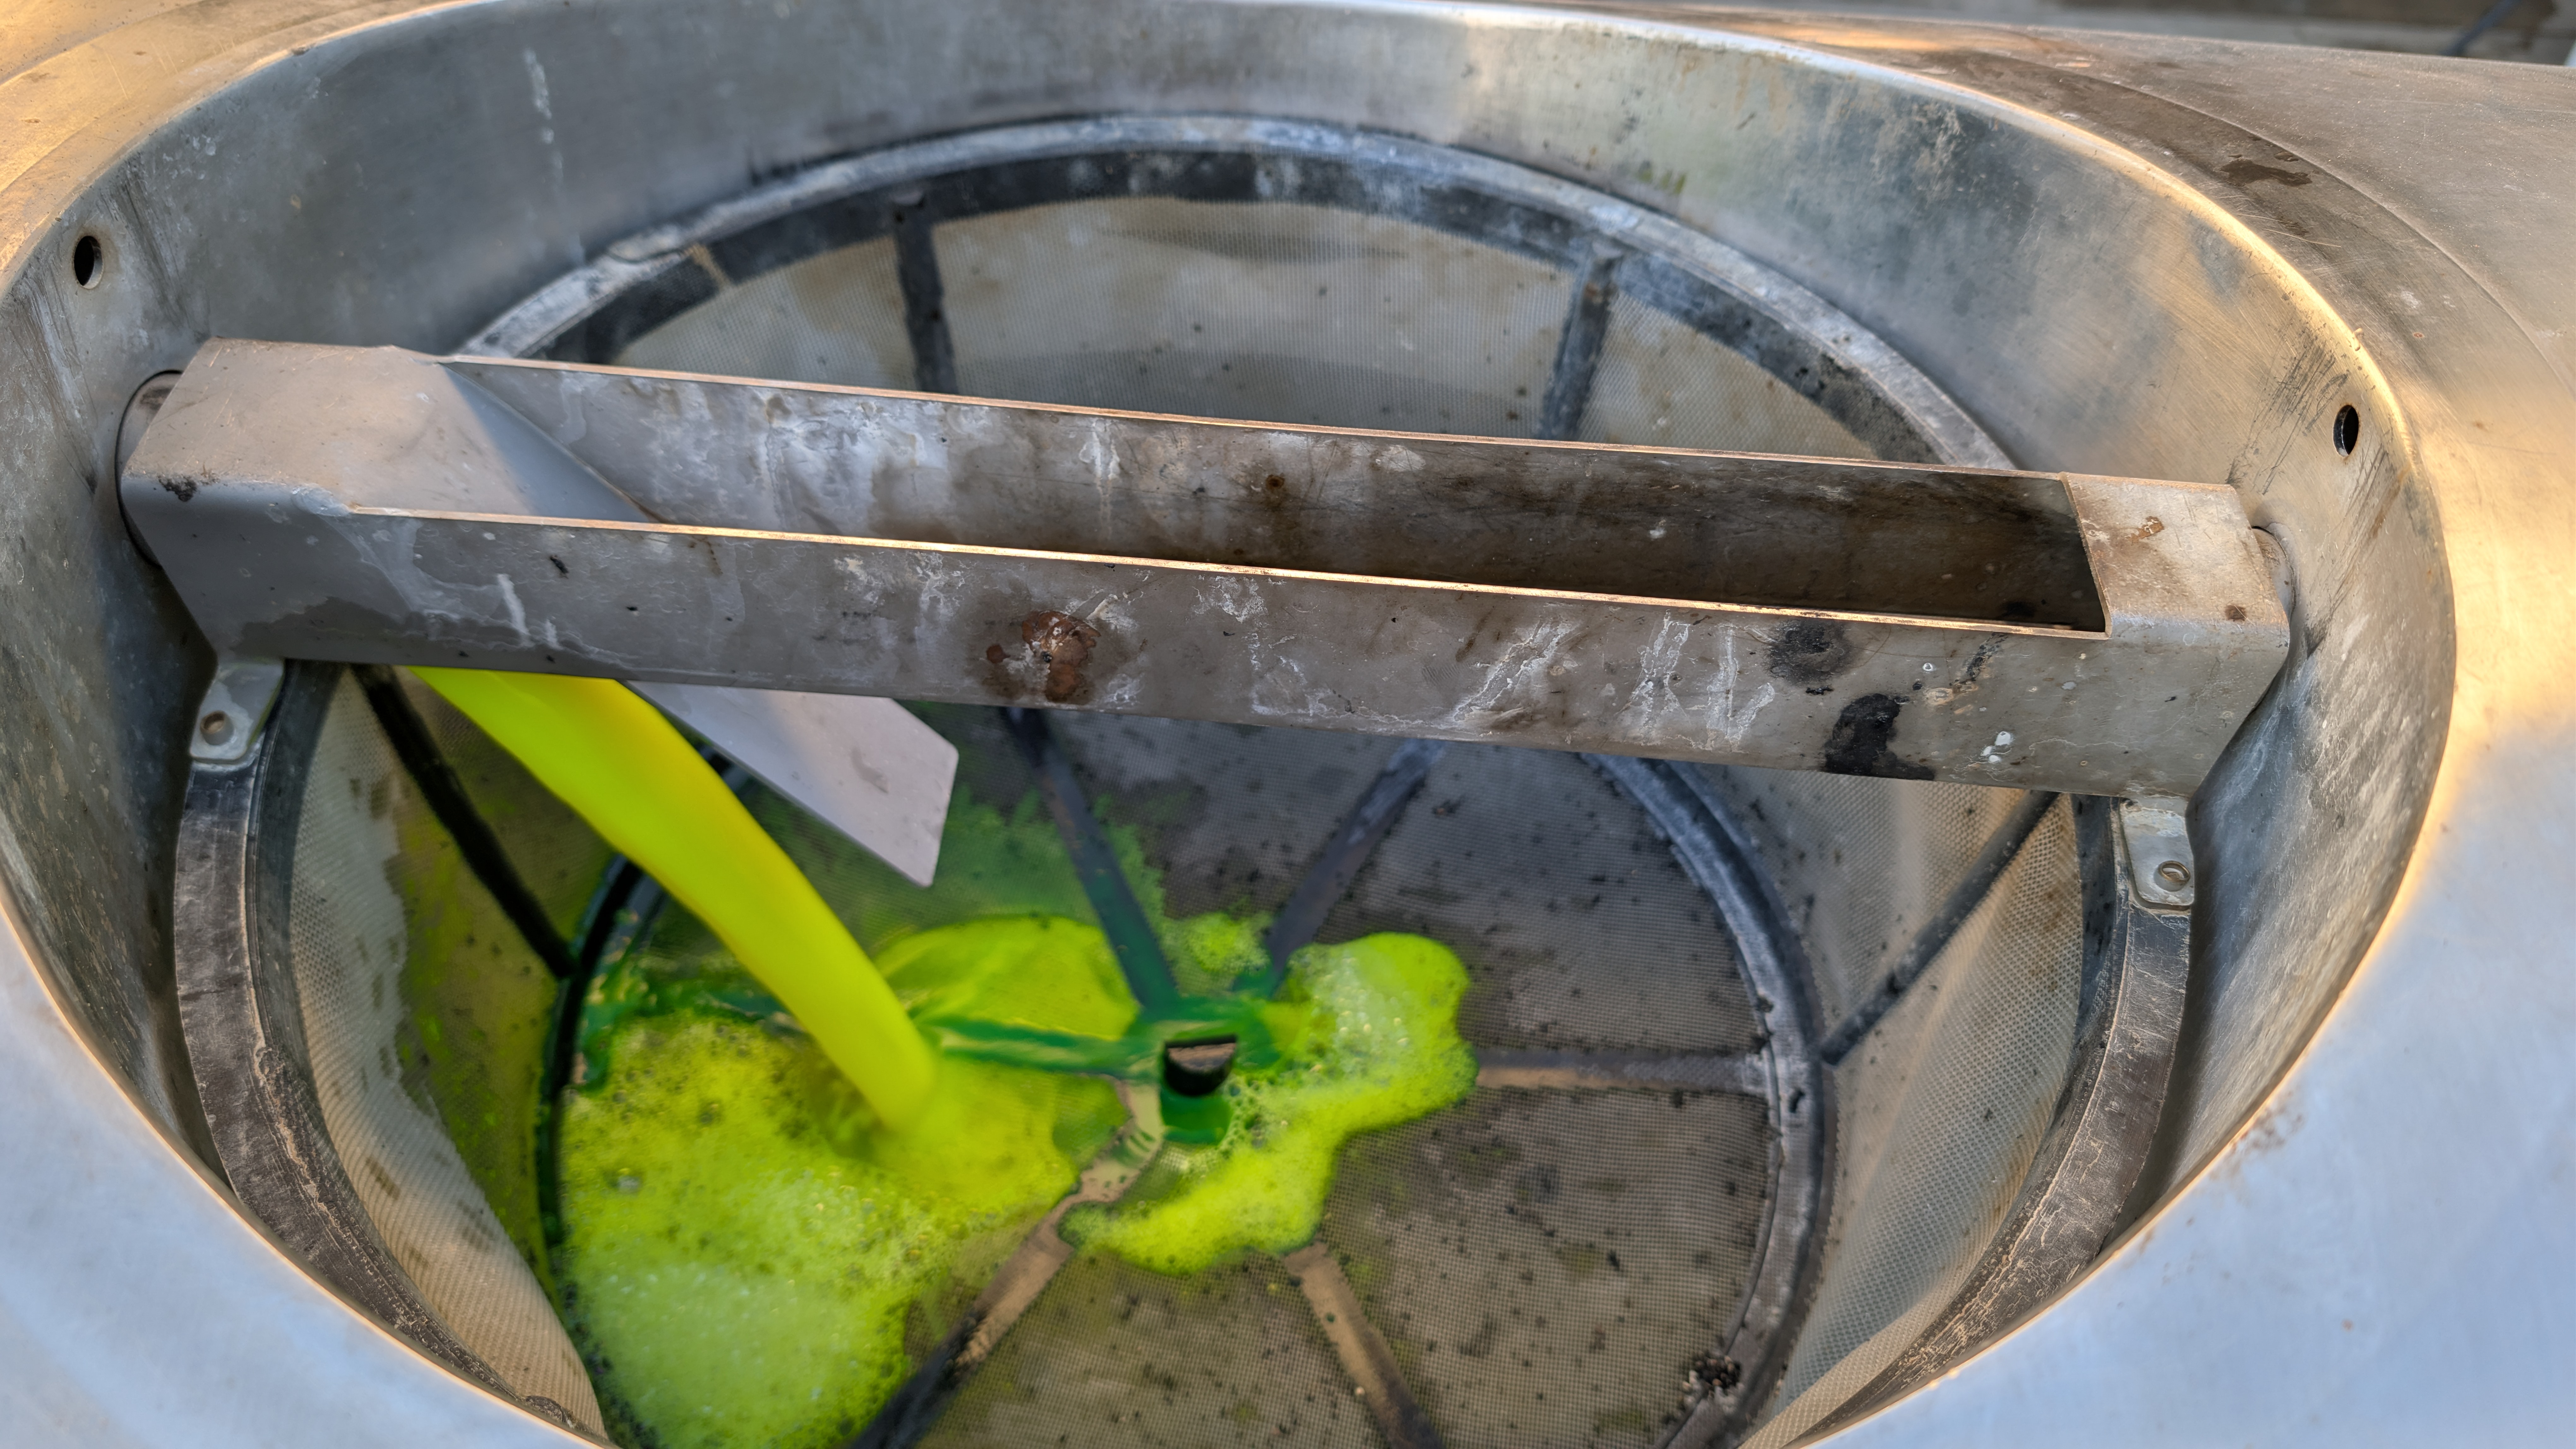
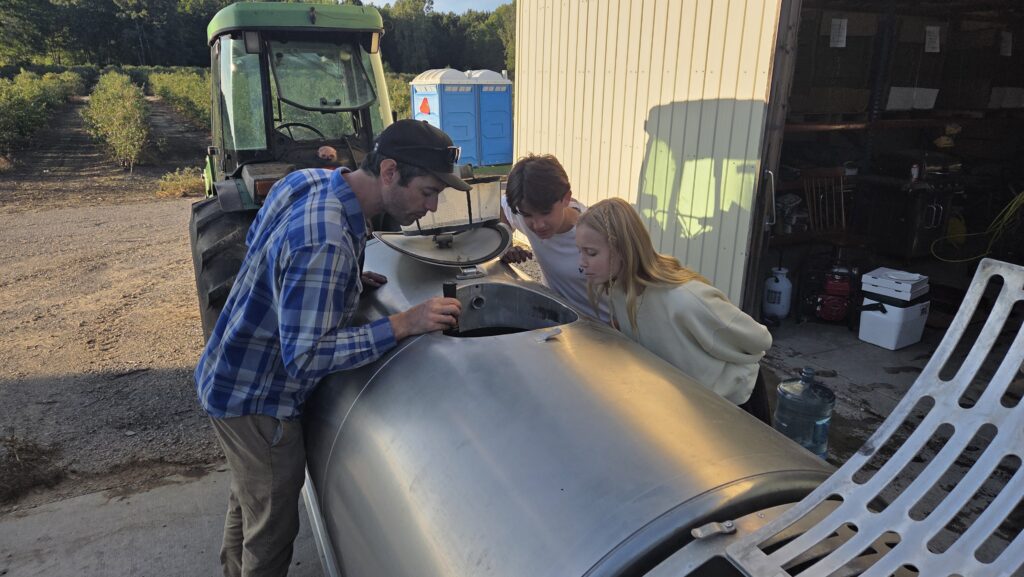
    Adding colourful, non-toxic dye to a completely clean sprayer proved very interesting to the next generation of Falcon Blueberries.

    Risk Reactor IFWB-C81PT

    This dye was pretty spectacular, which it absolutely was not when we tried last year using the weaker UV lamps.

    IFWB-C81PT – Immediate row (sprayed directly).
    IFWB-C81PT – Next row over (sprayed indirectly).

    Risk Reactor UVTRACER-G1PT

    This dye didn’t perform well. It didn’t seem to leave any residue other than accumulated runoff (drip points) at the tips of the leaves. It wasn’t the volume or adjuvant, because while there was some runoff with the other dyes, they were nothing like this. We speculated it was a function of the dye’s formulation. On the up side, we did capture a few good photos of bad coverage when applying a foliar product.

    Risk Reactor UVTRACER-G1PT. Incurred run-off on the immediate row (sprayed directly) and was not visible beyond this row.

    Eco Pigment Blaze Orange SPL15JX

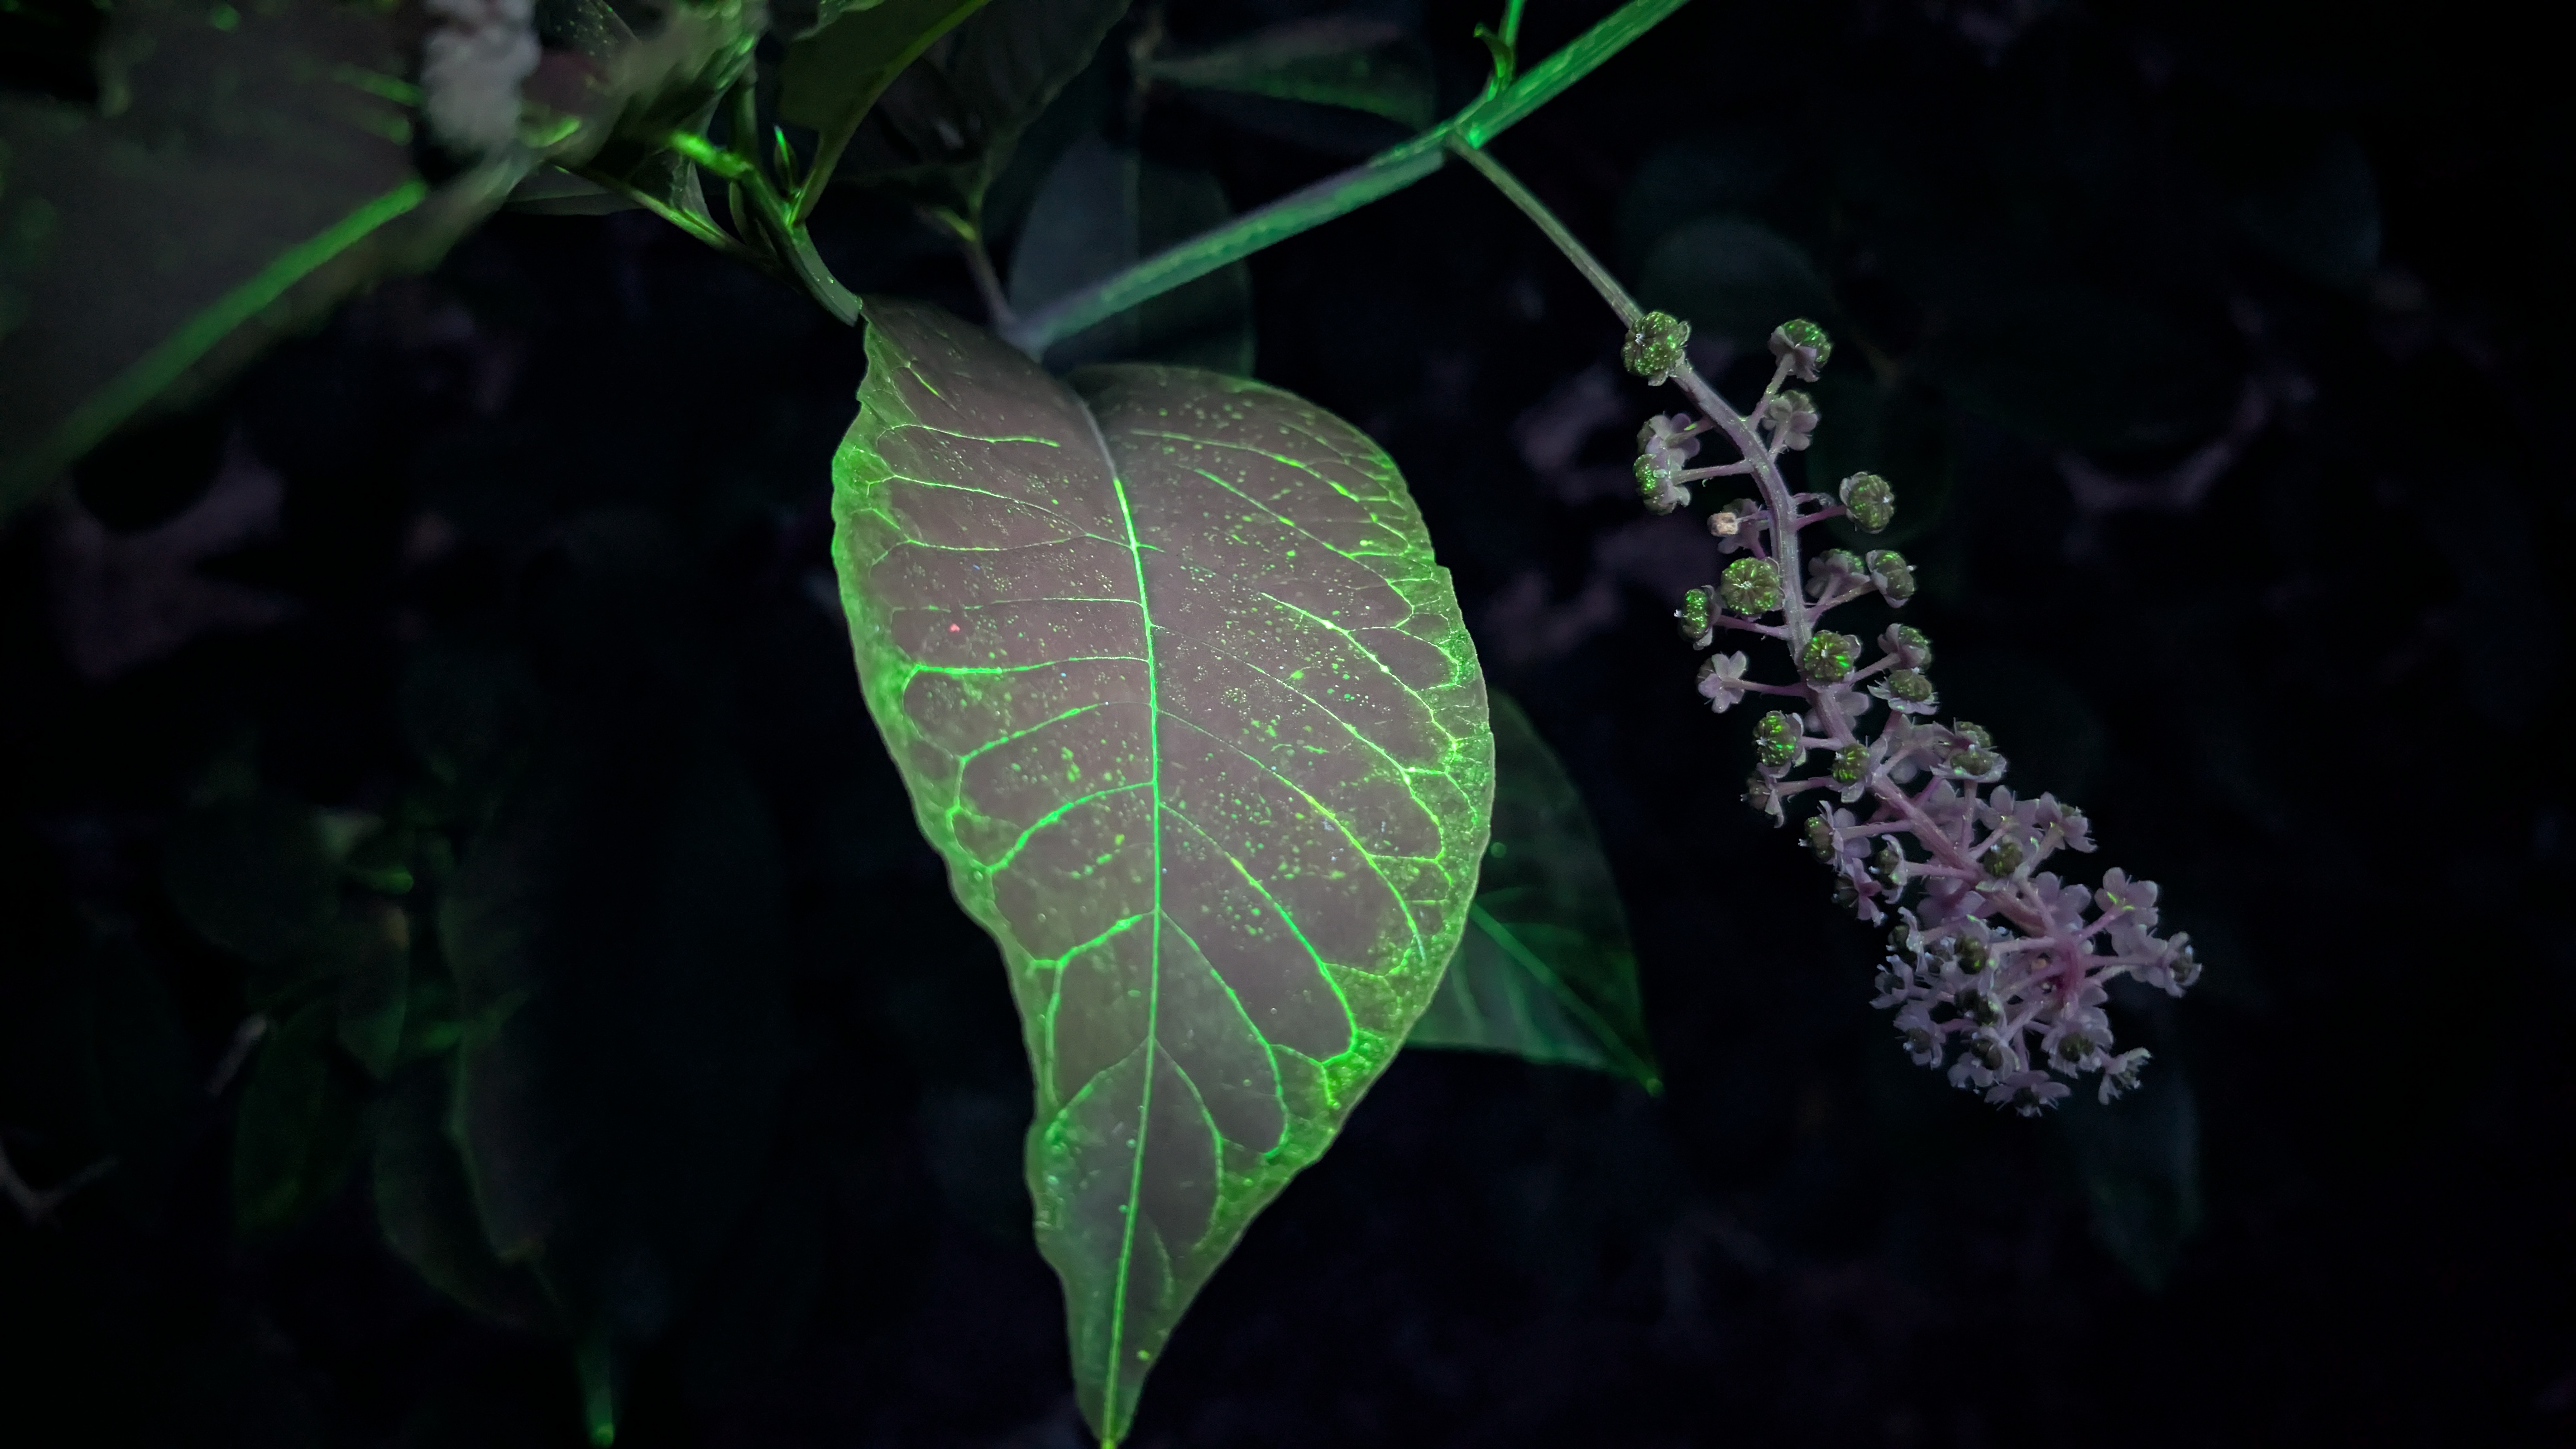
    Once again, this pigment put on a quite a show. Whole not unique to this dye, we noted particular accumulation along the veins of the leaves where we suspect the pigments (which are not water soluble) collected. It was also visible on the petioles, under-leaf surfaces and the stems, branches and trunks.

    Not only did we see it three rows out, but it was all over the ground, the hood of the tractor, the operator’s boots and pretty much everywhere the sprayer went.

    Blaze Orange – Immediate row (sprayed directly).
    Blaze Orange – Immediate row (sprayed directly). Under-leaf coverage.
    Blaze Orange – Next row over (sprayed indirectly).

    PPE

    The last few shots are a public service announcement. The TOPPS water protection project in Europe once performed a study on a variety of airblast sprayers to determine where pesticide residue accumulated. They concluded that the header was the worst offender (that is, the booms, air ducts and fan at the rear of the unit).

    While we saw evidence of dye deposition all over the sprayer, and on the tractor’s radiator grille (air inlet), the sprayer header was by far the most contaminated region. Always assume an unwashed sprayer has residue – wear your PPE.

    Four dyes, one pass each, and no wind left the sprayer header completely covered. We would expect far more accumulation following an actual spray day. Do not touch contaminated application equipment, even if it appears clean, without PPE.

    Thanks to Cesar Cappa, OMAFA Horticultural Weed Specialist for introducing the new UV lamp, for the photography, and for not complaining every time I blinded him with the light. Thanks to Falcon Blueberries for their time and collaboration.

  • Assessing wheat head coverage from Defy 3D and 3D Ninety nozzles

    Assessing wheat head coverage from Defy 3D and 3D Ninety nozzles

    We’ve been here before, haven’t we? I could rehash the explanation of why wheat head coverage is important, and define the variables involved, but perhaps you’re already in-the-know. Instead, new readers (and those requiring a refresh) can go give this article and this article a quick read and then come back. I’ll wait.

    Why perform another wheat head nozzle assessment? Primarily we do it so you don’t have to, but in this case there’s a specific problem we’re trying to solve and a “new” nozzle to explore.

    The problem (and some history)

    Let’s digress a little and use the historical experience shared by Clean Field Services (CFS) in Drayton, Ontario (cooperators in this study), to explain the problem and our objective.

    As broadacre sprayers evolve, nozzle technology has been lagging. Consider a basic field sprayer equipped with a centrifugal pump. Its performance curve exhibits a direct relationship between flow rate and pressure. In this case, the operator relies on a rate controller to bypass flow to maintain a target application rate across a range of travel speeds.

    However, bypassing changes system pressure, which inadvertently changes the average droplet size. Basically, increasing travel speed reduces droplet size and vice versa. This was the manner of sprayer used in Ontario more than 20 years ago when researchers demonstrated that TeeJet Turbo FloodJets, alternated front-to-back, provided excellent coverage of wheat heads at the T3 timing. This is what Clean Field Services used.

    However, some booms have obstructions that interfere with the aggressive spray angles produced by wide-pattern nozzles such as the Turbo FloodJet. CFS experienced this when they got a RoGator in 2012 and later an R-series Deere in 2017. At one point they tried using extensions to clear the obstruction, but this proved to be a nuisance and interfered with folding. They settled on GreenLeaf Technologies’ TurboDrop Asymmetric DualFan (TADF), which worked great, until the sprayer changed again.

    A visual history of wheat nozzles at Clean Field Services.

    Pulse Width Modulation

    Sprayer plumbing and control systems have evolved. The introduction of pulse width modulation (PWM) technology changed the way rate control is achieved. Rather than regulating flow by altering pressure, PWM intermittently interrupts flow at the nozzle. This decouples flow rate from pressure, preserving droplet size across a range of travel speeds. Most air induction (AI) nozzles, such as the TADF are not approved for use with PWM systems.

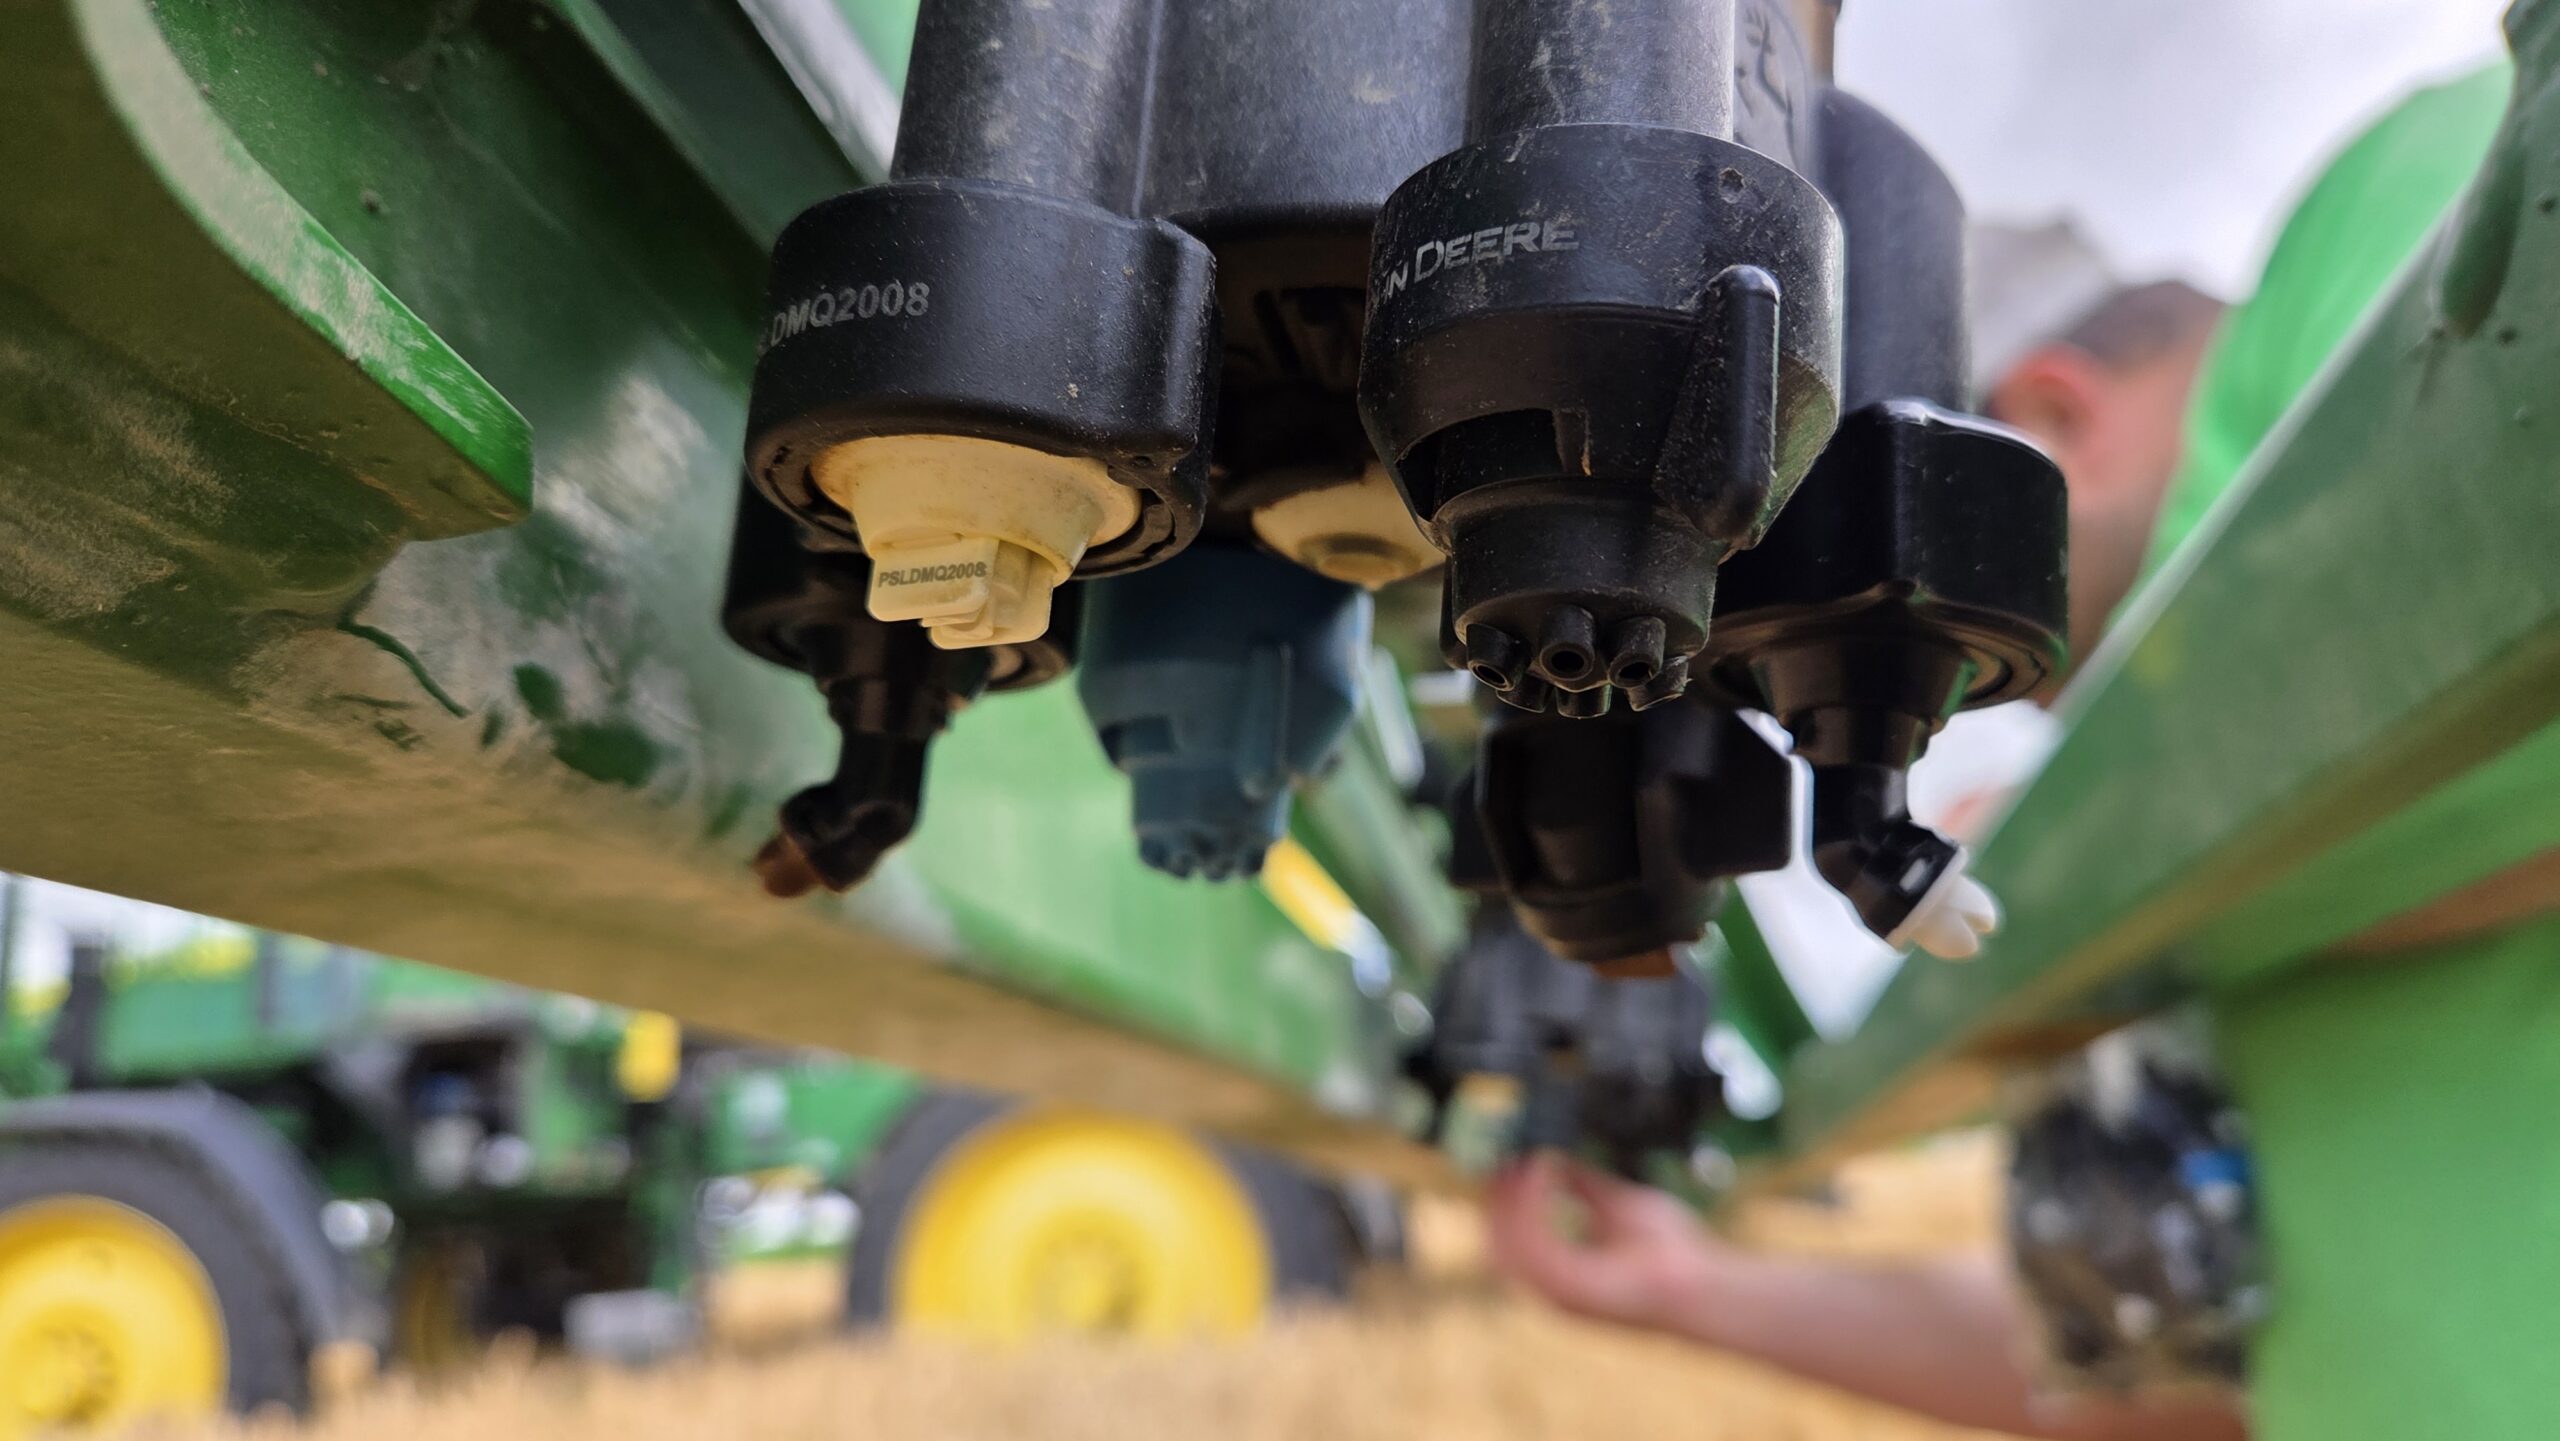
    John Deere’s ExactApply PWM system became available in 2017, and CFS got one in 2018. Operators could mount two nozzles in each position, creating opportunities for interesting new configurations. One of the recommended nozzles was the Defy 3D, which features a 38° angle and was developed by Hypro in collaboration with Syngenta to help control blackgrass in the UK. It performed well in drift-reduction studies relative to conventional flat-fan nozzles.

    Welcome to Canada

    CFS mounted a single Defy 3D ’08 in each nozzle body, and had problems. Canadian sprayer operators, on average, drive faster than their UK cousins. Even with PWM, the largest Defy 3D tip (the ’08) required a flow rate that increased system pressure, which in turn led to a drifty experience. Bad in itself, but also not ideal for angled applications, because finer spray deposits with the wind rather than ballistically.

    They tried throttling back, slowing down and/or adjusting water volumes, but felt they never really dialed it in. They settled on a Defy 3D ’08 in the B (rear) position, and an ’05 in the A (front) position at 21 km/h (13 mph) to apply 156 L/ha (16.67 gpa).

    Exploring a solution

    Wouldn’t it be nice to have your cake and eat it too? Drive faster, apply higher volumes and still mitigate drift? Enter the 3D Ninety, with claims of good fungicide utility while producing a significantly coarser droplet than the Defy. They came out in 2021, and yet they are still difficult to find in North America. This study establishes baseline panoramic coverage from the Defy 3D, then benchmarks it against the 3D Ninety and a hybrid configuration at a faster travel speed.

    Experimental design

    The trial took place in a mature wheat field in Drayton, Ontario on July 22, 2026. Temperature was 15°C, and while generally windy, we operated in an area protected by a windbreak, reducing windspeed from an ambient 18 km/h to an average 8 km/h at boom height.

    Sprayer settings

    A John Deere See and Spray Premium (410R) was used in the study. For each condition, we isolated a section of seven nozzles in the middle of the left and right booms (as far as possible from boom tip and chassis). Nozzles were on 50 cm (20″) spacing, so this spanned 2.7 m. The sprayer was set to a 70% D.C., and the boom was 50 cm (20″) above the wheat heads. The treatment conditions were as follows:

    TreatmentForward NozzleRear NozzlePressure (psi)Travel speed (mph)
    1’05 Defy 3D’08 Defy 3D2513
    2’05 3D Ninety’08 3D Ninety4016
    3’05 Defy 3D’08 3D Ninety4016
    Operational settings and nozzles for each treatment.
    In all treatments the ’05 faced forward and the ’08 faced back.

    Samplers

    A series of four posts were positioned in the wheat, spaced 0.5 m apart and centred on the corresponding section of nozzles. The samplers were SpotOn water sensitive papers (WSP) mounted in custom holders to orient four papers at 90° to the sprayer: Advance (facing the sprayer), Left, Retreat (facing away from the sprayer) and Right.

    A series of samplers positioned at wheat head height, 50 cm apart, centred on the swath produced by the section of seven trial nozzles.

    A parallel tramline approximately 1 m from the samplers provided access. The sprayer began spraying 15 m (50 feet) before the samplers and continued spraying the same distance beyond them. Once the spray settled, the samplers were retrieved. A single pass represented a repetition and there were three passes per treatment.

    Papers were digitized using a DropScope (SprayX) and the analysis was performed in R (v. 4.6.0), leveraging the rpy2 library for integration with Python within the Colab environment.

    What we saw

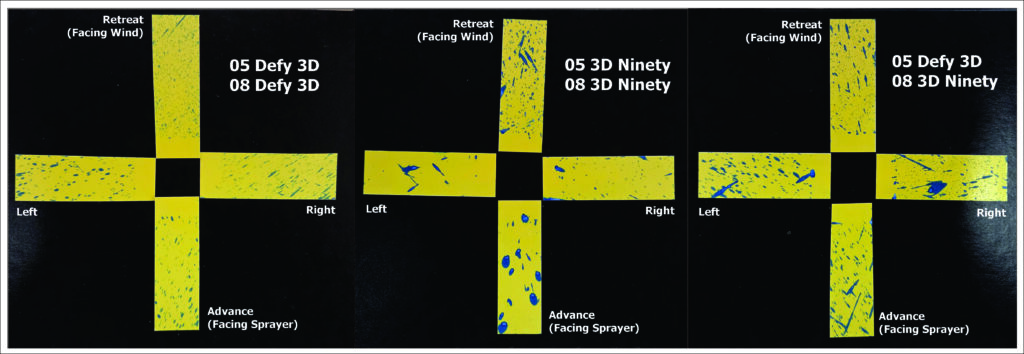
    The following image shows a typical coverage pattern for each treatment. While WSP is not able to determine droplet size accurately, it can certainly reveal relative differences. It was clear that the Defy 3D produced smaller droplets than the 3D Ninety, and that there were far more of them. The hybrid condition shows a more heterogeneous coverage pattern, which would be expected given it represents a greater span of droplet sizes than either nozzle design used alone.

    Typical coverage pattern from each treament.

    Defy 3D

    3D Ninety

    Hybrid Defy 3D and 3D Ninety

    Continuing with general observations, we can average the coverage measured on each plane, on each sampler, for each treatment. When spoiled samplers were removed from the study (it happens), coverage can be described as either the area covered, or the number of deposits per area. With no exploration of variability, we see that the Defy 3D resulted in the greatest average coverage as represented by either metric.

    TreatmentnMean Area Covered (%)Mean Deposits/cm²
    Defy 3D463.73126.35
    3D Combo443.2287.64
    3D Ninety473.0293.77

    We can drill down and explore coverage by WSP orientation as well, this time including some measure of variability (standard deviation). As a matter of housekeeping, there was no evidence that repetition or post position had any meaningful bearing on coverage results (Pearson p of 0.422 and 0.455 and Spearman p of 0.267 and 0.217). We see the highest average number of deposits on the retreat side (facing the wind) in all treatments. Similarly, and excepting the combination treatment, we see the greatest average area covered on the same plane.
    TreatmentOrientationnMean Deposits/cm²SDMean Area Covered (%)SD
    3D ComboAdvance1183.0053.584.982.80
    3D ComboLeft1163.3638.071.671.24
    3D ComboRetreat10138.2058.384.121.93
    3D ComboRight1272.0063.842.291.93
    3D NinetyAdvance1167.8252.923.413.38
    3D NinetyLeft1242.2549.831.961.61
    3D NinetyRetreat12191.1754.204.892.07
    3D NinetyRight1271.6750.301.871.46
    Defy 3DAdvance12124.9265.484.192.64
    Defy 3DLeft1280.7549.752.481.74
    Defy 3DRetreat10207.70115.845.553.45
    Defy 3DRight12105.5875.922.982.83

    We can illustrate this using box and whisker plots, which show all the data as well as the relative span of each treatment. This makes it easier to compare the treatments and determine if any differences in average coverage were significant or not.

    We can illustrate coverage in an even more intuitive manner using a rosette-style graph. Here we see the average deposit density or the percent area covered for each treatment on each plane. Note that the discrepancy between the Advance (shadowed by wind) and Retreat (wind-facing) side is far greater when the coverage is represented by droplet counts rather than area covered.

    Average coverage on each plane for each treatment, as represented by deposit density.
    Average coverage on each plane for each treatment, as represented by percent area.

    Interpretation and discussion

    Deposits/cm² and percent area covered were strongly positively associated (r = 0.75), indicating that higher deposit counts generally corresponded to greater percent coverage. The relationship wasn’t perfect, suggesting that other factors also influenced coverage and leaving room for interpretation.

    The Defy 3D produced the highest overall coverage, as reflected in total deposit counts. This is consistent with the fact that it emits a higher proportion of finer droplets relative to the 3D Ninety. While finer droplets can improve coverage, they are also more prone to drift and tend to deposit on the downwind face of vertical targets. We have evidence of this in all treatments, which showed more deposits on the Retreat (windward) face than on the Advance face, which was sheltered from the wind.
    This deposition pattern is likely influenced by the rear-facing nozzle configuration (an ‘08), which delivers a higher application rate than the forward-facing nozzle (an ‘05). With higher boom heights or stronger wind conditions, this configuration may be less effective, as reported in previous studies. In this comparison, the Defy 3D also exhibited the greatest variability, suggesting greater sensitivity to such conditions.

    The 3D Ninety and hybrid treatments were difficult to separate based on overall coverage. There was no significant difference in the magnitude of coverage between them, although the hybrid condition showed a more balanced distribution of deposits between the Advance and Retreat faces. In contrast, the 3D Ninety would be expected to produce a coarser spray that is less susceptible to deflection, assuming boom height is sufficiently low to maintain droplet trajectory. Despite this, it recorded more deposits on the Retreat face than the hybrid condition. We have no explanation.

    The hybrid configuration was designed to improve deposition balance by combining complementary spray characteristics. The forward-facing nozzle produced finer droplets, which can be carried along by the sprayer’s forward momentum to enhance forward deposition. The rear-facing nozzle produced coarser droplets at a higher application rate, compensating for lower droplet numbers while counteracting forward momentum to improve retreat-side coverage.

    Although the hybrid treatment appeared to provide a more even distribution of deposits between the Advance and Retreat faces, it is uncertain whether this would translate into improved biological efficacy. Further trials would be needed to evaluate whether this deposition balance leads to measurable yield gains.

    It is also important to note that both the 3D Ninety and hybrid treatments were applied at 25.7 km/h (16 mph), nearly 20% faster than the Defy 3D treatments. This indicates potential for higher productivity. Given the relatively balanced deposition observed, a combination of a forward-facing Defy 3D nozzle and a rear 3D Ninety nozzle may offer improved resilience to changes in boom height and wind speed while maintaining adequate coverage at higher travel speeds.

    Thanks to Clean Field Services for their participation in this study, thanks to Agflow Canada (Hypro / Shurflo) for donating the 3D Ninety’s, and thanks to Cesar Cappa, OMAFA weed specialist in horticulture for patiently explaining how to use R more effectively.

  • Comparing Water Sensitive Paper Brands

    Comparing Water Sensitive Paper Brands

    Introduction

    Spray coverage describes the degree of contact between spray droplets and the target surface area. This metric can be used to predict the success of an application. One of the easiest methods for visualizing coverage is to use water sensitive paper (WSP), which is a passive, artificial collector that turns from yellow to blue when contacted by water.

    WSP is often used to evaluate iterative changes to a spray program. Placed strategically throughout a target canopy, or directly on the ground, achieving uniform, threshold coverage translates into improved efficacy, reduced waste, reduced off-target contamination and reduced risk of pesticide resistance development. WSP were also used to develop a system that measures the area covered by the effective radial distance in an attempt to relate the area covered by a stain to a larger area where sufficient pesticide activity is taking place.

    WSP tends to underestimate the spreading effect that can occur on plant surfaces (especially when surfactants are used), but they are effective as a relative index.

    A brief history of WSP

    In 1970, a journal article described a new method for sampling and assessing spray droplets. Photographic paper treated with bromoethyl blue created a yellow surface that changed colour when it encountered moisture. The pH-based reaction was fast and irreversible, leaving a distinct blue stain to mark the deposition.

    Ciba-Geigy Ltd. made water sensitive paper commercially available in 1985 (later as Novartis in 1996 and as Syngenta since 2000). It is produced in several formats, but aluminum foil packages of 50, 76 x 22 mm (1 x 3 in.) papers are the most popular. Odds are if you’ve ever used water sensitive paper, it originated from Syngenta in Switzerland. In 2023 I noticed that the papers now say “made in Germany.”

    Change of manufacturing location?

    In recent years, two new options have been made commercially available: Innoquest’s SpotOn Paper (United States) and WSPaper (Brazil). At the time of writing, there has been no impartial comparative evaluation of these three products.

    Once dry, the blue stains on WSP are irreversible and papers can be stored for long periods of time. However unstained portions will continue to react to moisture from humidity, dew, or fingerprints, so care must be taken in their handling and storage.

    Comparing WSP brands

    The three commercially-available brands of WSP were subjected to a series of comparisons. The intention was not to rank these products, but to determine if they performed in a similar fashion and to alert users to any significant differences.

    Packaging and Appearance

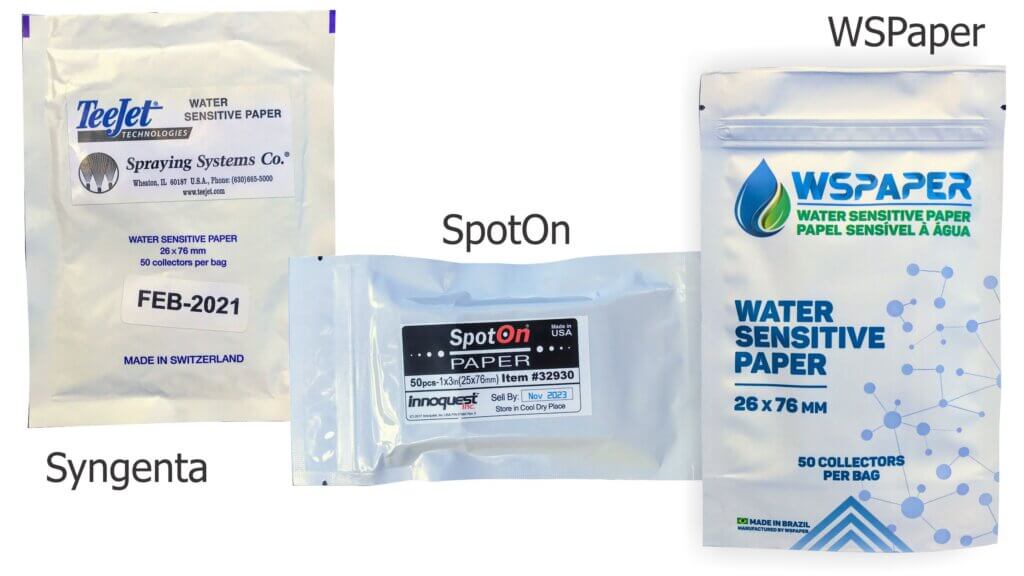
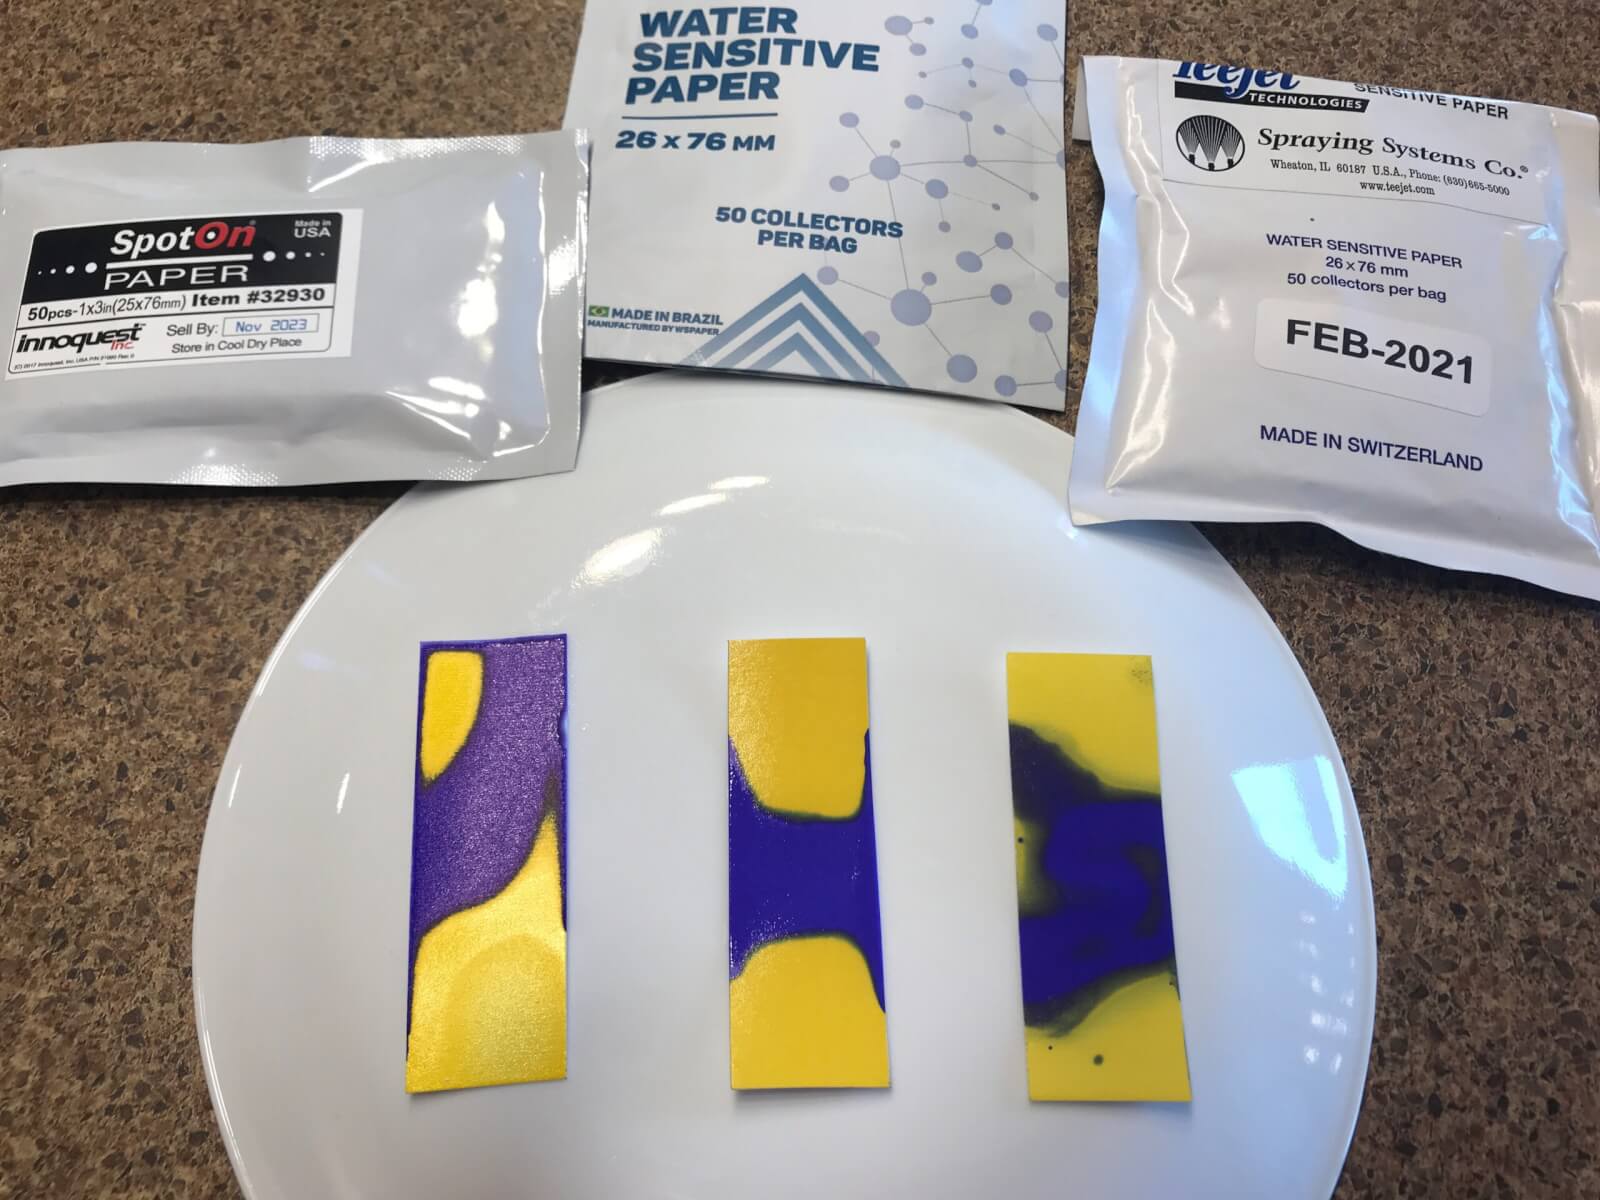
    Each package was donated for the study. The SpotOn (SO) papers had a “sell-by” date of November 2023, the Syngenta (SY) papers (provided via Spraying Systems Co.) were dated February 2021 and the WSPaper (WS) was their newest formulation (white package, not silver), received June 2021. The comparison was performed on July 5, 2021.

    WSP packages.

    Each product was a foil or plasticized bag of 50, 26 x 76 mm papers. SO and WS had a re-sealing feature similar to that of a sandwich bag. SO also included a package of silica gel desiccant to capture moisture and a pair of plastic forceps to facilitate handling.

    Users are encouraged to label papers to ensure they know their relative position and sprayer pass for later analysis. It was possible to write in ink on the faces of the SY and SO papers, but not WS. It was possible to write on the back of all brands.

    The three papers were different shades of yellow. Further, in the author’s experience, the colour can be visibly different between batches of the same brand. In the case of larger experiments where more than 50 papers are required, it would be prudent to ensure papers are not only from the same manufacturer, but the same production batch. This would not be an issue when subjectively comparing papers, but when using software that employs colour thresholding to identify deposits, it could create artifacts. Presently, only Syngenta has a batch number (found on a sticker on the back of the bag).

    Bleed-through

    WSP is often placed in foliar canopies which are subject to dew and transpiration that can cause the papers to react prematurely. This can be particularly limiting when moisture soaks through the backs of papers. Each brand of paper was placed face-up on a drop of water to see if the water would bleed through.

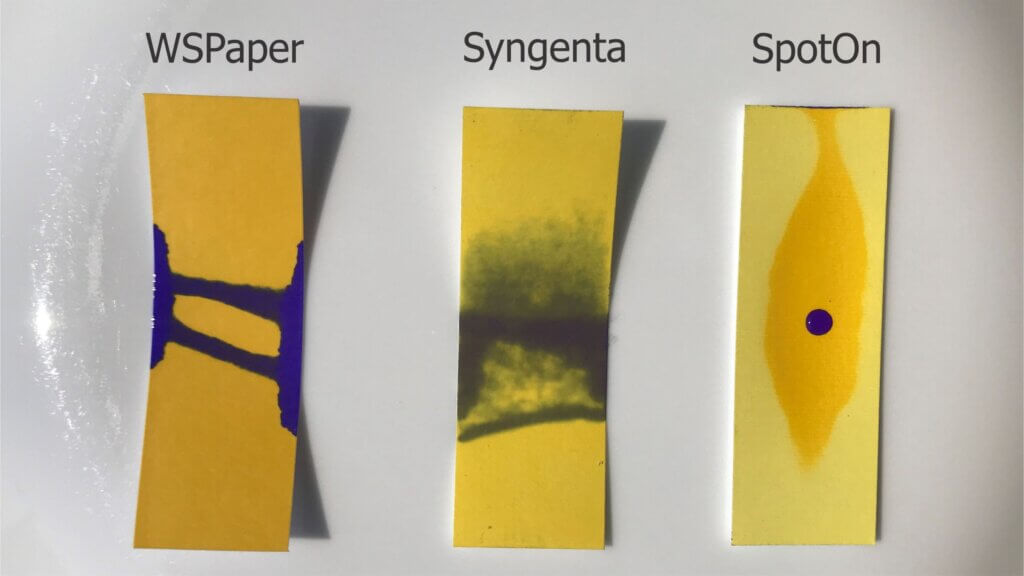
    Three brands were placed on a single drop of water. Within five minutes, WSPaper and Syngenta brands wicked the water through, causing a colour reaction. SpotOn did not, although the yellow surface darkened. When a drop of water was applied to the face, the SpotOn paper still produced a blue stain.

    WS quickly curled as the water wicked in from the edges. Within five minutes the water soaked through from the back as well. Within five minutes SY also curled, but the colour reaction was entirely due to water soaking through and not wicking along the edges of the paper. SO did not curl and there was no colour reaction save a minor wicking reaction at one edge. It did however produce a dark yellow patch. In order to see if a colour reaction was still possible, a single drop of water was placed on the face and the colour reaction was distinct and instantaneous.

    Note: Others have since replicated this experiment and reported that the response depends on the amount of water used and how long you leave it. We repeated our experiment with higher volumes and longer wait times (see image below). Ultimately, no brand of WSP is water proof from the back. Nevertheless, with small volumes of water (such as from dew) the original assessment of each brand is still valid.

    A replication of the bleed-through experiment with the same batch of papers was performed with higher water volumes and a longer duration. Eventually, all three brands bled through. (SpotOn left, WSPaper middle, Syngenta right).

    Deformation and drying time

    Users of water sensitive paper may be familiar with its occasional tendency to curl when one side is sprayed. In extreme cases, this movement could create smears if the paper contacted other wetted surfaces in dense foliage. The degree of curling was significantly different by brand, with SY becoming convex when wet and then flexing back into a concave form once dry. WS deformed as well, but only to a minor degree. SO did not appear to deform at all. Syngenta has noted that the degree to which their papers curl depends on the batch. Their manufacturing process has changed over the years in response to regulatory requirements and minor adjustments are still occasionally made.

    Once dry, each brand of WSP tended to curl to different degrees. Syngenta curled the most and SpotOn the least if at all.

    There was no appreciable difference in the time it took for any brand to dry. This is based on attempts to smear papers every 30 seconds. All were dry in under five minutes.

    Experimental design

    While there is considerable variability inherent to spraying, every effort was made to maintain consistent conditions. Papers were sprayed in a closed room with no appreciable air currents (21.5 °C and 64% RH). Papers were paired randomly, side-by-side on a plastic sled. The sled was pulled at 2.5 kmh (~1.5 mph) through the centre of a spray swath produced by a TeeJet XR80015 positioned 50 cm (20 in.) above the targets. The nozzle operated at 2.75 bar (40 psi) to produce ~270 L/ha (~29 gpa) with Fine spray quality. Six passes were made, producing four sprayed papers for each brand.

    All papers were dry to the touch after two minutes. They were removed to a cooler, low humidity space and were digitized and analyzed using the SprayX DropScope (v.2.3.0) within an hour of spraying. We noted that while WS and SO fit easily into the DropScope port, the SY papers were sometimes slightly wider and had to be forced. Learn more about how to digitize and analyze WSP in this series of articles.

    Screen capture from DropScope’s smartphone app.

    The “ground” option was selected, and each brand of paper was processed using its specific spread factor. DropScope has a detection threshold of 35 µm. This is appropriate as the smallest droplet diameter that can be resolved by any brand of WSP is ~30 µm (Syngenta, Innoquest, SprayX – Personal Communication).

    Percent surface covered

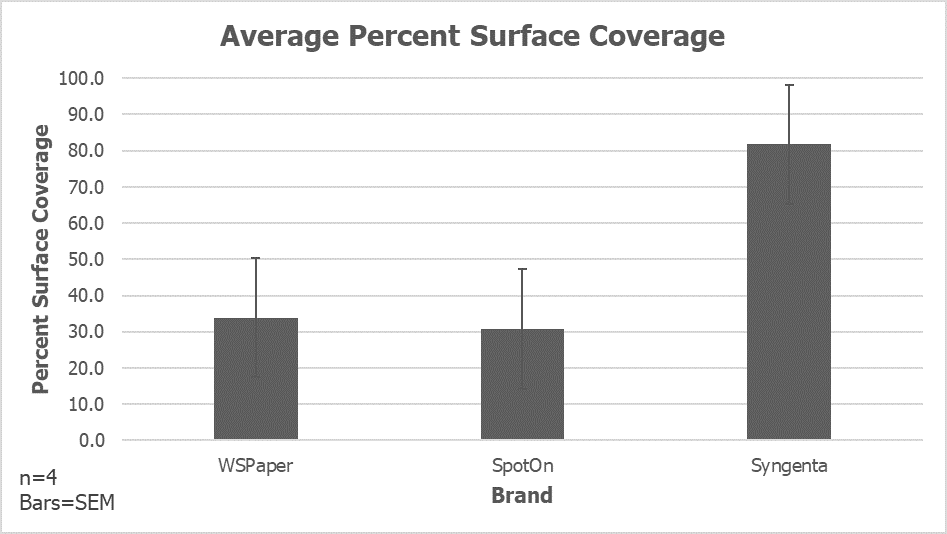
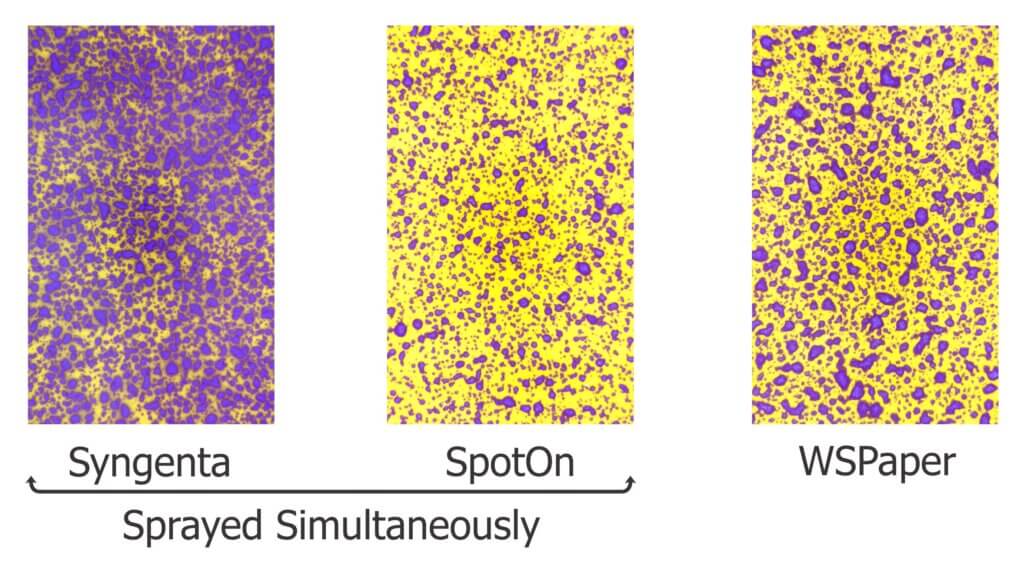
    The average percent surface covered was calculated with standard error of the mean for each paper. WS and SO produced similar values between 30 and 35%. While all three brands exhibited similar variability, SY approached saturation at approximately 80% coverage. Therefore, WSPaper exhibited a slightly higher degree of spread than SpotOn, while the Syngenta paper exhibited a significantly higher degree of spread.

    For reference, it can be difficult to determine if a stain represents a single deposit or is the result of multiple overlapping deposits. This becomes a problem when the surface of the WSP exceeds 20% total coverage. Further, it becomes increasingly difficult to distinguish a stain from the background, unstained surface when papers exceed 50% total coverage.

    Average percent surface coverage by brand.
    DropScope-digitized images of three brands of WSP. The Syngenta and SpotOn papers were sprayed simultaneously while the WSPaper was sprayed in a subsequent pass. WSPaper exhibited a slightly higher degree of spread than SpotOn, while the Syngenta paper exhibited a significantly higher degree of spread.

    Deposit density

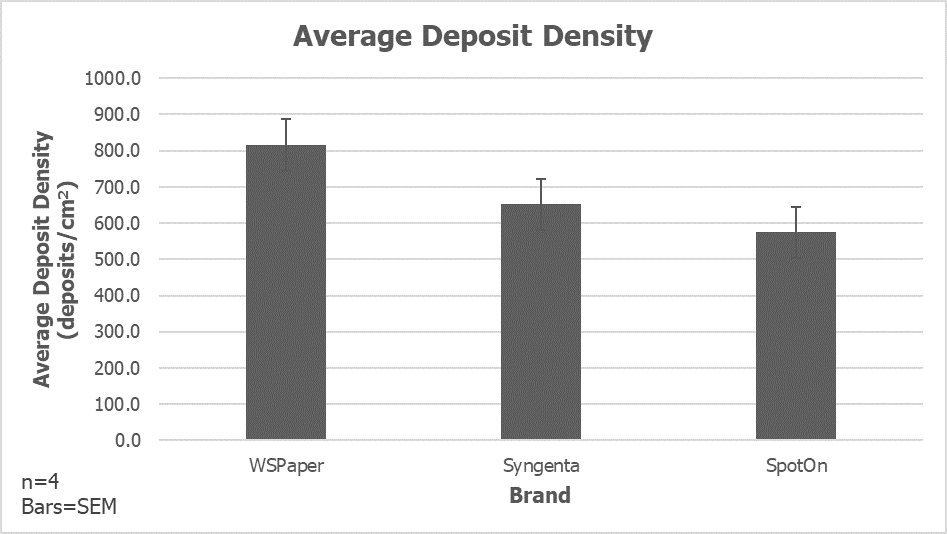
    The average deposit density is a count of discrete objects (i.e. stains) per cm2. WS appeared to resolve the highest count, followed by SY and then SO. The process for determining what is a discrete object, and not the result of anomalies such as overlapping deposits, elliptical deposits or imperfections in the paper itself is complicated and computationally heavy. The algorithms employed by DropScope treated each paper consistently. So, while some differences are attributed to variations in spraying, they also reflect the paper’s innate ability to resolve individual deposits.

    Average deposit density was highest for WSPaper, then Syngenta, then SpotOn. Variability was similar in all cases.

    Droplet diameter

    It is not the intent of this article to determine if WSP should be used to extrapolate the original droplet size. The many assumptions and inconsistencies inherent to this process are well known. Nevertheless, some researchers do use WSP in this manner, so a comparison was warranted.

    DropScope bins deposit diameters by size to produce histograms of deposit size by count. These stain diameters are used to extrapolate DV0.1, DV0.5 (VMD), DV0.9 and NMD, which describe the population of droplets that produced the stains. DV0.5 is the Volume Median Diameter, or the droplet diameter where half the volume is composed of finer droplets and the other half by coarser droplets. Number Median Diameter (NMD) is the droplet diameter where half the total droplets are finer, and half the total droplets are coarser.

    Each brand of WSP will permit a certain degree of spread when a droplet of water contacts the surface. This spread factor is specific to the brand of paper. Further, the spread factor is not constant for all droplet sizes; Finer droplets will spread less than coarser droplets.

    When processing data using DropScope, selecting the appropriate spread factor makes a significant difference to the output. For example, here are the same four SY papers processed using the Syngenta-specific spread factor as well as the spread factors intended for SpotOn and WSPaper.

    The same four Syngenta papers were processed by DropScope using the Syngenta-specific spread factor as well as the SpotOn and WSPaper spread factors. The resulting VMD and NMD were very different.

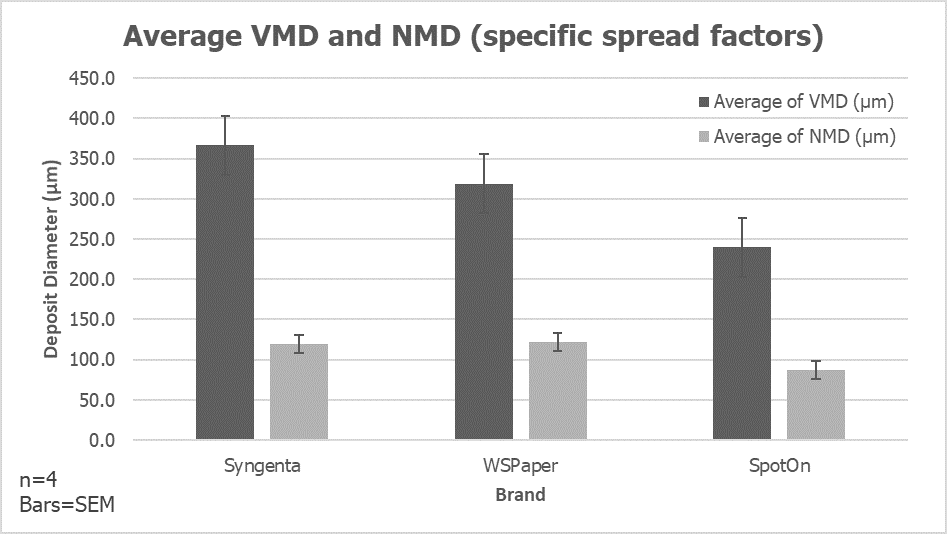
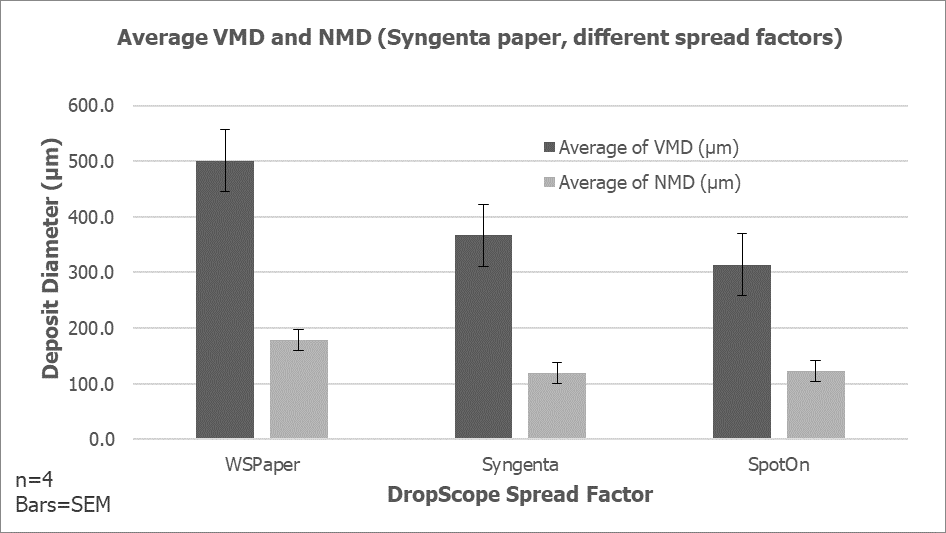
    Therefore, each brand of water sensitive paper was analyzed using its brand-specific spread factor (according to DropScope), to produce the following graph.

    Three brands of WSP processed by DropScope using their specific spread factors. VMD differed by as much as 30%.

    SY produced a VMD higher than that of WS, and both were higher than SO. There was less variability in the NMD, but this was expected given the high droplet count on the finer side of a hydraulic nozzle’s droplet size spectrum.

    Conclusion

    Water sensitive paper has immeasurable value in agricultural spraying. It is far more important to encourage its use than to quibble over brands. However, when these tools are used for more rigorous evaluations of spray coverage, brand-specific variability must be addressed.

    The differences in how each brand responds to moisture (i.e. discolouration and deformation) may factor into which brand is most appropriate for a given situation. Further, there appear to be significant differences in how each brand resolves coverage. Once again, this may be irrelevant for those spray operators who occasionally use WSP to inform their spraying practices, but for consultants and researchers it is suggested that they use a single brand for an experiment, with papers produced in the same batch run.

    Syngenta, Spraying Systems Co., SprayX, WSPaper and Innoquest are gratefully acknowledged for their contribution of materials and time informing this article.

    2026 Update

    If there’s one thing that stays the same, it’s that nothing stays the same. Formulations and manufacturing processes change. According to SprayX, manufacturers of the DropScope, all three of the papers described in this article (written in 2021) have changed in recent years. Some have improved and others can create potential errors in digitizing coverage. The following points may require a deeper understanding of how WSP is digitized and analyzed. Refer to this series of three articles.

    Be aware of the following best practices when using WSP:

    • Be aware of package expiration dates. Expired paper will work differently from new paper, creating an artifact in analysis.
    • Papers with bright, reflective surfaces can cause an underestimation of deposit counts (specifically the smallest deposits).
    • Best results are obtained when using water for testing. Adjuvants and pesticide co-formulants have minor impacts on spread, but can also change the how the paper changes colour, making thresholding difficult.
    • Beware papers that create stains with bright borders and faint (hollow) centres (see image below). This can lead to an underestimation of volume median diameter. If your camera or scanner permits, examine the coverage in binary (e.g. black and white) for more accurate results.
    • Do not sample the edge of the WSP (leave at least a mm) to avoid edge effects such as wicking and partial impacts. Some scanners have a setting, or you can select the area manually.
    • Note the physical shape of the paper itself. Inconsistencies in the length and width (cutting errors) can make papers difficult to use in certain scanners, and curled papers cause changes in perspective and focal distance that can lead to errors.
    • When not using a sealed camera or scanner (e.g. DropScope or flatbed), changes in the camera angle, shadows, lighting conditions, and make/model of cellphone camera will affect the results. Be consistent.
    Stains with faint centers may not register correctly with some software. This could be due to adjuvants in the liquid, or issues with the coating itself. Other issues might include inconsistent coatings that are either too thick or to thin affecting the reaction to water.