Tag: coverage

  • Angled Spray Nozzles in Wheat

    Angled Spray Nozzles in Wheat

    When T3 wheat rears its head, the first rainy day brings questions about spray angles. Let’s begin with a graphic that illustrates how angled sprays cover a vertical target like a wheat head. Assuming moderate wind and sufficiently large droplets, this is a simplified depiction of what we would expect to see.
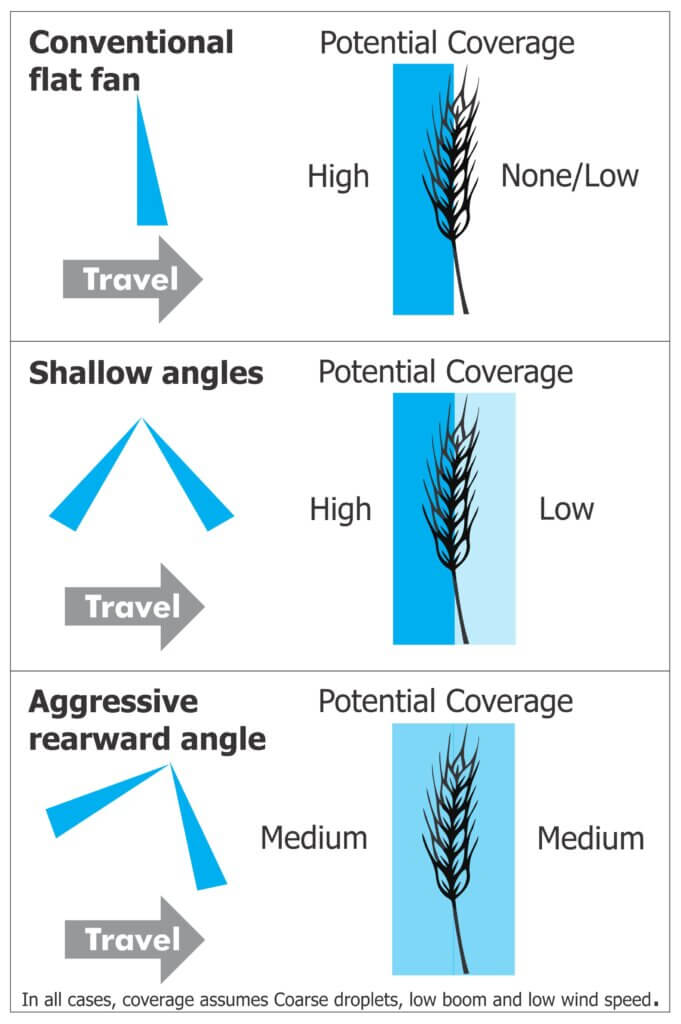
    But is this how the nozzles actually perform? Are dual angles really better than a single fan with an aggressive angle? We hoped to answer these questions when we demonstrated a selection of dual fan nozzles at Canada’s Outdoor Farm Show in 2013. But it was a very windy few days and what we saw was that regardless of the nozzle, most of the spray tended to deposit with the wind.

    A 10 km/h wind will easily deflect Medium-and-smaller droplets and at 20 km/h all but the coarsest spray is deflected. This leads to non-uniform deposits and unacceptable levels of drift (yes, even through it’s a fungicide and you have lots of acreage.) To learn more, we turned to the literature to review studies performed in Ontario and Saskatchewan.

    Wolf and Caldwell

    In 2002, Dr. Tom Wolf and Brian Caldwell experimented with fan angles. They evaluated the impact of nozzle angle, travel speed, and droplet size on the “front” (facing the sprayer’s advance) and “back” (sprayer’s retreat) of vertical targets. They ran three laboratory experiments: spray configuration (single vs. double fan), travel speed (7.6 and 15.2 km/h) and spray quality (conventional versus air-induced droplets) using TeeJet XR’s and Billericay air bubbles at a rate of 175 L/ha. Here’s what they observed:

    • Larger, air-induced droplets produced higher average deposits than smaller, conventional droplets.
    • Twin fans improved overall average deposit compared to single fans.
    • Building on the first two points, twin air-induction fans improved overall average deposit versus conventional twin fans, and also improved deposit uniformity (i.e. coverage on the front versus the back of the vertical targets).
    • Higher travel speeds improved overall average deposit, but at the cost of reduced uniformity as the rear-facing target received reduced coverage (particularly in the case of conventional droplets).
    • Spray angle did not impact coverage from conventional tips, but increasing from 30 to 60 degrees improved coverage for AI tips.

    While the coverage data was compelling, growers were not reporting improved efficacy with the improved coverage. The authors felt there were confounding variables like crop susceptibility, disease pressure and product effectiveness. Their conclusion was that applicators should strive for improved coverage, but only after integrated pest management (IPM) criteria such as product choice, crop staging and application timing are satisfied.

    Hooker and Spieser

    In 2004, Dr. David Hooker (University of Guelph) and Helmut Spieser (OMAFRA) started exploring nozzle configuration and sprayer set-ups to optimize Folicur applications in wheat. For several years they ran field trials exploring panoramic wheat head coverage. That is, not only the front and back of the wheat head, but the sides as well. Ten different nozzle configurations were used:

    • TurboTeeJets mounted in dual swivel bodies (backwards and forwards)
    • AirMix air induction nozzles mounted in dual swivel bodies
    • Air induced Turbo TeeJets mounted in dual swivel bodies
    • Single Turbo TeeJets angled forward or angled backwards
    • Single Turbo FloodJets angled forward or angled backwards
    • TwinJets
    • Single Hollow cones
    • Turbo TeeJet’s mounted in Twincaps
    • Turbo TeeJet Duos
    • Single Turbo FloodJets alternating forward and backwards

    They explored boom height (0.5 m and 0.8 m above the crop), travel speed (10 km/h and 20 km/h) and application volume (93.5 L/ha and 187 L/ha). Here is a summary of their findings:

    • Travel speed did not appear to impact overall coverage.
    • Spraying higher volumes improved coverage.
    • Lowering the boom improved coverage.
    • Coverage from conventional flat fans and TwinJets gave ~15-18% coverage and 22-26 mg of copper was deposited per m2, but alternating Turbo FloodJets gave ~29% coverage and deposited ~37 mg copper per m2.
    • The highest percent coverage was obtained using Turbo TeeJets or the AirMix tips mounted in dual swivels (~26% coverage), or single Turbo Floodjets alternating forward and backwards (34% coverage) as long as the spray was not obstructed by the boom structure itself.

    Hooker and Schaafsma

    A few years later, Dr. Hooker and Dr. Art Schaafsma worked with OMAFRA to explore efficacy. DON is a mycotoxin that may be produced in wheat infected by Fusarium Head Blight (FHB) or scab. There is an indirect relationship between wheat head coverage of fungicide and the reduction of FHB and DON: The higher and more uniform the coverage (with the right timing) the lower FHB and DON.

    In two field experiments they performed in 2008, DON values in the untreated checks were around four parts per million. DON was reduced by an average of 22.5% using a single flat fan, 23.0% using a TwinJet and 41.5% using alternating Turbo FloodJets when averaged across two fields, two fungicides and four reps (n=16). They all reduced DON significantly. There was no statistical difference between singles and twins, but control from the alternating Turbo FloodJets was significantly better.

    The Return of Wolf and Caldwell

    Then, in 2012, Tom and Brian evaluated the new asymmetrical twin fan nozzles from TeeJet. The marketing claimed they could improve overall coverage at higher travel speeds because they decrease the contribution of the front-facing fan and increased the angle of the back. Tom and Brian’s lab-based experiments determined that:

    • Asymmetricals increased overall deposit amounts and uniformity versus single fan and symmetrical twin fans.
    • Nozzle orientation (alternating or not) seemed unimportant.
    • As suggested earlier, boom height was a big factor in coverage. Nozzle angle didn’t improve coverage when the boom was too high, but spray deposit increased significantly when the boom was lowered.
    • Coarser spray droplets have more momentum, so they can travel greater distances on their original vector. A coarser spray quality is the best choice for any angled fan.

    Water volumes and FHB

    Let’s address the notion that high water volumes might increase Fusarium Head Blight (FHB). This is a hypothesis that seems to have resonated with growers. Dr. David Hooker ran trials where he tried to favour FHB by spraying 40-50 gpa of water multiple times per day (even up to 100 gpa). There was no pathological impact (personal communication).

    Consider that 1″ of rain is the equivalent of 2,715 gpa of water. Raising your carrier volume from 15 gpa to 20 gpa is the equivalent of 0.000184″ of rain. Admittedly, it’s all aimed at the wheat head, but it’s still a tremendously small volume. While studies have shown a diminishing return in coverage at 30 or 40 gpa, spraying with 20 gpa appears to be a safe way to improve coverage significantly.

    Learn more about early morning spraying here, and a more in depth discussion of spraying when there is dew here.

    PWM

    What if you’re running a PWM system? Sizing for PWM requires the tip be sized about 20-40% more than if you were running a conventional sprayer. In other words, at expected travel speeds, the pulsing duty cycle should be approximately 60-80%. Nozzles that are permitted on PWM sprayers are limited and the angled fan selection for PWM is, at the time of writing, more so. It requires some experimenting. The following list uses the JD Exact Apply as an example system, and it is not exhaustive. We’re always looking for new ideas.

    1. 3D90 (the original 3D is arguably too misty) in the A or B positions, alternating front and back <or> in both A and B positions. This tip may not be readily available in North America.
    2. LDT (Low Drift Twin) which is two LD tips installed in a Twincap (twin 30° angles) in position A or B.
    3. LDM (Low Drift Max) which is two LDM installed in a Twincap in position A or B. This tip only goes down to an 03.
    4. The Deere 40 degree angled adaptor (developed for See and Spray) can be used to convert any PWM-compatible nozzle into an angled spray.
    5. GAT (GuardianAir Twin) is an air-induced tip, running in conventional “A” mode or in Auto Mode but sized for “B”. Avoid operating in A and B to prevent pattern interference.
    6. Wilger Wye Adaptor with SR nozzles. This does cause tips to drop below the boom frame but is a versatile option.
    7. Wilger Dual Angle Max. More compact than the wye adaptor, this asymmetrical assembly (30° fore and 50° aft) prioritizes Coarse spray.
    8. TeeJet Accupulse TwinJet.
    9. Greenleaf Blended Pulse Dual Fan Assembly.

    Summary

    So here’s what we can say based on all this research:

    • Higher volumes improve coverage (significantly up to ~200 L/ha or 20 gpa). Can you go to 30 gpa? Yes, and it will likely improve coverage, but it’s a diminishing return and at some point you will incur run-off.
    • When using angled sprays, coarser droplets improve vertical coverage. Compared to finer droplets, they move faster, survive longer (i.e. resist evaporation) and are less likely to be deflected by wind.
    • Maintaining the lowest operable boom height improves coverage from angled sprays. We want 100% overlap at target height, and with angled sprays that means getting pretty close. Aim for the highest wheat heads and not the tillers. If you’re 2′ away, you’re likely too high.
    • Symmetrical fans with shallow angles (e.g. 30°) improve coverage uniformity on vertical targets versus single fans, and a steeper backward-facing angle (e.g. 70°) improves coverage even more on the sprayer-retreat side.
    • Travel speed may or may not affect coverage, but slower speeds do facilitate lower booms, which do improve coverage.
    • Timing, weather and product choice are likely the most critical factors.

    Angled sprays may offer some advantage in other situations, but they are primarily intended for panoramic coverage of vertical targets.
    Short videos about dual fans

  • Wanted: A New Technology for Assessing Spray Coverage – The Spray Doctor

    Wanted: A New Technology for Assessing Spray Coverage – The Spray Doctor

    “If you can’t measure it, you can’t improve it”. While the source is nebulous (Peter Drucker, Lord Kelvin, or Antoine-Augustin Cournot), the sentiment is clear.

    The status quo

    In the world of crop protection, considerable resources are expended to distribute a pesticide over a target. And yet, sprayer operational settings and spray coverage are rarely assessed. As a result, too much time elapses between the application and observing the biological results to evaluate and correct equipment performance. The damage (be it waste or an inconsistent and sub-lethal dose) is done. All sprayer operators know this to be true, so why do precious few perform these assessments?

    Perhaps, dear reader, you have personal experience assessing coverage and already know the answer. Perhaps you’ve performed the iterative dance that is placing, spraying, retrieving, assessing and re-placing water sensitive paper (WSP). Perhaps you’ve sprayed fluorescent tracers and hunted for faint glows at twilight using UV lights. Perhaps you’ve looked for residue from diatomaceous earth or fungicides. Or, perhaps, you’ve trusted in the falsely-comforting “shoulder check” and assumed dripping must mean you’ve hit the target.

    Existing methods are complicated, subjective, messy and time-consuming. We need an alternative.

    The alternative

    Consider a permanent, solar-powered sensor that supplies real-time spray coverage data to your smartphone via a cellular connection. The output could be visualised in a simple and intuitive way, and immediately available to both sprayer operators and farm managers. If the sensor was relatively inexpensive, sufficiently hardy, and easy to deploy, its utility would only be limited by your imagination:

    • Stakeholders could confirm the correct functioning of their equipment before committing to the application. Decisions could be made to change operational settings, repair equipment, or delay until conditions improved.
    • The sensors would provide coverage data specific to their location and orientation. Units could be installed in difficult-to-spray regions such as treetops, or canopy-centres, or fruiting zones. Sensors could be placed where pest/disease pressure has been historically high, or where wind is a known issue.
    • Large operations could install them in a test-row, where sprayer operators would perform a gauntlet-style calibration run prior to a day of spraying.
    • Spray records could inform compliance audits, supplement insurance or CanadaGAP traceability requirements, or be used in agronomic assessments.

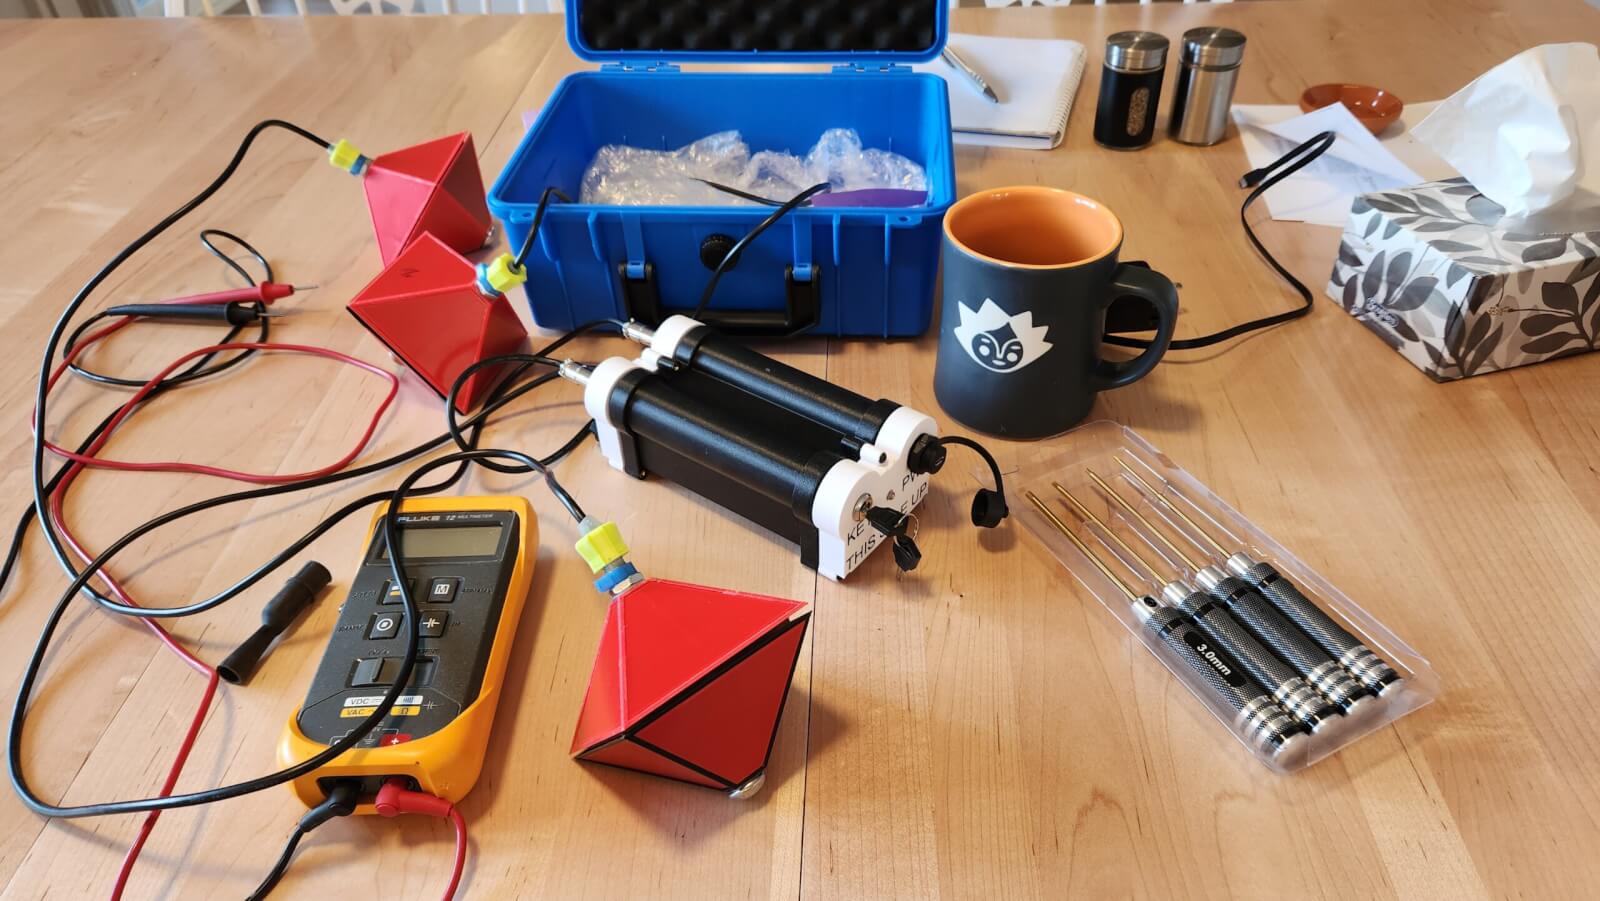
    In 2025 I was approached by an Australian developer who claimed he had a device that did all of this. And, if that weren’t enough, it could also monitor certain meteorological factors such as pre-spray moisture levels and temperature and report post-spray evaporation rates. I could barely contain my excitement. A prototype was in my hands a few weeks later.

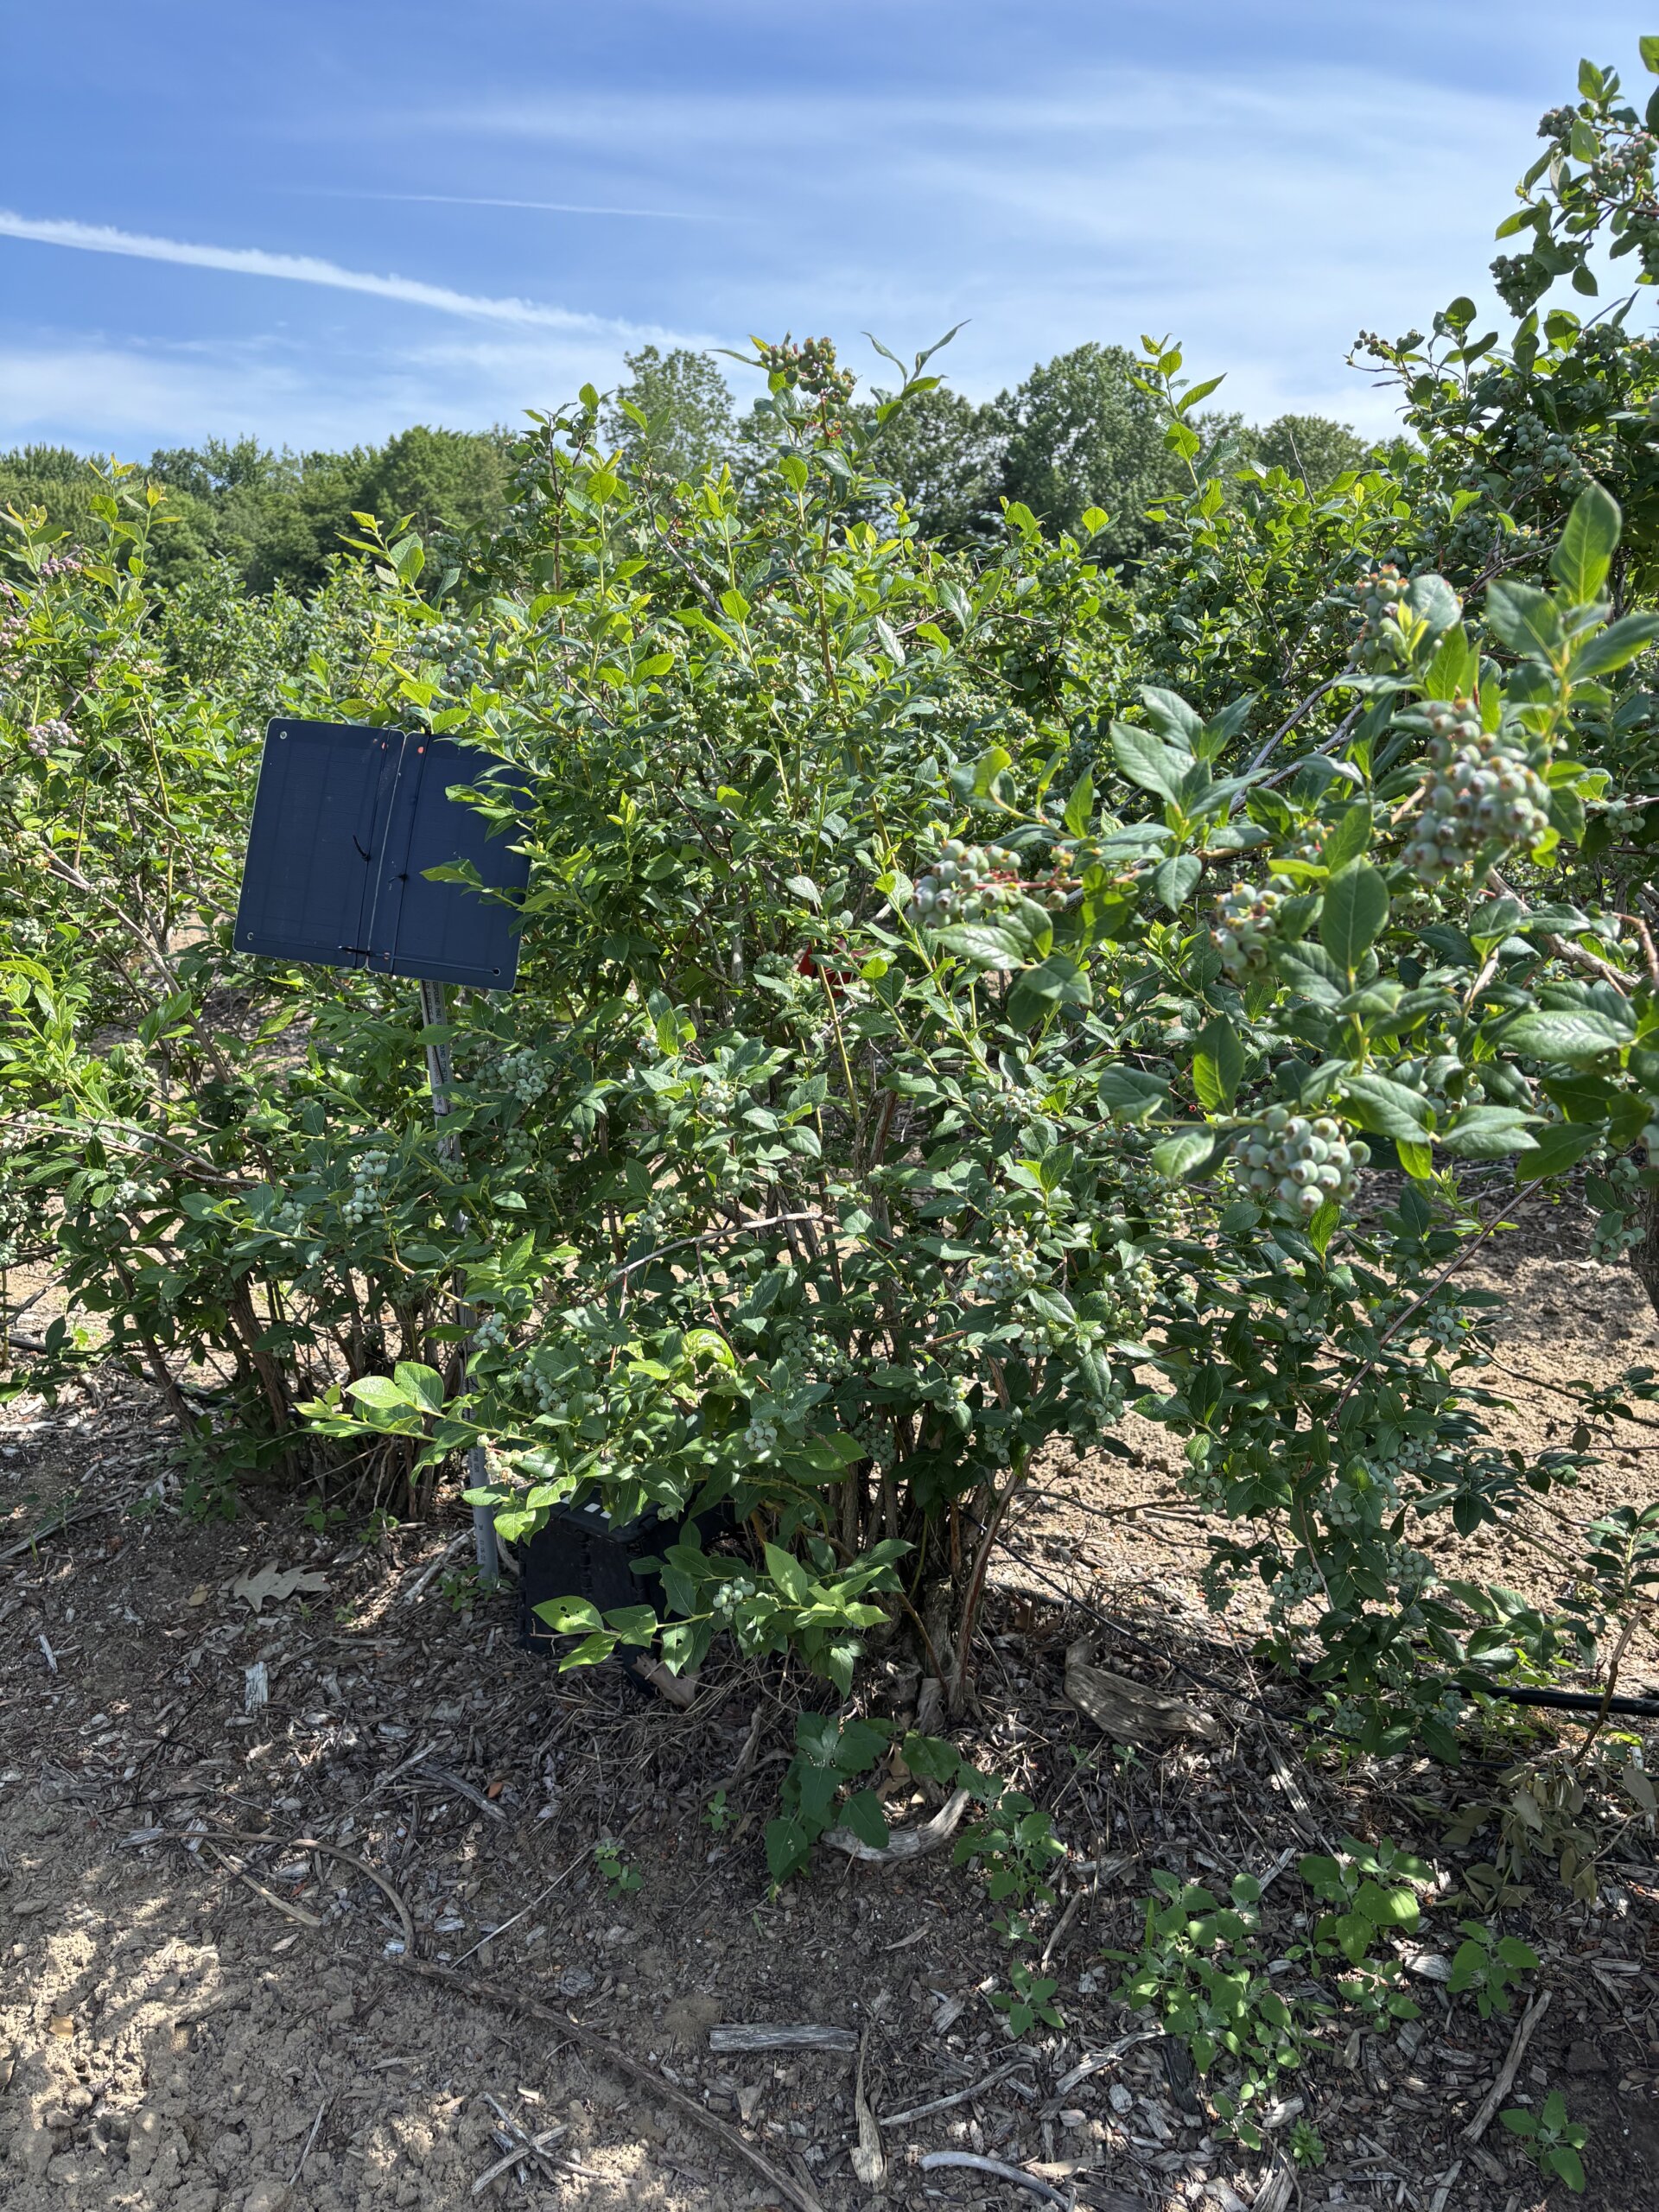
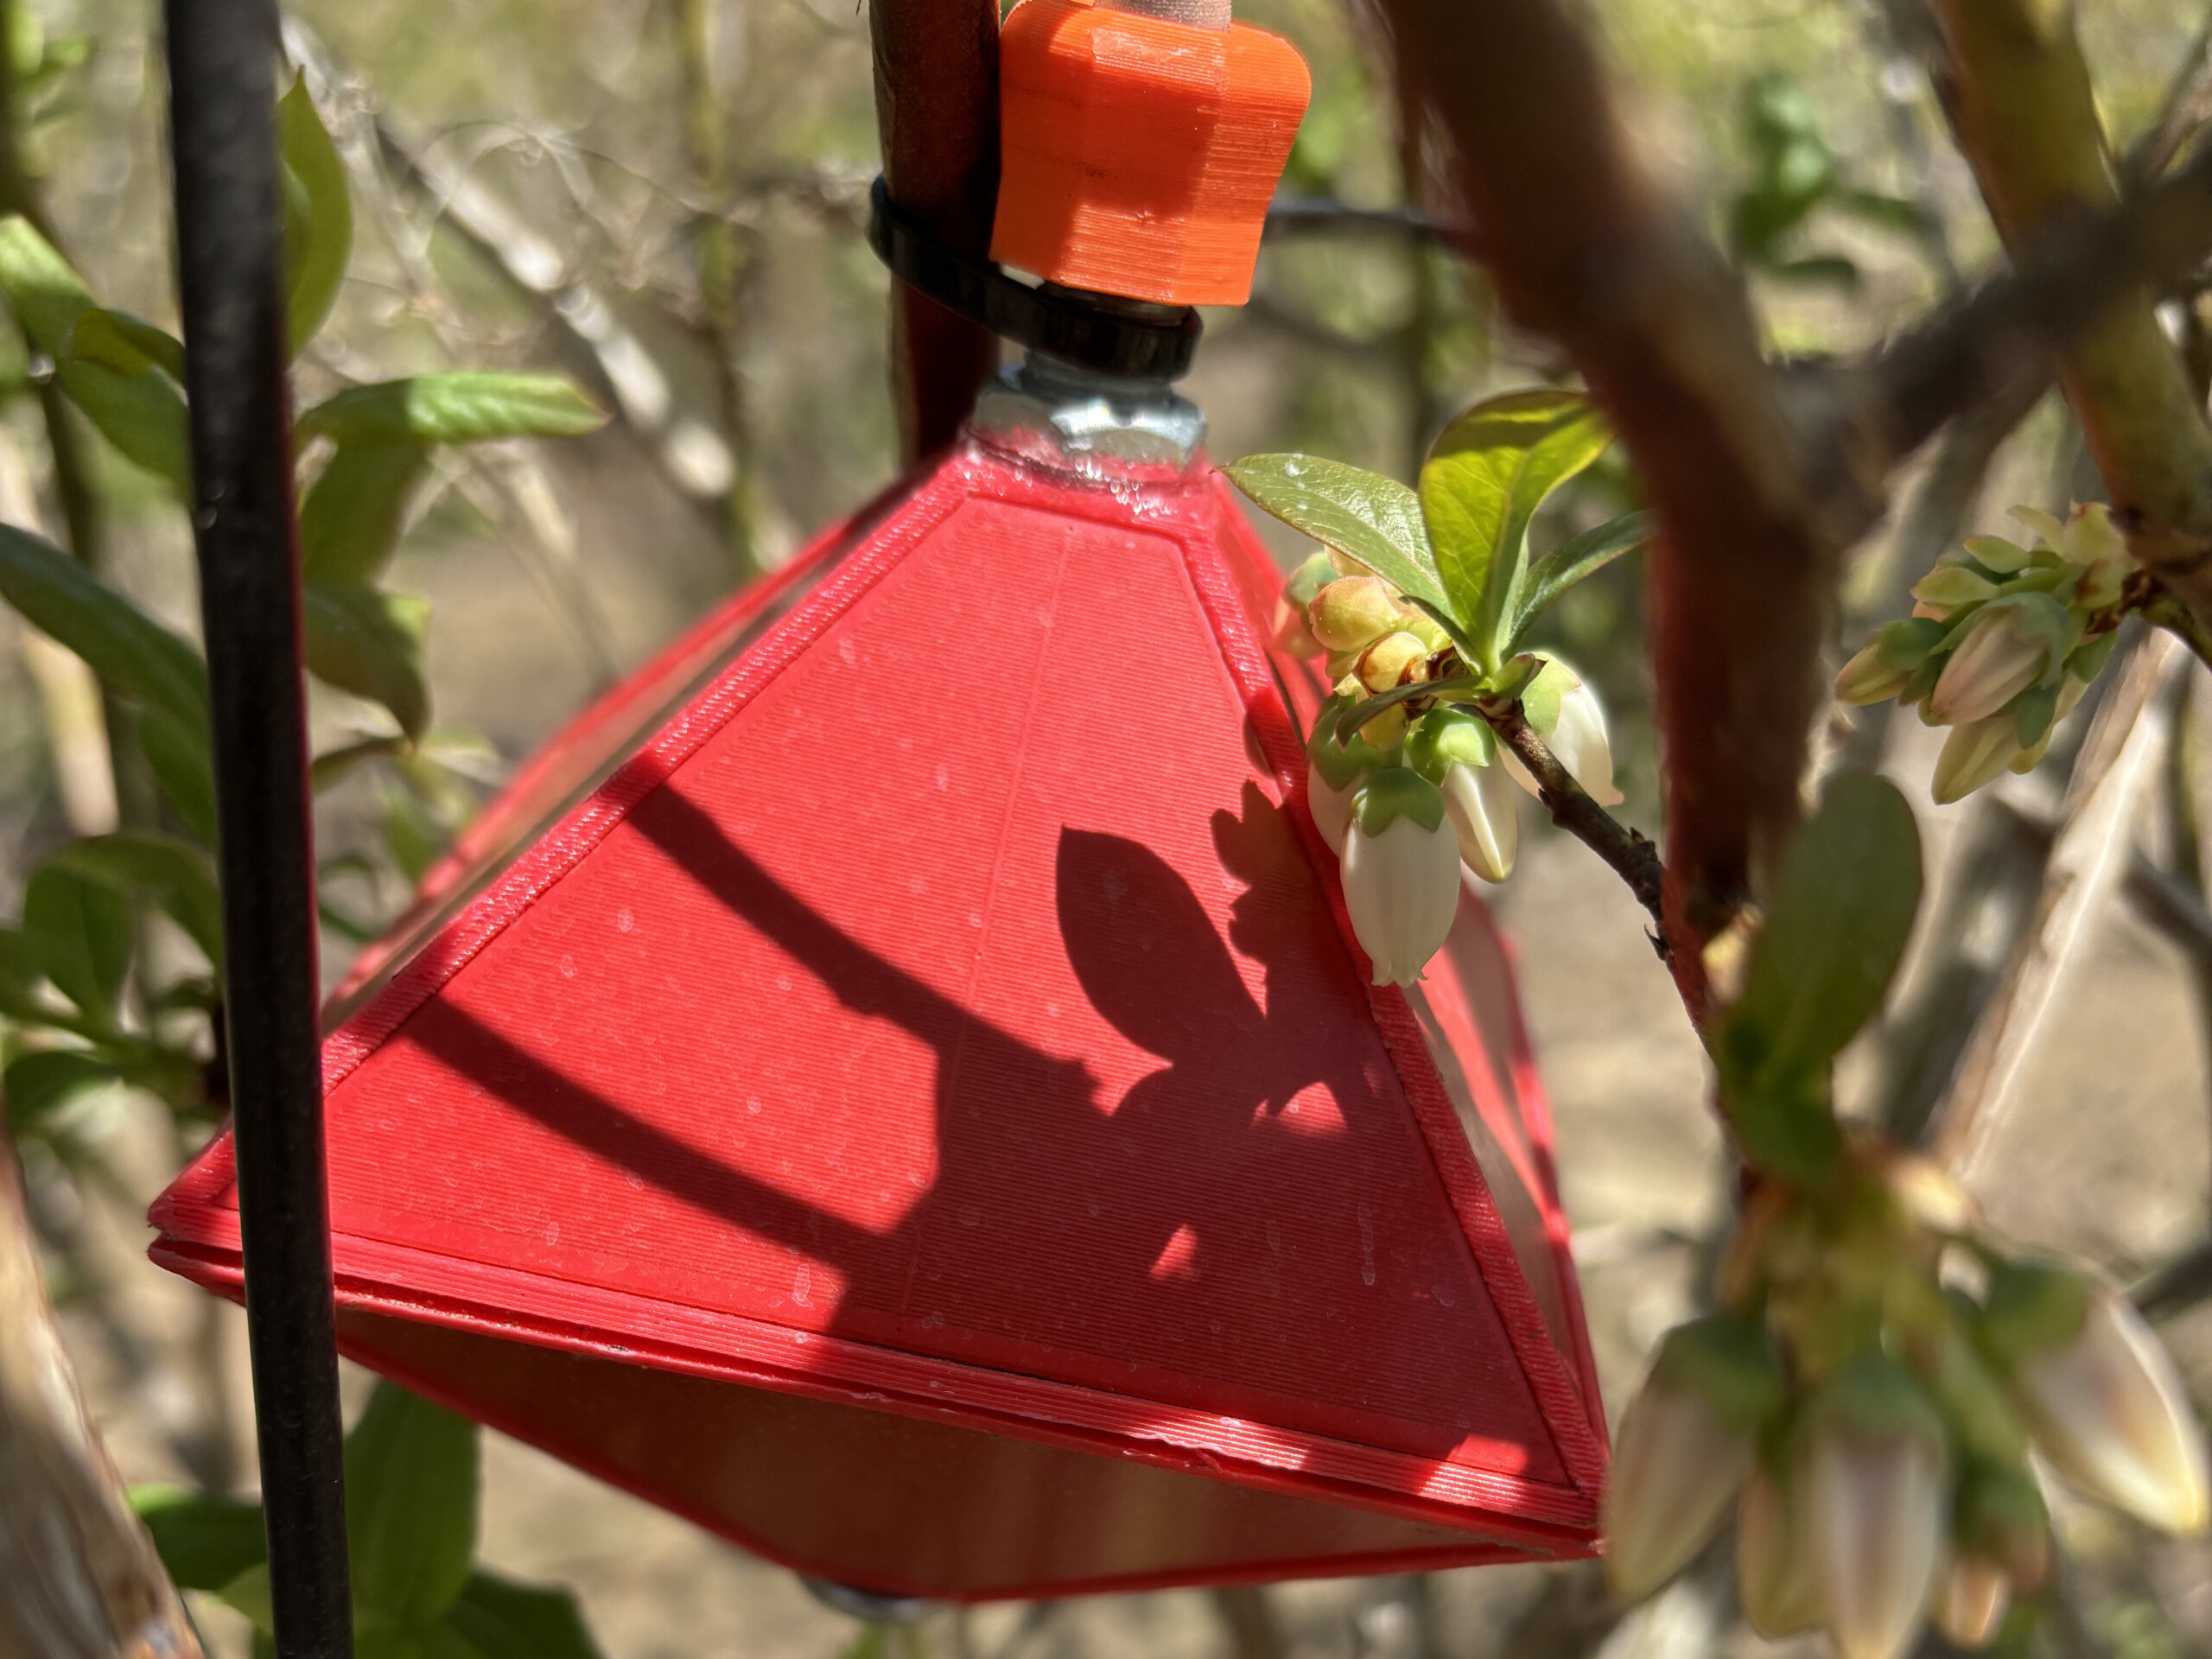
    Prototype, 8-sided sensor located in a blueberry bush.
    Solar panel powering three, 8-sided prototype sensors spanning 10 meters of highbush blueberry.

    Benchmarking the sensor

    The Spray Doctor (working name for the prototype) started its life as a leaf wetness sensor, evolving into a spray coverage sensor piloted in 2023/24 in Australian and New Zealand grape production. The history of earlier iterations and company schisms is convoluted, and fortunately immaterial to our purposes. All I needed to know was that we weren’t starting from scratch. Several of the questions regarding how accurately the surface could detect spray deposition were already addressed by independent research.

    The sensing surface is impregnated with an array of capacitive wetness sensors. The sensor responds to the surface area covered and not deposit density. Researchers reported a reliable response range between ~10% and 50% surface coverage. Given the arguable “ideal” coverage standard of 10-15% surface area, this includes the range of interest for most sprays.

    Benchmarking against WSP was part of the foundational assessment. A droplet of water deposited on WSP produces a high angle of contact and very little spread, while the same droplet deposited on plant tissue tends to produce a lower angle of contact and more spread. This means the stain produced on WSP is smaller than would be produced on plant tissue, depending on how smooth, vertical or waxy the tissue surface was.

    It was therefore surprising that WSP were found to report a higher degree of spray coverage during water-only sprays than the sensor. It seemed droplets more easily coalesced and ran off the sensor surface. This was ultimately interpreted as an advantage, because the sensor would better emulate how a leaf surface would respond to the influence of surfactants and spray quality.

    Adding a surfactant to a spray solution improves droplet adherence, and/or reduces surface tension, improving the degree of contact on plant surfaces. Likewise, it was found that surfactants increased the degree of coverage reported by the sensor, and when actual chemistry was sprayed (e.g. sulphur powder or copper sulfate) there was an effect on the degree of coverage reported. This is unlike WSP, where adjuvants and chemistry do little to increase the spread.

    And so, like every method for assessing spray coverage, the sensor has limitations and caveats. If you have some doubt as to the sensor’s accuracy, do not get distracted by the fine detail. Remember, most operators currently have no feedback whatsoever; even a binary response (e.g. hit or miss) would be welcome. The sensor is sufficiently sensitive and consistent to resolve coverage in a range relevant to most sprays, and therefore worth field testing.

    The experiment

    My role in this story was to work with a grower to evaluate the sensor’s ability to report coverage information in a clear and actionable way. There were three questions:

    • Does data from the sensor influence a sprayer operator’s behaviour?
    • Does that change in behaviour lead to improved spray coverage (implying more efficient and effective crop protection).
    • Could we “dial in” the hardware and the interface based on the grower’s feedback?

    In part two, we share our experience installing and using the Spray Doctor, as well as supply answers to these questions. Stay tuned.

    Thanks to Brandon Falcon (Falcon Blueberries) for volunteering his time and farm for this evaluation, and the developer for the in kind donation of the prototype Spray Doctor.

  • Fluorescent Dyes for Spray Coverage Evaluation Part 1

    Fluorescent Dyes for Spray Coverage Evaluation Part 1

    Note: Be sure to read Part 2, which changes the interpretation.

    I work in agricultural extension and I’m always on the lookout for new methods to help me achieve my goals. A big part of my job is to research and teach efficient, effective and safe crop protection practices, so it follows that I have to be able to evaluate the quality of a spray application. Fundamentally, there are two ways to do it:

    1. Wait to see if the pesticide did its job and protected the crop from weeds / bugs / disease.
    2. Don’t wait. Confirm your spray is depositing where you want it before committing to the application.

    Three guesses which approach I advocate. So, how do you check spray coverage in a way that’s quick, cheap, easy and informative? Again, there are choices, but rather than simply list them I’ll add a little insight in the form of pros and cons.

    MethodProsCons
    Water sensitive paperRelatively cheap, available, clean, easy, repeatable, supports a photographic record, simple to analyze.Does not accurately reflect coverage on plant surface, slow to place and retrieve, can be spoiled by dew, humidity and physical contact.
    Inspecting for residue / wetnessCheap and fast.Not proactive, too subjective, not repeatable, pesticide many not leave visible residue, requires re-entry soon after spraying.
    Inspecting spray pattern (e.g. shoulder check)Cheap and fast.Not proactive, not indicative of coverage, not repeatable.
    Watching for run-offJust don’t.Just don’t.
    Fluorescent dyesReflects actual, whole-canopy coverage and off-target coverage at same time.Expensive, hard to find, messy, time-consuming, hard to photograph, not repeatable, leaves unwanted residues (or can’t be used on edibles), may have to take place at night, may fade quickly… or is any of this actually true?

    I’ve never been a proponent of spraying dyes because of the reasons I listed in the table. If I already have difficulty convincing a grower to leave the sprayer or tractor cab to place and retrieve water sensitive papers, what are the odds of them mixing a messy and expensive tank of dye and waiting until twilight to see the results?

    On the other hand, dyes are compelling. Particularly if we change the perspective a little. What if we consider the use of dyes, not as a tool for a grower, but as a tool for agricultural extension or consultation (really, anyone that wants to research or teach the safe and effective use of crop inputs)? Several of the cons are minimized or even eliminated. Additionally, this new lens reveals several uses for dyes beyond spray coverage. This is not an exhaustive list:

    • Off-target (primarily drift) evaluation
    • Dermal exposure / PPE evaluation
    • Rinsate / sprayer cleanout evaluation
    • Sprayer loading / point source contamination evaluation

    I decided to compare a few of these dyes. I enlisted the help of a local blueberry operation. Being October, all the berries have been picked so we could spray the bushes without any risk to the fruit. Plus the sprayer was clean and the growers were curious to evaluate their spray coverage.

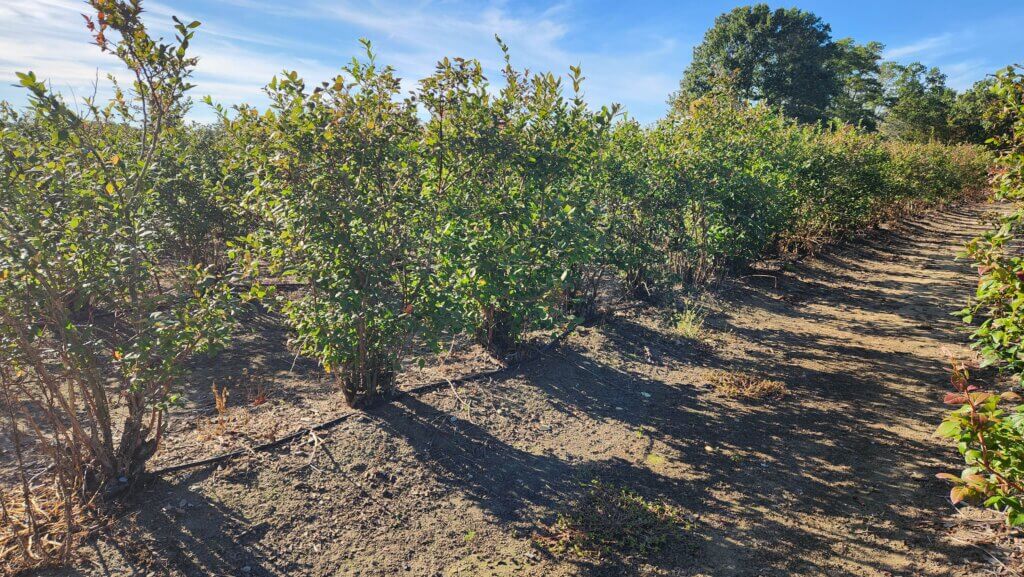
    Blueberry in Ontario in October.

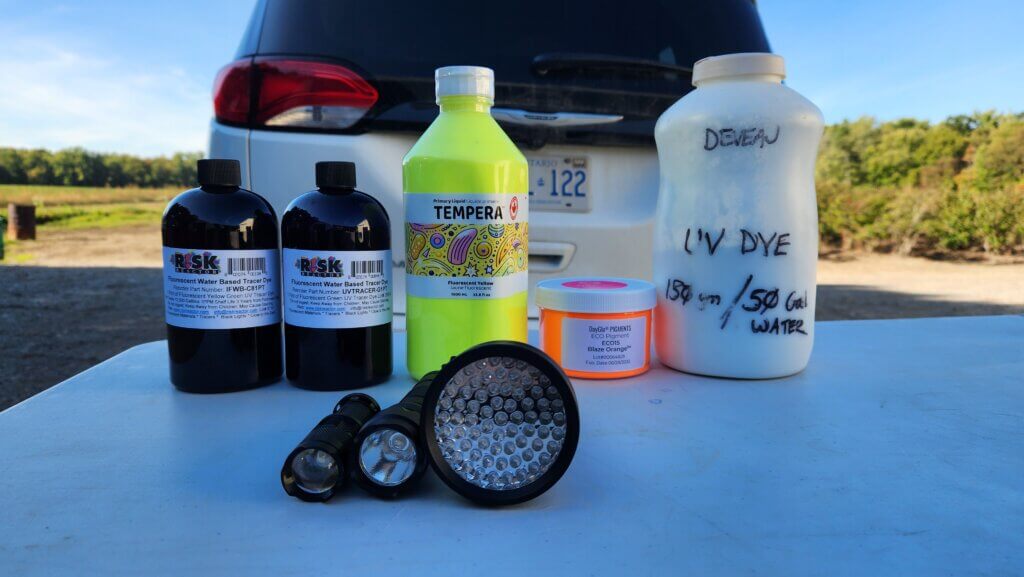
    Having secured a location, spray equipment, and operator, I needed dyes and some criteria for choosing them. First and foremost, I chose fluorescent dyes that glowed under UV (aka black lights). My thinking was that they would be more interesting in demos, and given that we might be spraying horticultural operations, I didn’t want obvious and persistent stains on the produce. At least not something easily seen in daylight before it broke down and/or was washed away.

    My UV dye candidates had to be:

    • Moderately inexpensive.
    • Non-toxic (i.e. had an SDS that clearly permitted human exposure, were environmentally friendly and could be sprayed on edible crops).
    • Readily available in Ontario (e.g. quickly and cheaply shipped from within Canada or perhaps the US).
    • Available in formats that facilitated small volume batches (anywhere from 50 mL squirt bottles for indoor demos, up to 50 L volumes for field demos).
    • Clearly visible on plant tissue.

    I found five likely prospects for the study. I won’t list prices, but none of them were over $100.00 CAD. Number 3 was a free sample and number 5 was gifted to me by a colleague more than 15 years ago. I looked up the SDS for that last one and was surprised that it was relatively inert. So, I used it.

    Dye numberName of dyeCommercial sizeManufacturerLocation
    1IFWB-C81PT1 pintRisk ReactorCalifornia, USA
    2UVTRACER-G1PT1 pintRisk Reactor
    California, USA
    3Eco Pigment Blaze Orange SPL15JXSample size – 100 gramsDayGloCleveland, Ohio, USA
    4Fluorescent Yellow Tempura Paint1 literTri-Art ManufacturingKingston, Ontario, CA
    5Phosphor Powder (Zinc Orthosilicate: Manganese CAS#11-47-2)1 kgGlobal Tungsten and Powders Corp.Pennsylvania, USA

    I also purchased UV lights. When I was bequeathed the phosphor powder it came with heavy, ancient, black lights. They made an unsettling humming noise and required a power source, making them unwieldly for field work. I opted to try three battery powered versions instead. Again, I won’t list prices, but they weren’t unreasonable.

    UV flashlight numberName of lightManufacturerWavelength / wattageBatteries
    1Super TacRisk Reactor395 NM / 850 µW/cm2 at 5 inchesRechargeable battery provided
    2Mini ZoomRisk Reactor395 NM / 1 watt1 AAA
    3V3 UV Flashlight with 68 LEDsAmazon.ca395 NM / 10 watts3 AA

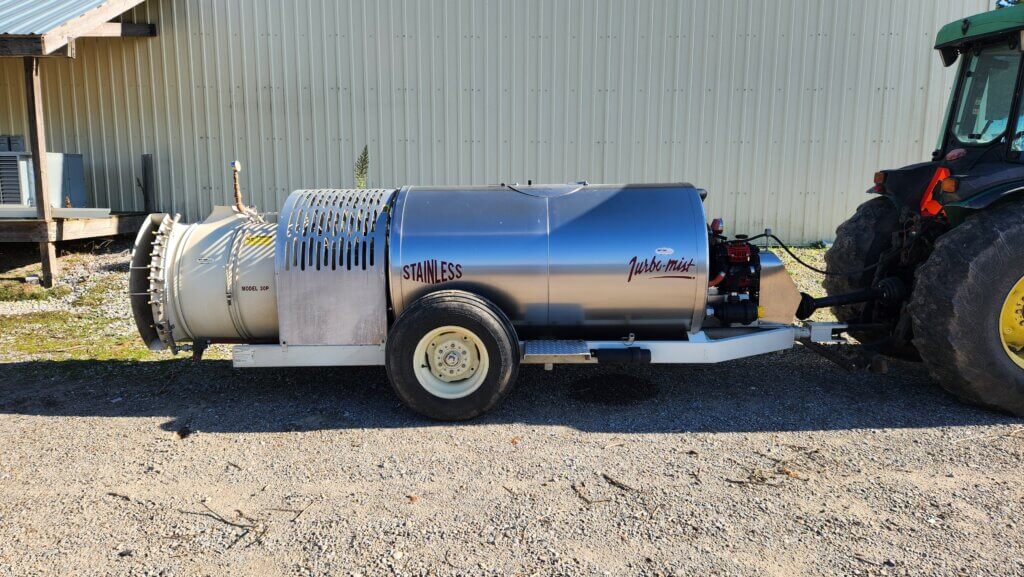
    Regarding the recipes, one of my criteria was that the dyes could be mixed in relatively small batches. I chose 50 L as the high end because the airblast sprayer we were using (Turbo-Mist 30P) could still prime when only 50 L was added to the tank. This allowed us to mix as small a batch as possible, while still having enough to spray a row of berries from both sides. We left three rows between treatments to serve as buffers.

    Turbo-Mist Model 30P before the dye-job.

    I also had to consider the nature of the dyes. The Eco Pigment (Dye 3) is a hydrophobic powder and two colleagues warned me that it was notorious for plugging filters. So, it had to be mixed with a non-ionic surfactant (NIS) to help “wet” the powder prior to adding it to the tank. In fact, NIS seemed like a good idea for all my dye candidates, so I included Activate Plus (Sollio Agriculture, Winfield Solutions) in each recipe.

    The candidates.

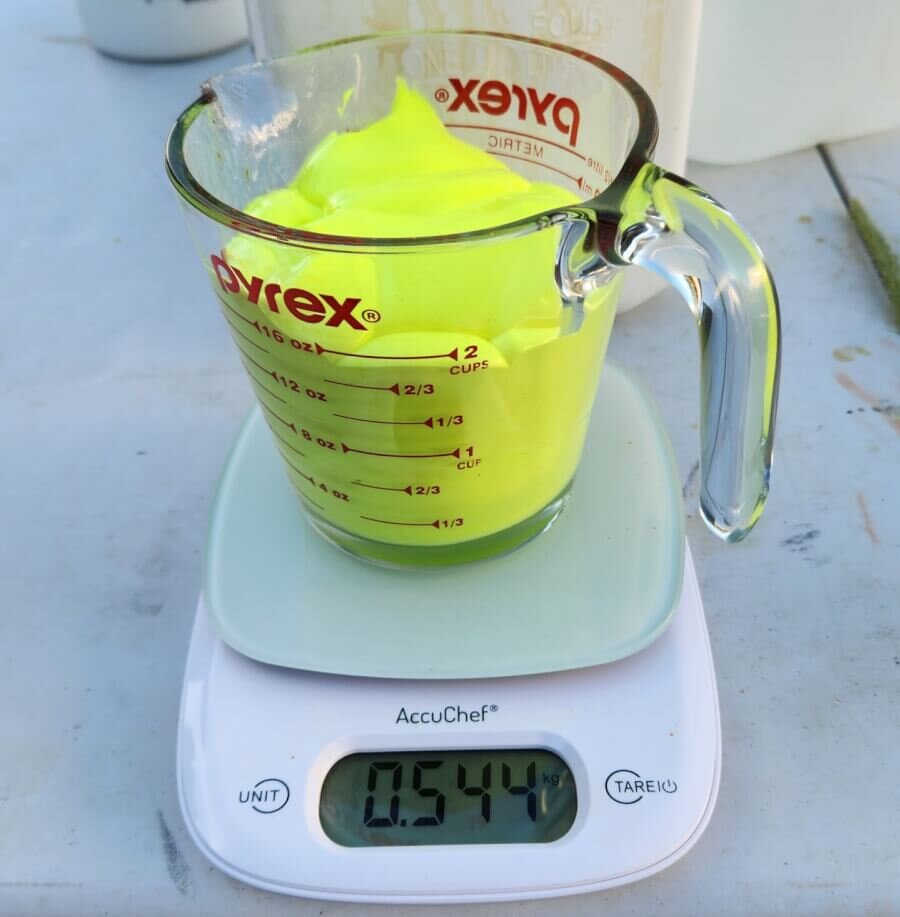
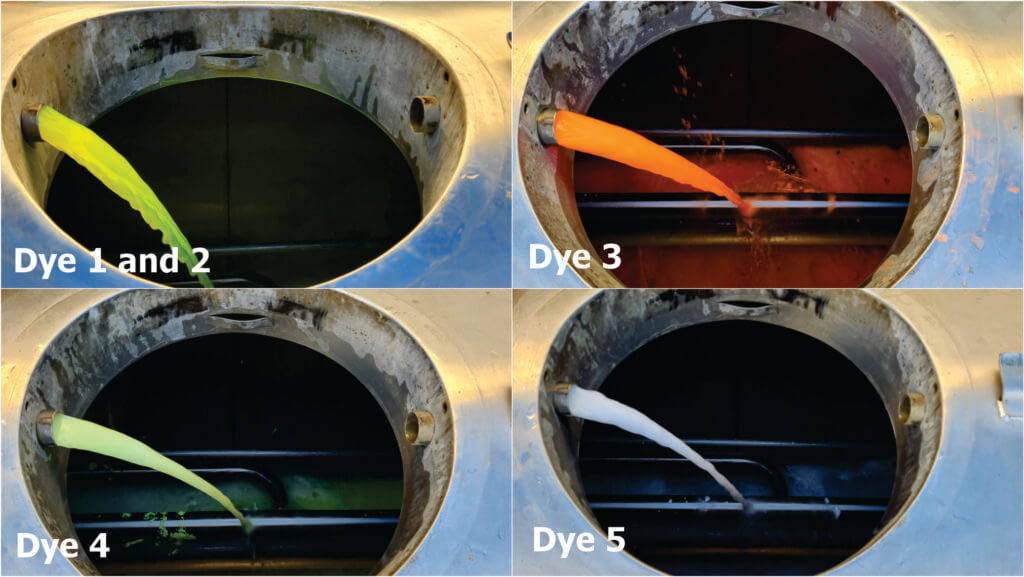
    I added the dye, NIS, and a small amount of water to a Pyrex measuring cup on a digital scale, then rinsed the cup into a final volume of 50 L while filling the tank. I didn’t always follow the advice I received, so I’ll show you the ratios I was told and (right or wrong) what I ultimately did.

    Dye numberManufacturer- or colleague-suggested ratio Amount of dyeAmount of NISAmount of water
    11 part dye : 10,000 parts water125 mL65 mL310 mL
    21 part dye : 10,000 parts water125 mL65 mL310 mL
    31 gram dye : 1 mL NIS : 200 L water65 grams65 mL425 mL
    41 part paint : 100 parts water500 mL65 mL0 mL
    51 gram dye : 1.25 L water65 grams65 mL425 mL

    It took roughly 15 minutes to fill, prime, spray, and rinse out each dye. We started at 5:00 p.m., were done at 6:15, and then waited for sunset at 7:30.

    50 L tank mixes going through circulation and paddle agitation.
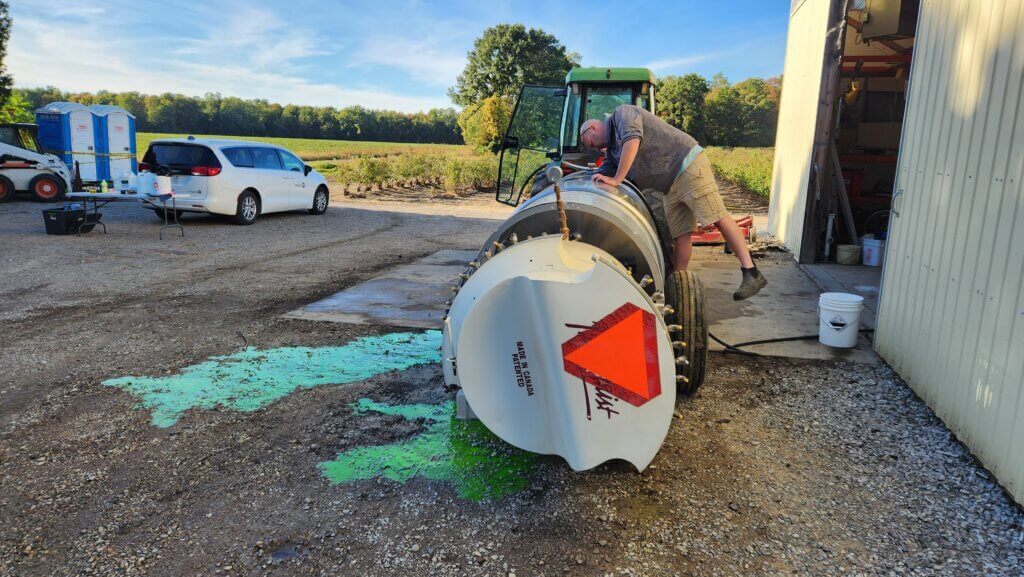
    Draining the remains and rinsing the tank. It looks terrible, but these dyes are intended for environmental projects like tracing water courses.

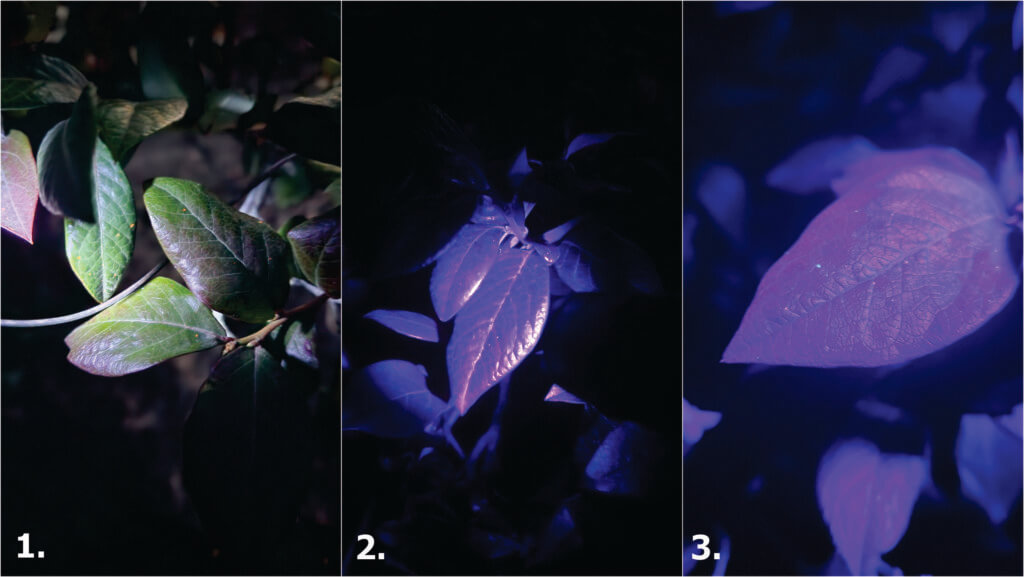
    We used a smartphone (Google Pixel 9a – 48 megapixel camera) to photograph each combination of dye and flashlight. It was tricky to find an angle where the black light illuminated the residue, but didn’t wash out the photo. In those cases where the dye was evident, it was always far more vibrant in person than through the lens of a camera. As for the results?

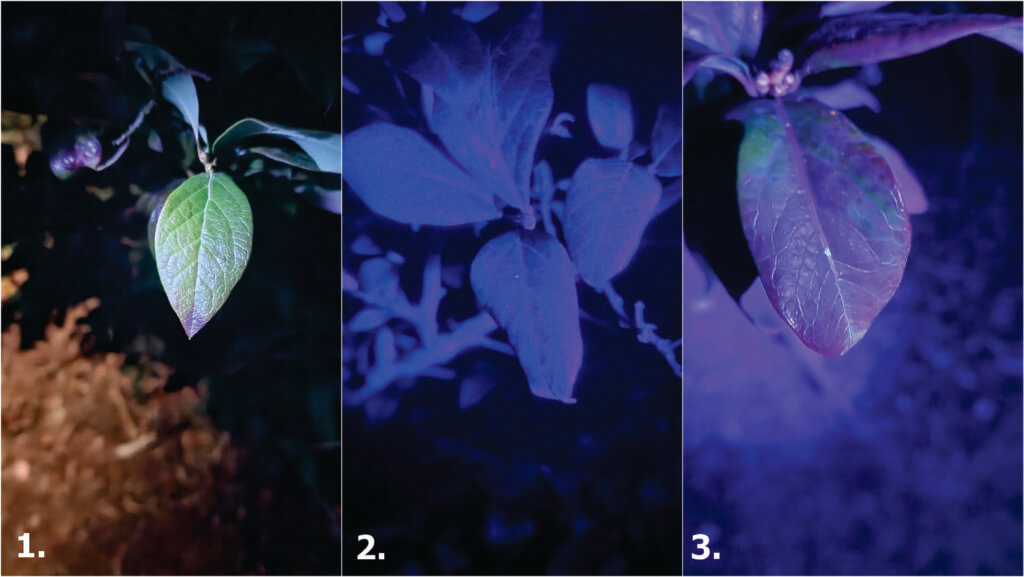
    Lets start with the lights. We found that the high wattage of Light 3 showed dye more easily. This also happened to be the cheapest light, which was a pleasant surprise.

    Dye 1 and 2 were disappointing. We couldn’t see anything on the plants. This dye is intended for monitoring plumbing and water courses, and the manufacturer states that the colour will disappear if the solution is mixed with chlorine. Perhaps mixing it with city water caused it to fade, but that’s likely to happen, so these dyes failed.

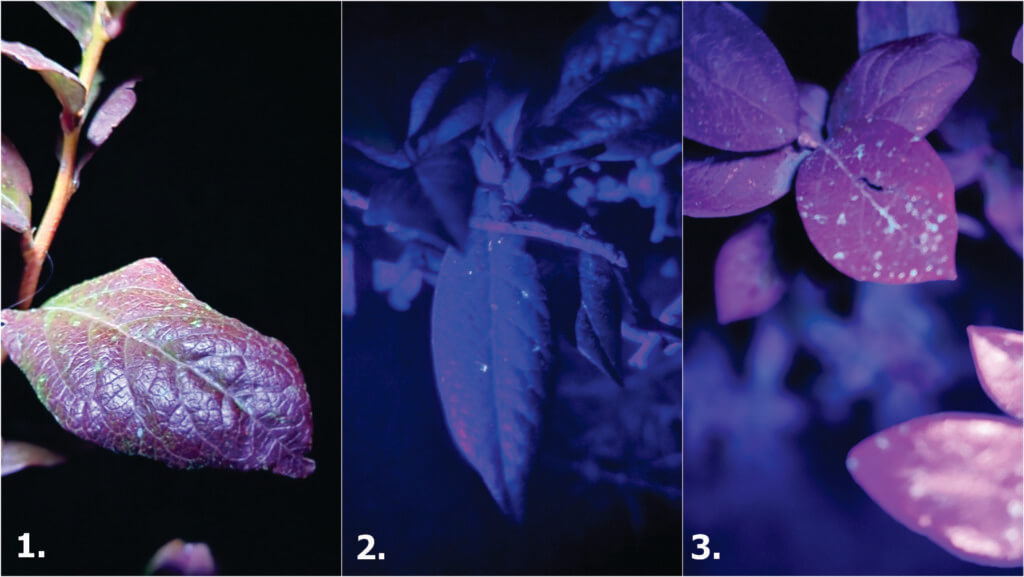
    Dye 1 – Light 1, 2 and 3. A sad, single drop showed up for Light 3.
    Dye 2 – Light 1, 2 and 3. Again, a solitary deposit illuminated under Light 3.

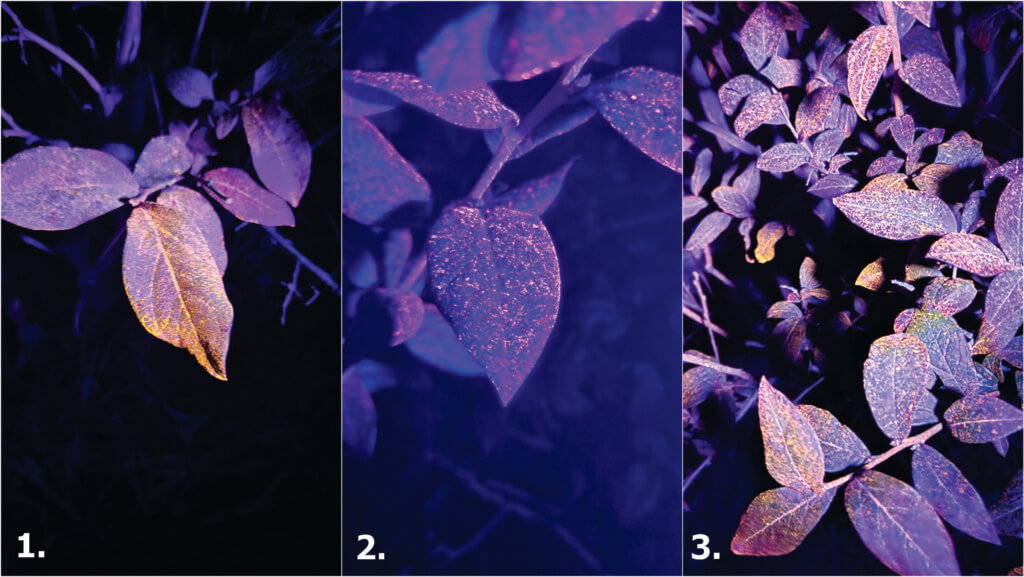
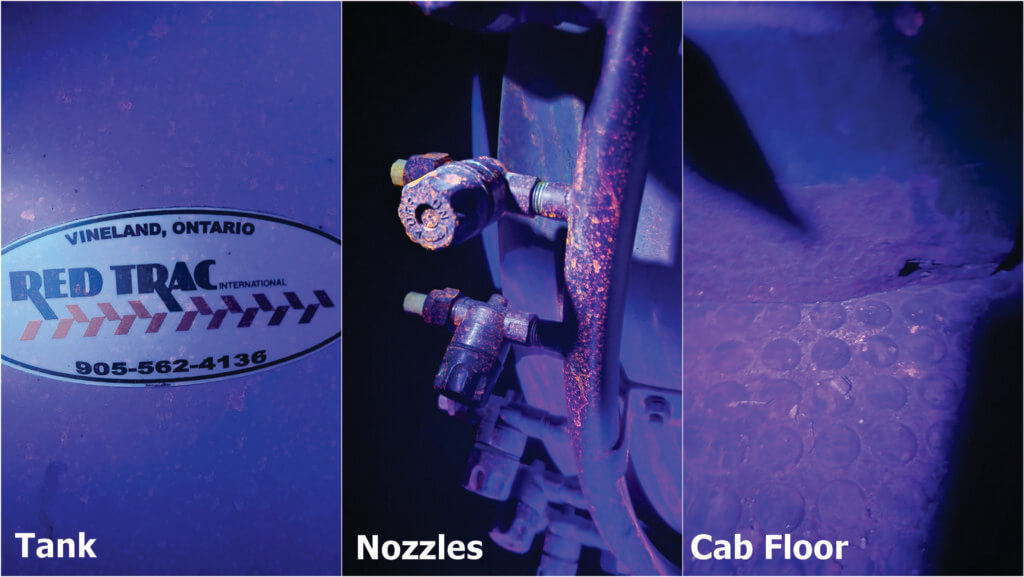
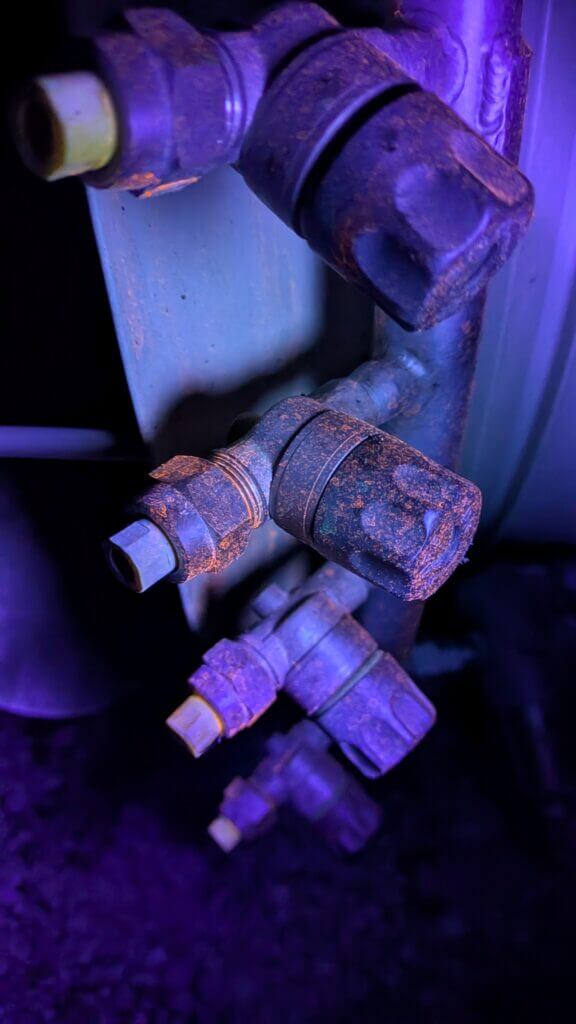
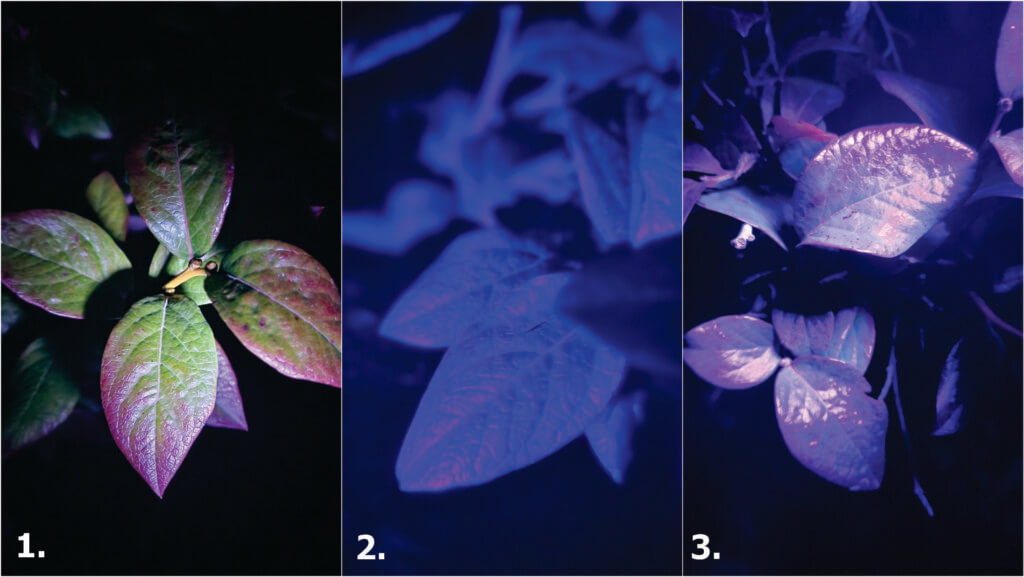
    Dye 3 was spectacular. Not only was it evident with every light source (including day light to some extent), but we were able to find it several rows downwind, on the sprayer nozzles, all over the tires and on the floor of the cab (which surprised the operator). I may have mixed this one too strong; It seemed to clump on the leaves, but perhaps that’s because they were exceptionally waxy.

    Dye 3 – Light 1, 2 and 3.
    Dye 3 showed up everywhere… whether we wanted it there or not.
    A nice close up of Dye 3 on a leaf.
    A close up of Dye 3 on the boom.

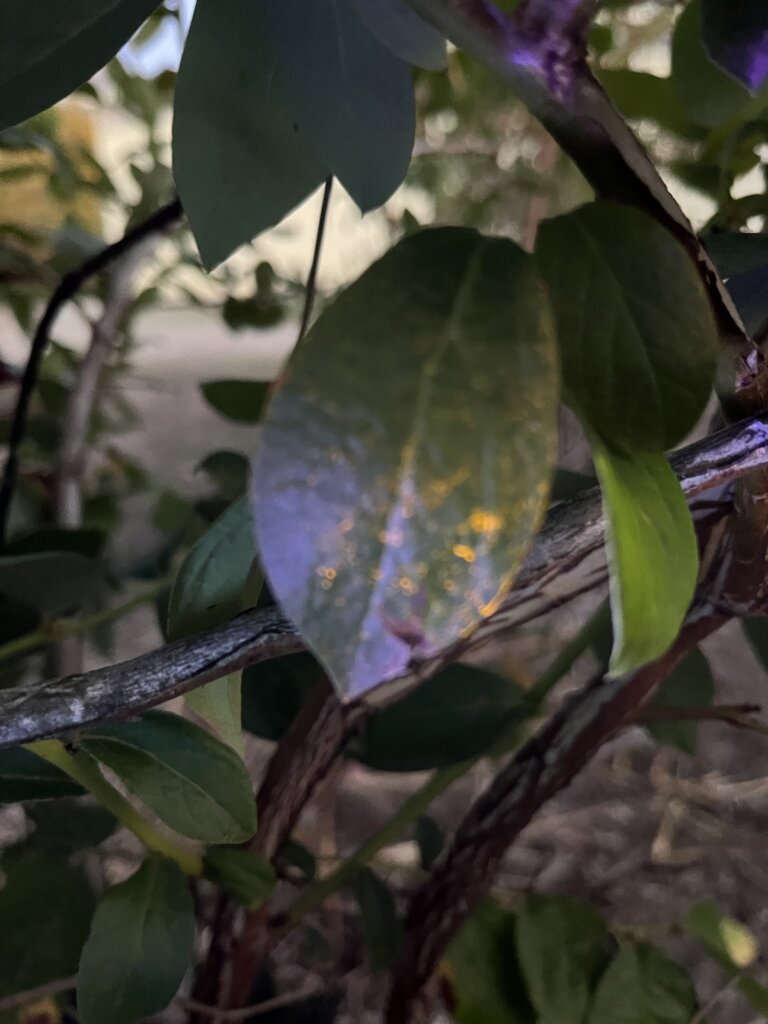
    Dye 4 came in second place. It wasn’t amazing, but it was visible. This is children’s tempera paint, used in daycares for finger painting and at universities for raves. I’ve used it in the past with mixed results, not only to spray canopies, but in classroom demos on cabbage leaves and as a surrogate tracer to hunt down where pesticide hides in sprayer plumbing. It’s OK in a pinch if you mix it at least 2x more concentrated than I did here.

    Dye 4 – Light 1, 2 and 3.
    A nice close up of Dye 4 on a leaf.

    Dye 5, like dyes 1 and 2, was a disappointment. I’ve seen it used in powder-form to demonstrate how dermal exposure can spread as you touch clothing, doorknobs, your face, and places where the occasional adjustment is required. But in a liquid solution, it wasn’t any good at all.

    Dye 5 – Light 1, 2 and 3

    Persistence

    We followed up after the application to see if the dyes would persist. Twenty four hours after application, Dye 4 (our runner-up) was gone. This was no surprise given it was a water soluble paint and wasn’t terribly showy to begin with. However, Dye 3 (our winner) was still clearly in evidence. This is a hydrophobic, micro ground powder (~0.1 micron). That’s one reason it had to be mixed with a non-ionic surfactant. The following photos shows little or no change after 24 hours and a respectable dew:

    Dye 3 after 24 hours.

    Three days after application (DAA), we had a rain event. Four DAA this (blurry, sorry) image was taken:

    Dye 3 after 96 hours and a heavy rain.

    We see that the deposits did redistribute to drip points and the overall coverage was reduced, but it was still holding on. This means it likely shouldn’t be used on any horticultural crop that isn’t going to be washed. Or at least used long before any fruit, leafy green or vegetable contacted by the powder will be harvested. Not because it is unsafe (see safety data sheet) but because of the optics to buyers.

    Conclusion

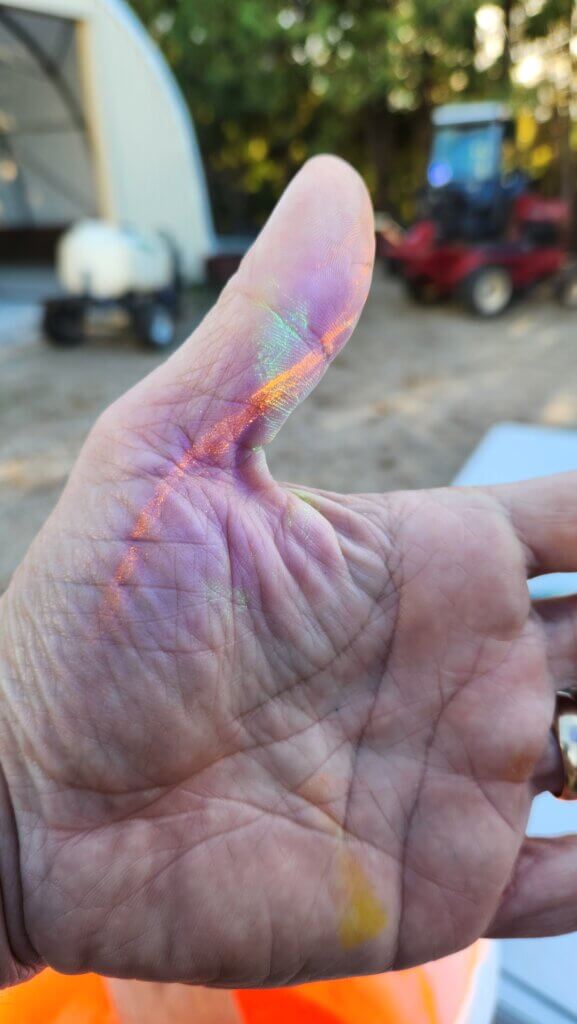
    And so, I hope you have been inspired by this process. I’ve learned that the use of dyes for education and research is potentially powerful, relatively cheap, and more accessible than I originally thought. Certainly the growers were impressed by what they could suddenly see and it’s led them to reassess some of their practices. Just bear in mind the possible persistence, and remember to wear gloves when mixing.

    Wear gloves. Trust me.

    Thanks to Mark Ledebuhr, Helmut Spieser, David Manktelow, and Ben Werling for the helpful advice. Thanks to Brandon and Jordan Falcon for use of their spray equipment and their blueberry operation.

  • Mode of Action and Spray Quality

    Mode of Action and Spray Quality

    The decision on which application method is best for herbicides boils down to two main factors: (a) target type and (b) mode of action. In general, it’s easier for sprays to stick to broadleaf plants on account of their comparatively larger leaf size and better wettability compared to grassy plants. There are exceptions, of course – at the cotyledon stage, broadleaf plants can be very small and a finer spray with tighter droplet spacing may be needed. Water sensitive paper is a very useful tool to make that assessment. Imagine if a tiny cotyledon could fit between deposits – that could be a miss!

    Some weeds are also more difficult to wet, and those may also need a finer spray or a better surfactant for proper leaf contact. An easy test is to apply plain water to the leaf with a spray bottle. If the water beads off or the droplets remain perched on top in discrete spheres, the surface is considered hard to wet. Most grassy weeds are hard to wet, while most broadleaf weeds are easy to wet.

    Grassy weeds are an especially difficult target because they have smaller, more vertically oriented leaves, and almost without exception are more difficult to wet than broadleaf species. All these factors call for finer sprays for effective targeting and spray retention.

    Broadleaf weeds usually have more horizontally oriented leaves which also happen to be larger. As a result, they can intercept larger droplets quite efficiently.

    There are about thirty mode of action (MOA) groups among the herbicides with about ten accounting for the majority in Canadian prairie agriculture. It’s probably an over-simplification to categorize them into just two groups – systemic and contact.  But that grouping goes a long way to making an application decision.

    Contact products (MOA Group 5, 6, 10, 14, 22, 27) must form a deposit that provides good coverage. Good coverage is an ambiguous term that basically means that droplets need to be closely spaced and cover a significant proportion of the surface area because their physiological effects occur under the droplet, and don’t spread far from there. One way to generate more droplets is to reduce droplet diameter, another is to add more water. A reasonable combination of both is ideal because simply making droplets smaller creates issues with evaporation and drift.

    Systemic products (MOA Group 1, 2, 4, 9) will translocate within the plant to their site of action after uptake. As a result, coverage is less important as long as sufficient dose is presented to the plant. In practice, this means coarser sprays and/or less water may be acceptable.

    When two factors are combined, either in a tank mix or a weed spectrum, the more limiting factor rules. Application of a tank mix or product that is active on both broadleaf and grass plants will be governed by the limitation placed on grass targets. A tank mix comprised of both systemic and contact products is governed by the limitations placed on contact products.
    A factor we should also consider is soil activity and the presence of residue. Studies have shown that soil-active products are relatively insensitive to droplet size. But if they have to travel through a layer of trash to get to the soil surface, more application volume is the best tool.

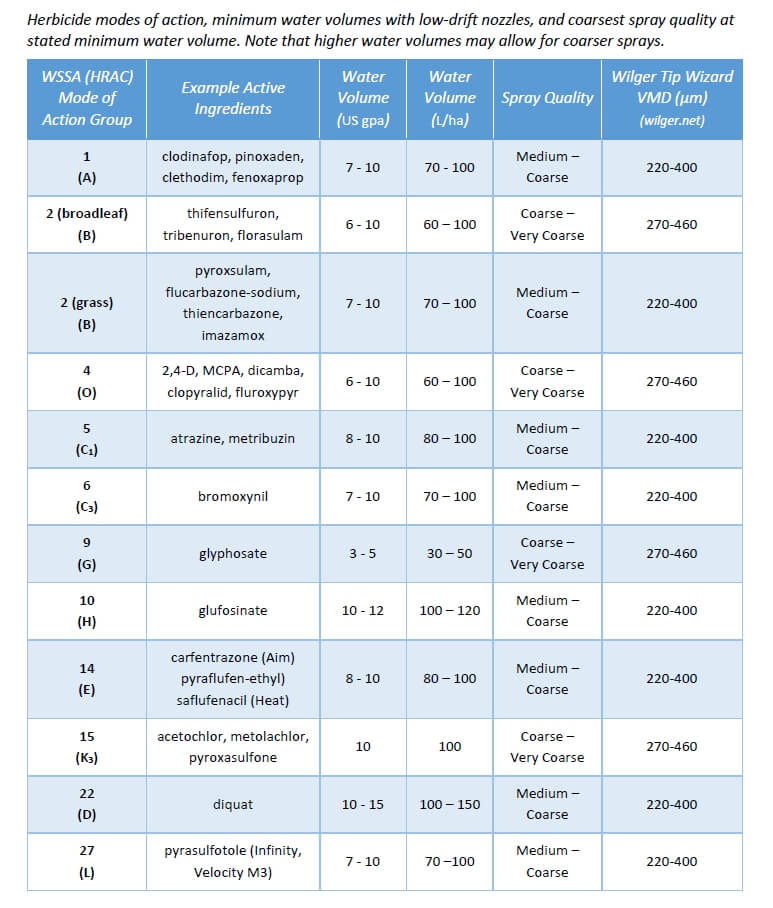
    Below are some recommended spray qualities and water volumes for use in Canada. The spray qualities listed in the table can be matched to a specific nozzle by referring to nozzle manufacturer catalogues, websites, or apps. Note that Wilger also offers traditional VMD measurements on their site, allowing users to be a bit more specific if necessary.

    Click here to download PDF

  • How to Spray Ginseng

    How to Spray Ginseng

    This article was co-written with Dr. Sean Westerveld, Ontario Ginseng and Herb Specialist.

    An effective ginseng protection program begins with observing the Integrated Pest Management (IPM) process:

    • diagnose the problem,
    • monitor the problem,
    • control the problem, and
    • monitor the results.

    When spraying is warranted, the operator should understand the basics of application technology. This not only includes the equipment, but the effects of changing spraying parameters (such as pressure or carrier volume), the impact of weather conditions (such as wind and relative humidity) and the product being applied (such as correct timing and safety requirements). The operator should also understand how to properly maintain, calibrate and orient the sprayer according to the nature of the target. Finally, monitoring the results requires the operator to respond to changes in the environment and target during application and to consider these factors when evaluating the outcome.

    The ginseng garden

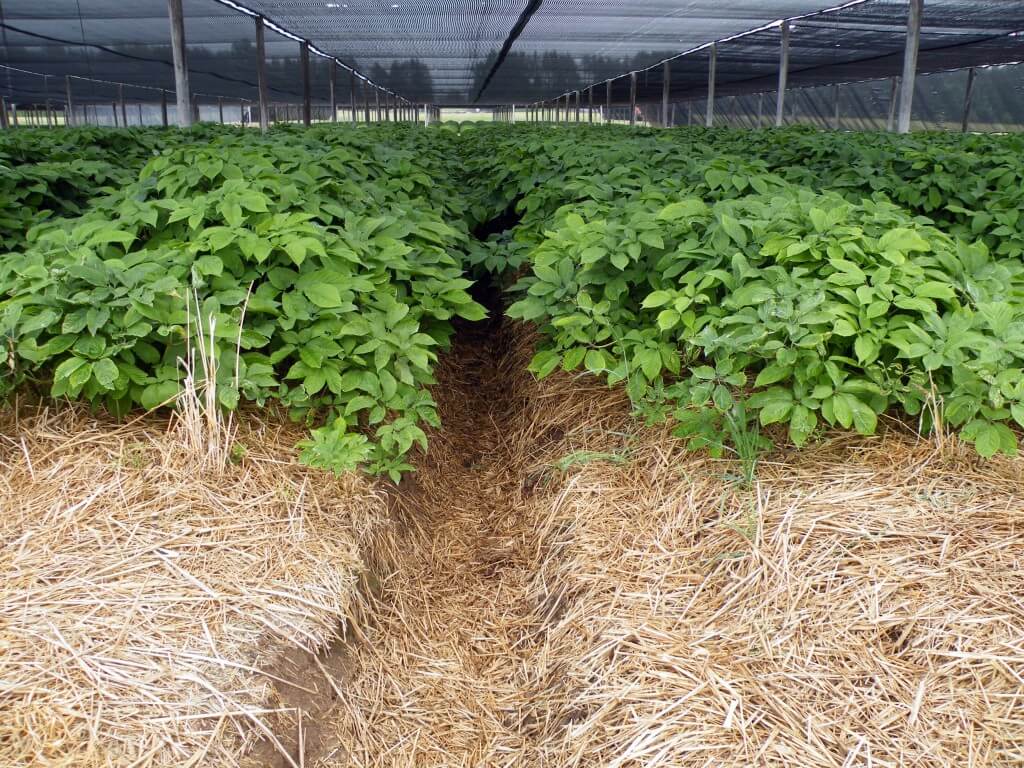
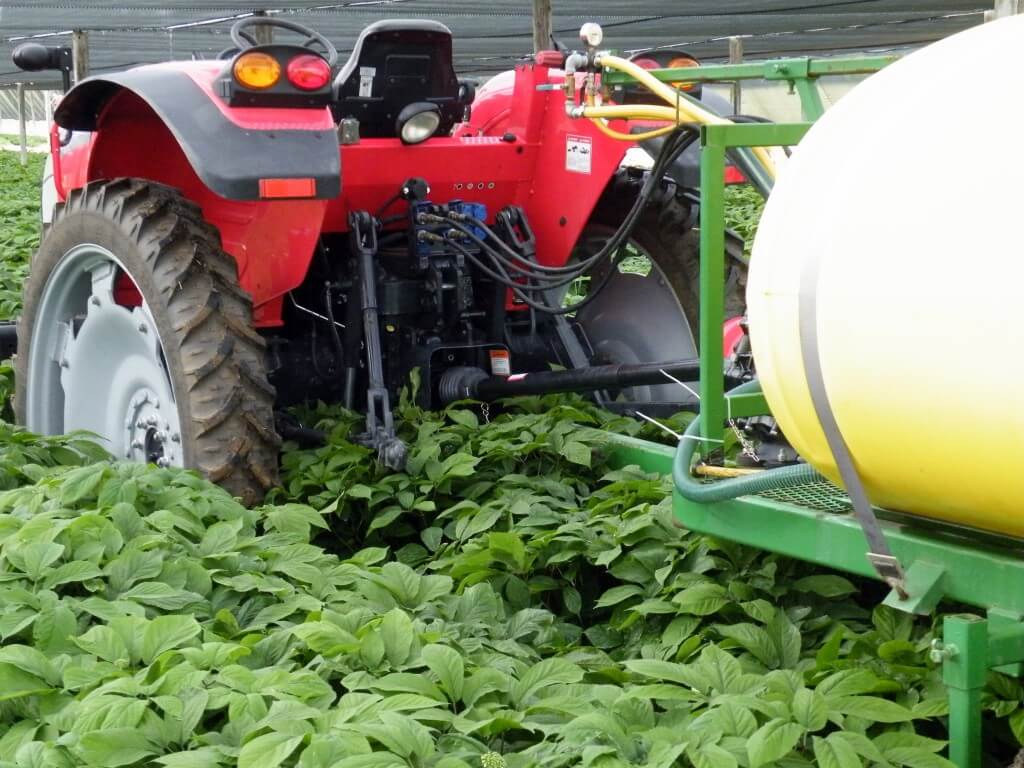
    This is a four-year old garden, which represents one of the largest, densest ginseng canopies an applicator can spray. The six-foot wide beds in this particular garden are higher than most beds, making sprayer/tractor clearance an issue. It also means the distance-to-target from boom to canopy is less in the middle of the bed than it is nearer the alleys, making it difficult to ensure consistent coverage. Sprayer operators typically drive in the same direction over each bed, “training” the plants to bend in the same direction each time the tractor passes over the surface. This practice, combined with fenders on the tractor wheels, helps to minimize physical damage as the sprayer passes.

    Ginseng gardens have high beds.
    Ginseng gardens have high beds.
    In a four year old ginseng garden. Clearance is an issue.
    Clearance is an issue in a four year old ginseng garden.

    The sprayer

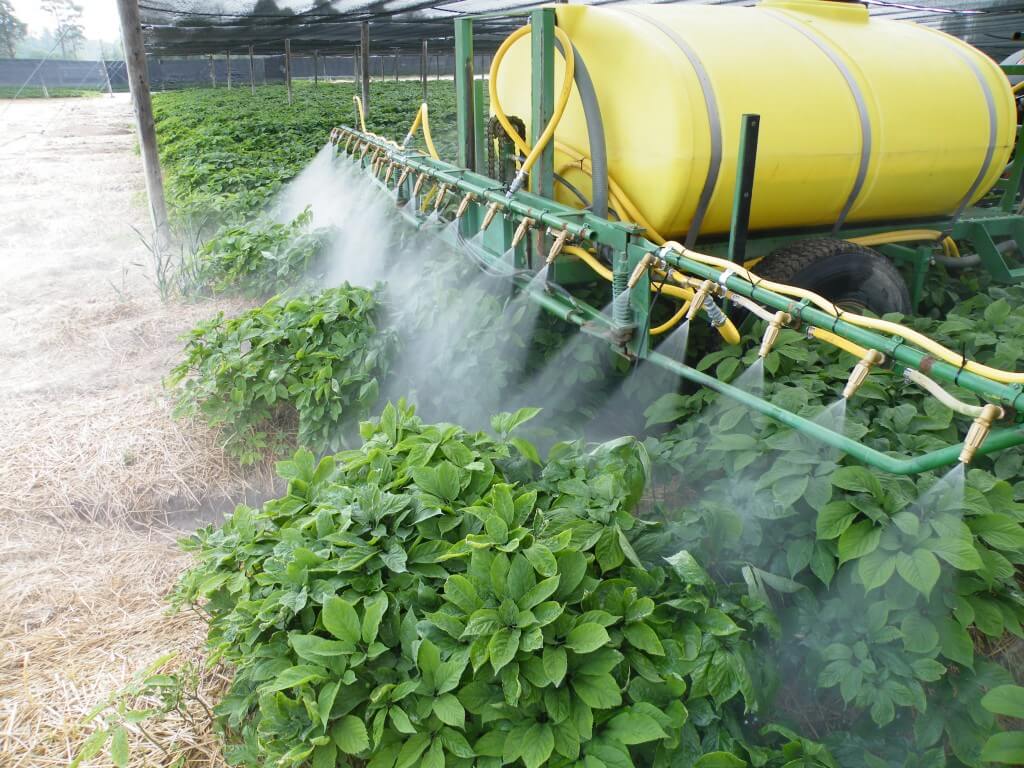
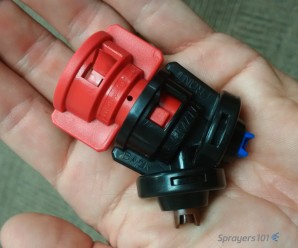
    This custom-built sprayer is a fairly standard design for most ginseng operations: Eight nozzles on each wing and nine on the centre boom. Spacing varies but this sprayer is on 11 inch centres, with the outermost nozzles on five inch centres and aimed outward towards the adjacent beds. Given the limited boom height, all nozzles are aimed back about 45 degrees to increase the distance to target and allow for overlap. The angle is critical to prevent gaps in the spray swath, but given the recommended practice of limited overlap for hollow cone nozzles, the 11 inch spacing may be a little shorter than required.

    Custom-made ginseng sprayer. A standard design.
    Custom-made ginseng sprayer. A standard design in Ontario.

    Spray coverage

    There is no hard and fast rule for spraying ginseng. The crop can receive 30 or more applications a year, most of which are fungicide applications. Tip: Monitoring the small plants inside the canopy is a good indicator of overall garden health.

    The following lists products available for use in Ontario at the time this article was published. The application target varies for each product, depending on the pest or disease the applicator wishes to control. As such, the application volume should reflect the location of the intended target. For example, a foliar-and-stem application should achieve consistent coverage of all leaf surfaces without incurring run-off. An application intended to reach the crown through the straw will require some run-off down the plant stem and should require a higher volume than a foliar-and-stem application. Many products will become immobilized if they dry onto the straw. Applications are best done to wet straw, followed by irrigation or rainfall to wash the product into the root zone. Applications for diseases like Rhizoctonia generally take place early in the season before the canopy closes, and higher volumes may not be required to achieve root coverage. In order to know how much is required for optimal coverage, read on.

    Table 1 – Spray target and relative volume by pest

    PestApplication Target – Specific ProductGarden AgeRelative Volume
    Alternaria and/or BotrytisFoliar and Stem – all productsSeedling – 2nd yearLow
    3rd – 4th yearModerate
    Phytophthora Leaf BlightFoliar and Stem – most productsSeedlingLow
    2nd-4th yearModerate
    Foliar – Aiette and PhostrolAllLow
    Phytophthora Root RotRoot – xylem-mobile root rot productsAllHigh
    Foliar – Aiette and PhostrolAllLow
    Phytophthora Leaf and RootRoot – xylem-mobile root rot productsAllHigh
    Foliar – Aiette and PhostrolAllHigh
    CylindrocarponRoot – all productsAllHigh
    RhizoctoniaRoot – most productsAllHigh
    Root – QuadrisSeedlingHigh
    PythiumRoot – all productsAllHigh
    AphidsFoliar and Stem/Berries – all productsAllModerate
    CutwormsStem – all productsAllLow
    Four-Lined Plant BugFoliar – all productsAllModerate
    LeafrollersFoliar and Stem – all productsAllModerate
    Root Lesion NematodesRoot – all productsAllHigh

    History of the ginseng boom in Ontario

    Historically, ginseng sprayer operators used brass hollow cone nozzles to spray ginseng. For reasons that are unclear, many then adopted the Casotti-style sprayer, which used higher volumes and an oscillating nozzle assembly to create a larger swath. This was determined to be overkill for ginseng, and it produced inconsistent coverage.

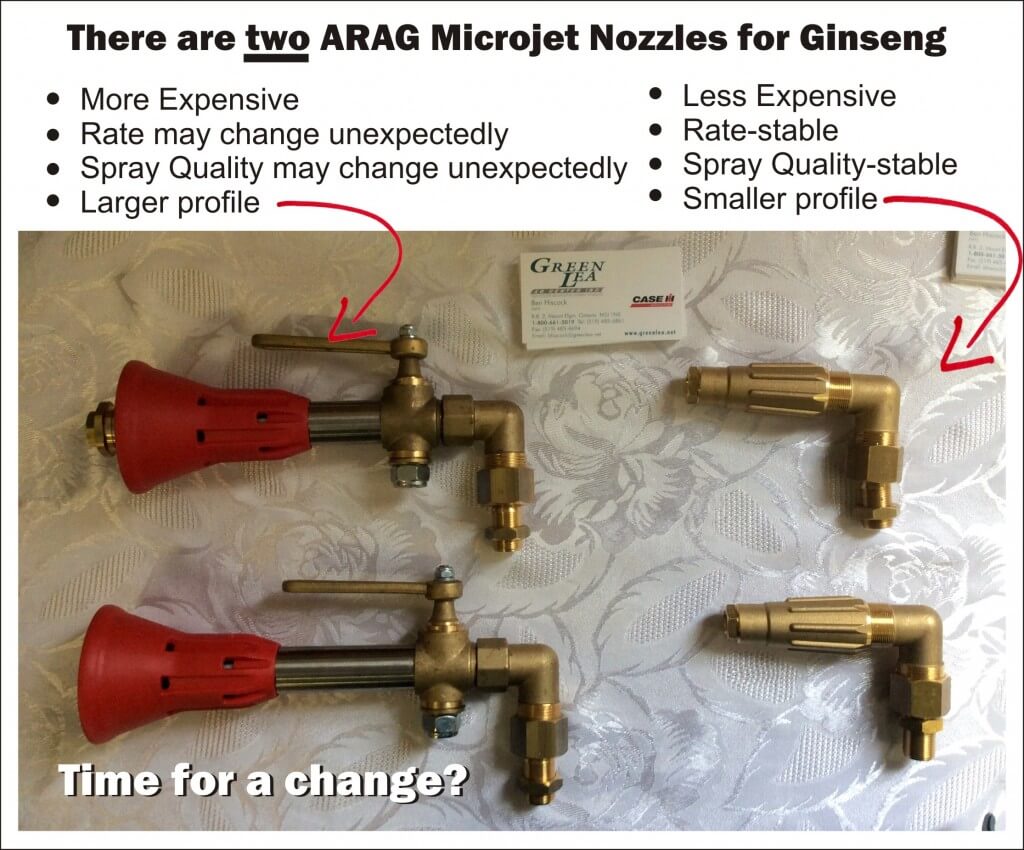
    Many growers (sadly, not all) switched back to horizontal booms and began using the Arag microjet assembly. Drop nozzles (aka drop arms, drop booms, drop legs, etc.) were positioned with disc-core hollow cone nozzles behind the wheels to direct spray into the canopy from below.

    Later, we demonstrated that the microjet mixing valve was difficult to set accurately, creating outputs +/- 50% the optimal rate. In response, a new variation on the Arag microjet was introduced, with a more reliable rate adjustment and a lower price tag (they are imported from Italy by a single North American distributor). The drop nozzles are absolutely critical for under canopy coverage, and growers have begun suspending them in each alley – not just behind the sprayer wheels. I predict the future boom arrangement will return to hollow cone nozzles, but in the form of molded poly nozzles with ceramic handling and drop nozzles with full cone disc-core assemblies. Air assist would be even better.

    Sprayer settings

    Most operators employ a ground speed of about 5 km/h (3.1 mph), operate at about 13.8 bar (200 psi) with nozzles spaced 25-30.5 cm (10-12”) spraying anywhere from 1,000 L/ha (107 gal./ac.) to 1,686 L/ha (180 gal./ac.). The application volume should reflect the stage of crop growth, the age of the garden and the target in question (see Table 1). Applicators should also consider droplet size (Table 2). This is difficult to control given that the majority use Arag microjets with the 1.5 mm orifice disc. In which case, pressure choice will affect median droplet size, with lower pressures increasing median droplet diameter and vice versa.

    Table 2 – The Impact of Droplet Size

    Droplet SizeDrops per areaRetentionCanopy PenetrationDrift Potential
    FineHighHighLowHigh
    MediumModerateModerateModerateModerate
    CoarseLowLowHighLow
    Two versions of the ARAG Microjet.
    Two versions of the ARAG Microjet.

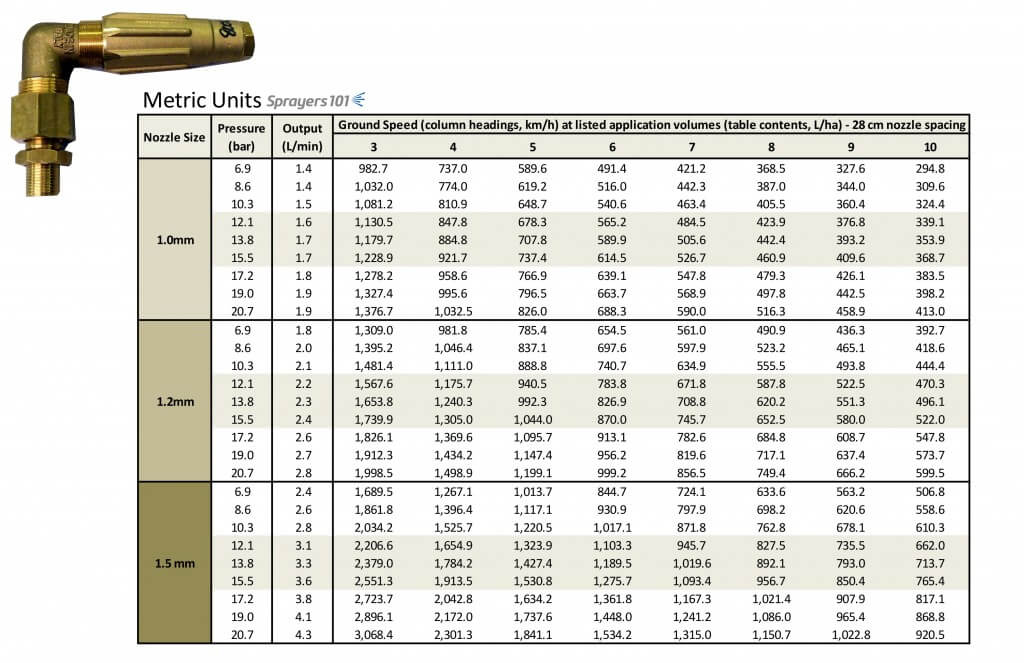
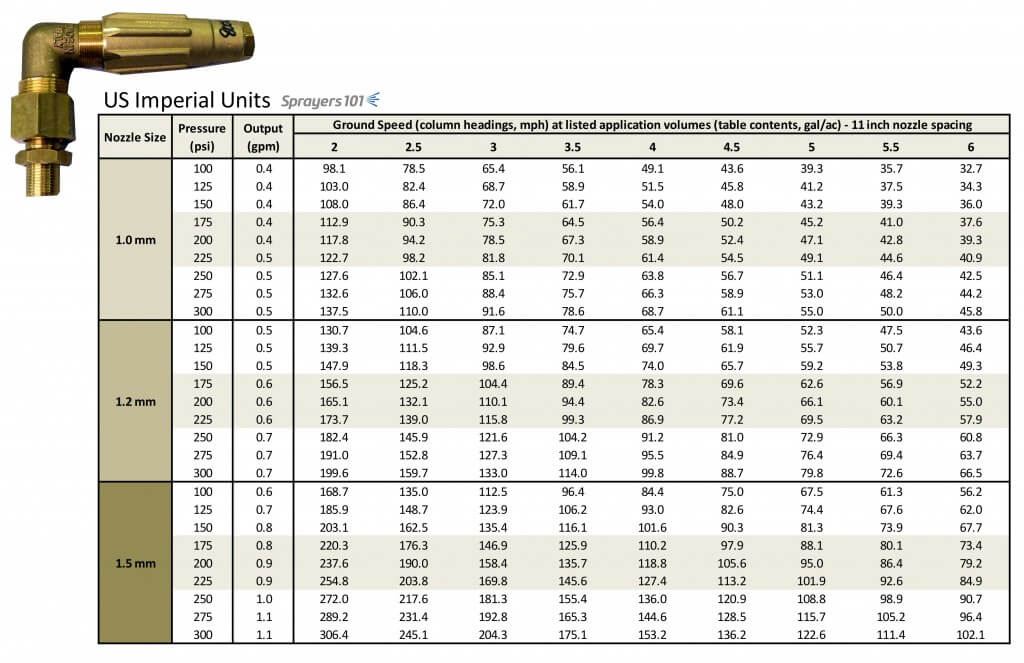
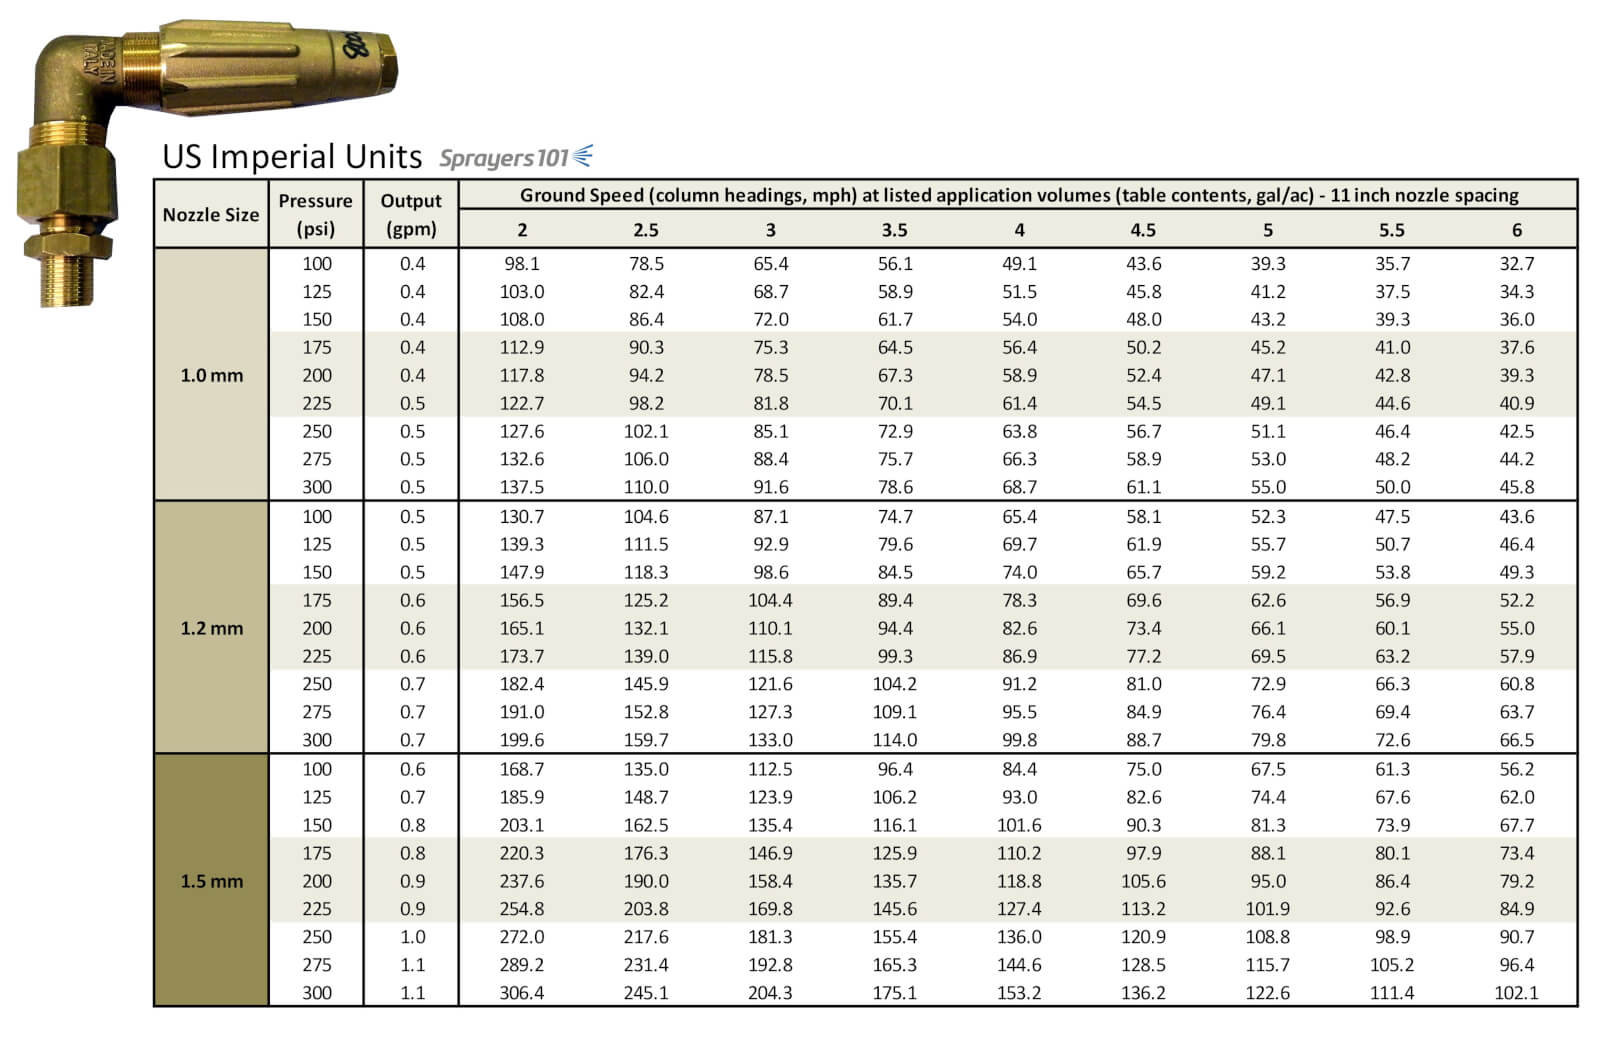
    The older style Arag microjets with 1.5 mm diameter discs have highly variable outputs. We developed tables listing their rates with the mixing valve handle set in two positions. They can be found here. We have also developed tables for the newer Arag nozzles for the 1.0, 1.2 and 1.5 mm discs based on 28 cm (11”) spacing. They are listed in Metric and U.S. Imperial.

    Download the tables here: Metric (or) U.S. Imperial

    ARAG Microjet rates (Metric)
    ARAG Microjet rates (Metric)
    ARAG Microjet rates (U.S. Imperial)
    ARAG Microjet rates (U.S. Imperial)

    Timed output test

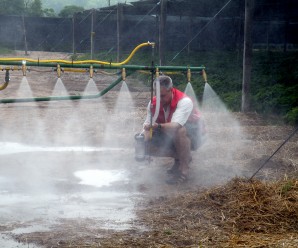
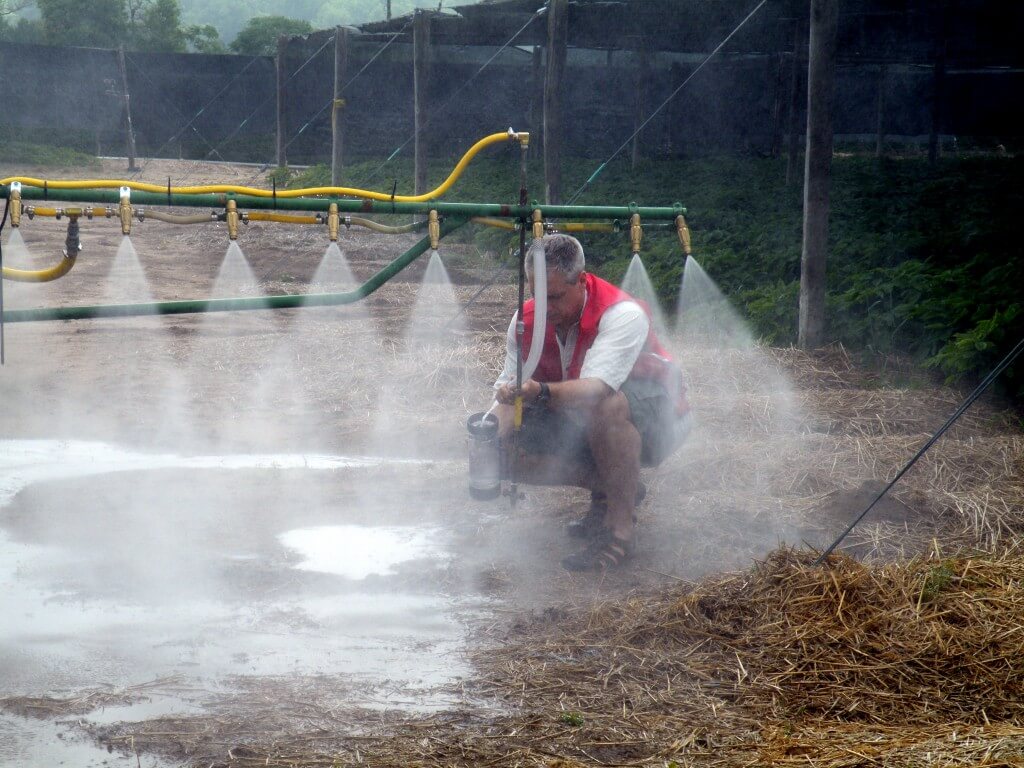
    Park the clean sprayer and get the pressure up to the desired level. Using a calibration vessel, perform a timed output test to determine each nozzle rate. I prefer the SpotOn SC-4 and a length of 1” braided line to direct the spray into the vessel. You will get wet, so ensure the water is clean and/or wear appropriate PPE.

    Timed output test. Prepare to get very wet. Sprayer must be clean and PPE is a must.
    Timed output test. Prepare to get very wet. Unless sprayer is sparkling clean, like this one, PPE is a must.

    At 200 psi, we took readings from each microjet and found that while they were more consistent than the older model, there was still a lot of variation from tip to tip. This required us to turn the valve on the nozzle to get a more consistent output, then take another reading, and repeat until we liked what we saw. It became tricky to adjust the rate without reducing the hollow cone pattern to a solid stream because only a slight turn of the nozzle was required. Once we had it, we tightened the lock nut and moved to the next nozzle. Table 3 is a record of the procedure.

    While calibrating, we noticed some of the nozzles would suddenly appear plugged, or dense lines could be seen in the spray cone indicating something was wrong. We cleaned them to discover bits of plastic from the poly tank. I asked about strainers, but they are not available for the microjets. I asked about in-line filters, but they aren’t rated for 200 psi. Filling the tank with clean water is very important, but even more so with these nozzles.
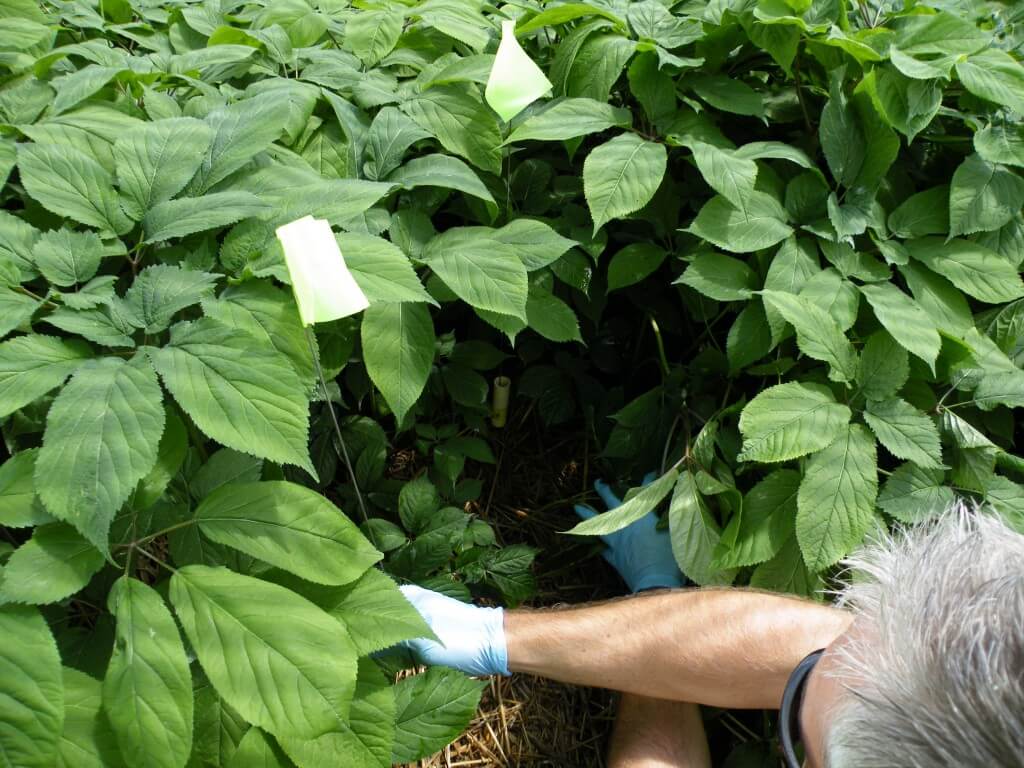
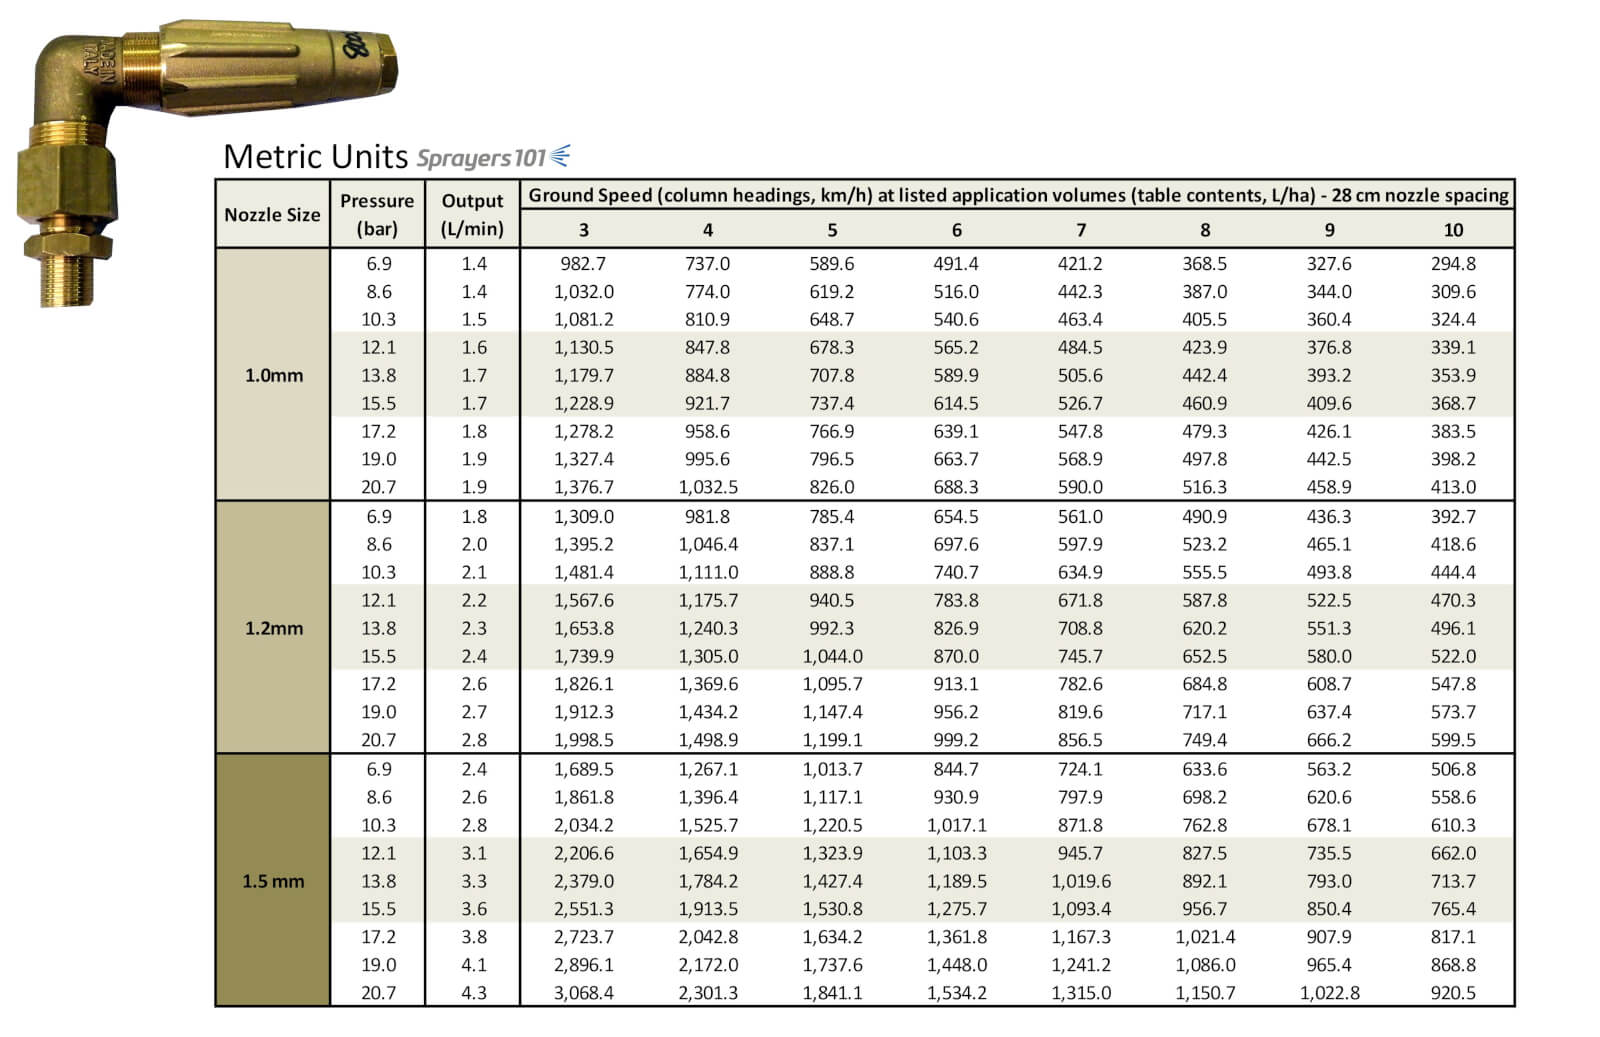
    Table 3 – Calibrating the new Arag microjets

    Nozzle PositionRates in gpm (bold represents final rate)Nozzle PositionRates in gpm (bold represents final rate)
    10.97, 0.96, 0.93140.77, 0.92
    21.07, 1.07, 1.26, 0.9150.76, 0.8, 0.95
    31.1, 1.1, 1.1, 0.93160.97, 0.95
    40.73, 0.92170.73, 1.0, 1.07, 1.0, 0.98
    50.92, 0.92180.83, 0.94
    60.94190.77, 1.0, 0.99, 1.1, 1.24, 10.8, 0.93
    70.88200.77, 0.88
    80.92210.71, 0.95
    90.95220.77, 1.07, 1.04, 1.1, 1.27, 1.0
    100.90231.06, 0.97
    110.86240.77, 0.97
    120.76, 0.83, 1.0, 1.0, 1.2, 0.92250.68, 0.95
    130.77, 0.92
    Average output: 0.93 gpm, standard deviation of 0.03 gpm.
    Ground speed

    Once the nozzles were adjusted, we filled the tank ½ full and measured out 25 m in the bed. We would normally do 50 m, but the row was too short. The sprayer operator drove the course and we measured the time it took to travel the 25 m distance. Pass one took 18.5 seconds and pass two took 18.3 seconds. That’s an average of 18.4, which we then double so it works in the formula = 36.8 s.

    ( 50 × 3.6 ) ÷ 36.8 s = 4.9 km/h

    Adjusting the drop leg nozzles

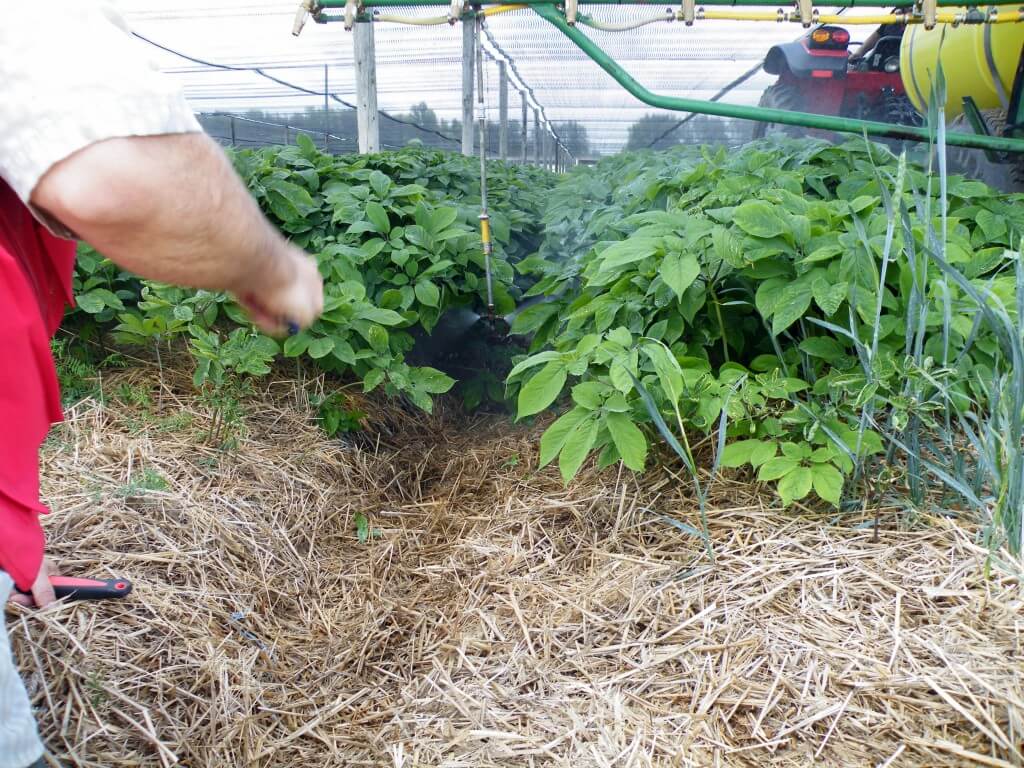
    This sprayer had drops behind the wheels and two more to hang in the adjacent alleys. This is excellent because research has shown considerably improved coverage with directed spray from drop arms. In my mind, these are not optional – they are mandatory!

    Drop nozzles in the alleys.
    Drop nozzles in the alleys.

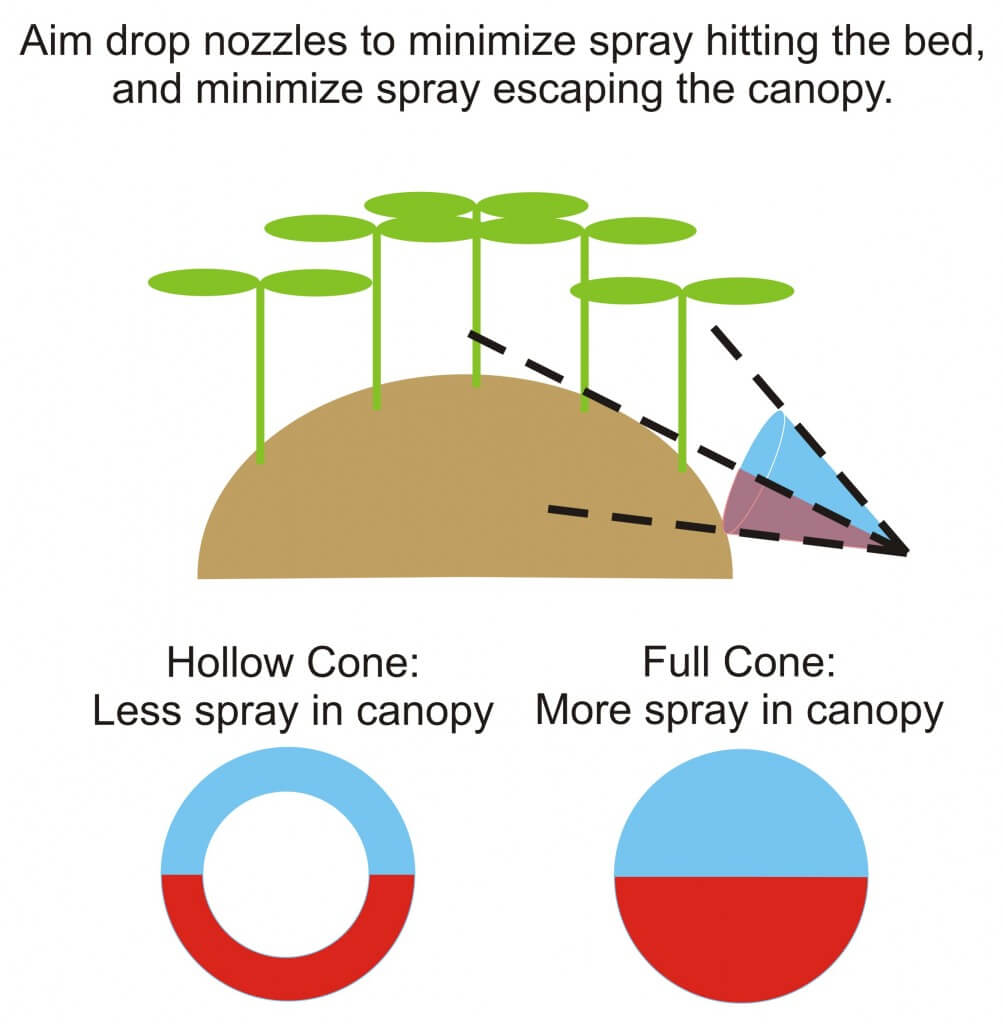
    We swapped out the hollow cones we found in those positions for full cone disc and core (D5-DC35). Full cones increase the number of droplets that will clear the raised bed and enter the canopy. When adjusting them, be sure to minimize the portion intercepting the bed, while minimizing the spray escaping up through the canopy. It’s a fine line.

    Aiming drop arms in a ginseng garden.
    Aiming drop arms in a ginseng garden.

    Calculating sprayer output

    25 microjets at 200 psi = average of 0.93 gpm = 23.25 gpm
    8 × D5-DC35 at 200 psi = 1.4 gpm × 8 = 11.2 gpm
    That’s ~34.5 gpm for the boom.
    Ground speed was 4.9 k/hr or ~ 3mph.

    GPA = (GPM × 5,940) ÷ (mph ÷ nozzle spacing in inches)
    GPA = (34.5 gpm x 5,940) ÷ (3.0 mph × 11 inches)
    GPA = 204,940 ÷ 33
    62.1 GPA or about 580 L/ha.

    Diagnosing coverage

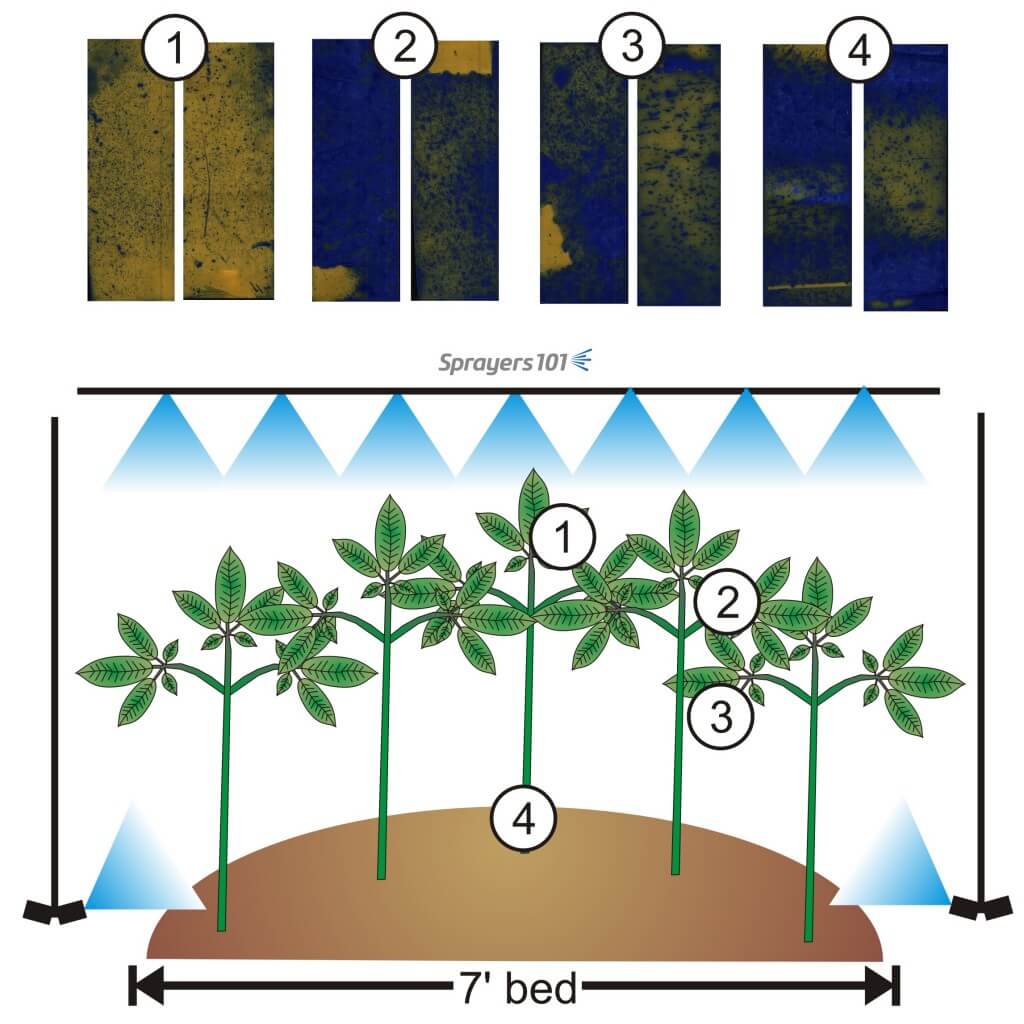
    Water sensitive paper, which turns from yellow to blue when contacted by moisture, was placed in the ginseng canopy. Two sets of papers were set out, with four papers in each set. The canopy was still wet with rain, which made placement difficult as the papers would accidentally contact water on the leaves and change colour prematurely.

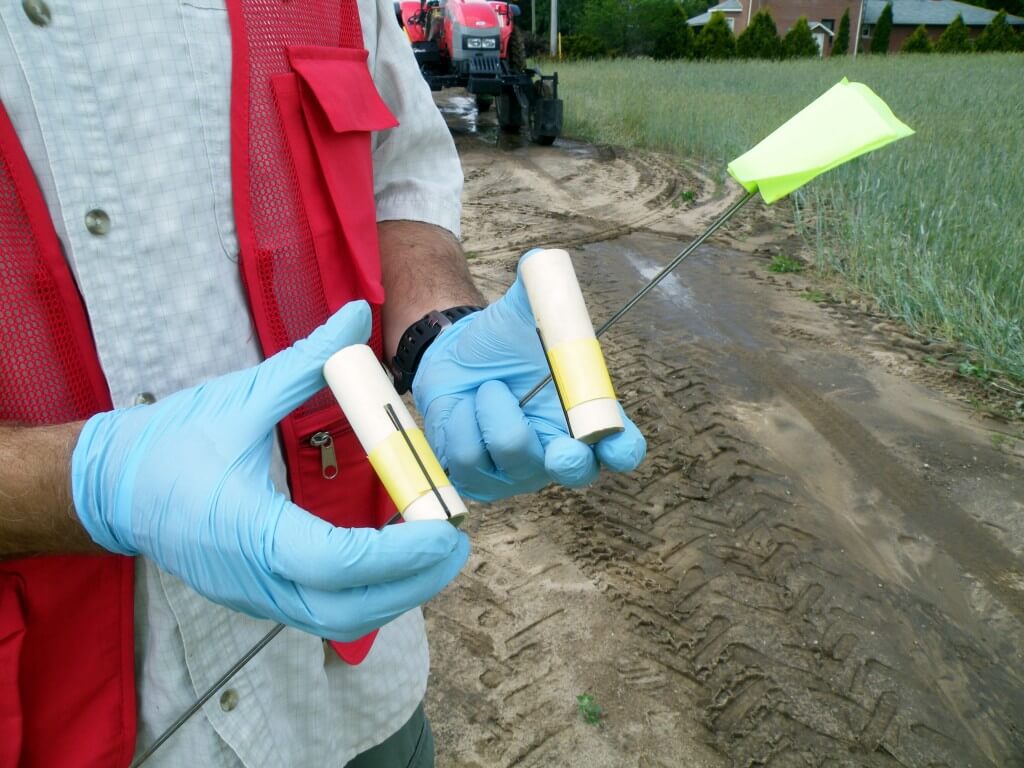
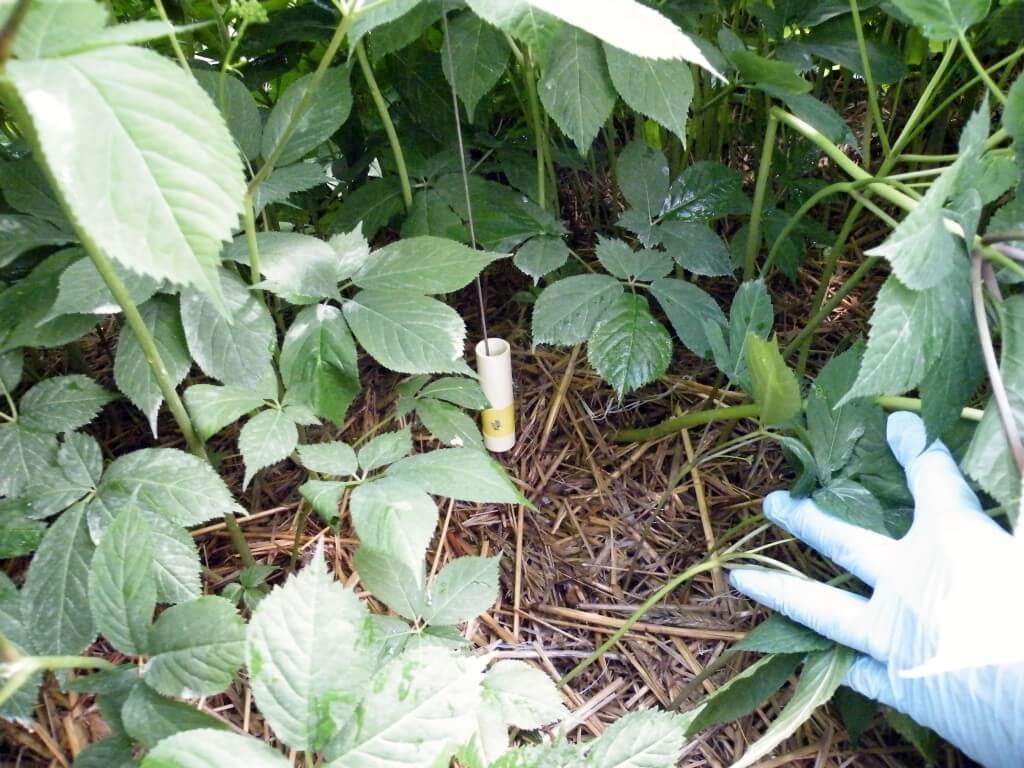
    Water-sensitive paper wrapped around tubes for panoramic coverage.
    Water-sensitive paper wrapped around tubes for panoramic coverage.
    Position#1Clipped face-down on the underside of leaves at the top of the canopy.
    Position#2Clipped face-up on the upper side of leaves in the middle of the canopy.
    Position#3Clipped face-down on the underside of leaves in the middle of the canopy.
    Position#4Wrapped around a plastic tube and threaded over a wire flag, located at the foot of the plant to give panoramic coverage at the root.

    The sprayer passed over the canopy spraying water, and papers were carefully retrieved, allowed to dry and scanned.

    Panoramic papers in situ.
    Panoramic papers in situ.
    Flags mark the locations of papers.
    Flags mark the locations of papers.

    Generally, there were no “misses” whatsoever. Position 1 showed excellent coverage, with no indication of run-off and a high droplet count with even distribution. This is ideal for foliar applications, and under-leaf coverage is notoriously difficult to achieve. Positions 2 through 4 showed excessive coverage, with the exception of one of the position 3 papers, which was still adequate.

    Example of coverage and paper locations in canopy.
    Example of coverage and paper locations in canopy.

    Next steps

    Ideally, the operator would drop the pressure by 20 psi increments, reducing output until coverage failed. It is important to note that the operating pressure must never approach the lower end of the nozzle’s recommended pressure range, or the spray quality will be compromised and so will coverage.

    Once the coverage is considered a failure, the operator would return to the lowest output that did a good job, and the sprayer is calibrated for that crop (at that stage of growth).

    Note that the calibration must be performed for each significantly different crop. With the exception of an early-season drench intended to contact the entire root, an emerging one year old garden would need a very different prescription than a four year old garden with a fully-developed canopy. Plus, the weather conditions will affect coverage, so do not calibrate in conditions you would not normally spray in. Hot and dry and windy conditions produce very different coverage compared to cool, humid and still conditions.

    Once the operator knows what each garden requires, they will be able to mix their tanks using the same concentration of carrier to formulated product as they normally use, but likely go further on the tank. It will take some practice before the operator knows how much spray mix is required to finish the job.