Tag: berry

  • Crop-Adapted Spraying in Highbush Blueberry: Ten years of pesticide savings

    Crop-Adapted Spraying in Highbush Blueberry: Ten years of pesticide savings

    A 15-acre highbush blueberry operation in southern Ontario reduced annual spray volume by an average of 70.5% and pesticide costs by 63% without compromising commercially acceptable pest or disease control.

    The results were not achieved by changing sprayer settings alone. They followed three complementary changes:

    1. Improving canopy and harvest management
    2. Replacing an inefficient sprayer
    3. Using Crop-Adapted Spraying to match spray volume and pesticide rate to the canopy

    Together, these changes reduced average spray volume from approximately 1,000 to 400 L/ha and saved an estimated $5,850 CAD in pesticide costs each year.

    Why Falcon Blueberries changed their approach

    In 2016, serious spotted-wing drosophila (SWD) pressure prompted the growers to reconsider their crop protection program.

    The project tracked pesticide use, water use, yield, and operational outcomes against historical values. SWD activity was also monitored for three years, both within the planting and in wild hosts along its border. Results were compared with monitoring data from nearby berry and tender fruit operations using conventional spray programs.

    1. Improving canopy and harvest management

    The first step was to make the crop easier to protect.

    Beginning in 2016, the growers:

    • Conducted their first heavy pruning
    • Aimed to remove approximately 30% of the plant material annually
    • Picked more frequently and more thoroughly
    • Collected and buried dropped and culled berries

    Heavy pruning initially raised concerns about lower yield and the possible need for trellising. Instead, the growers observed improved berry quality and spent fewer hours removing damaged fruit on the packing line. They concluded that the improvement in marketable fruit offset the effects of removing plant material.

    Pruning also produced a more open and uniform spray target. This was an important prerequisite for reducing spray volume because dense, irregular canopies are more difficult to penetrate consistently.
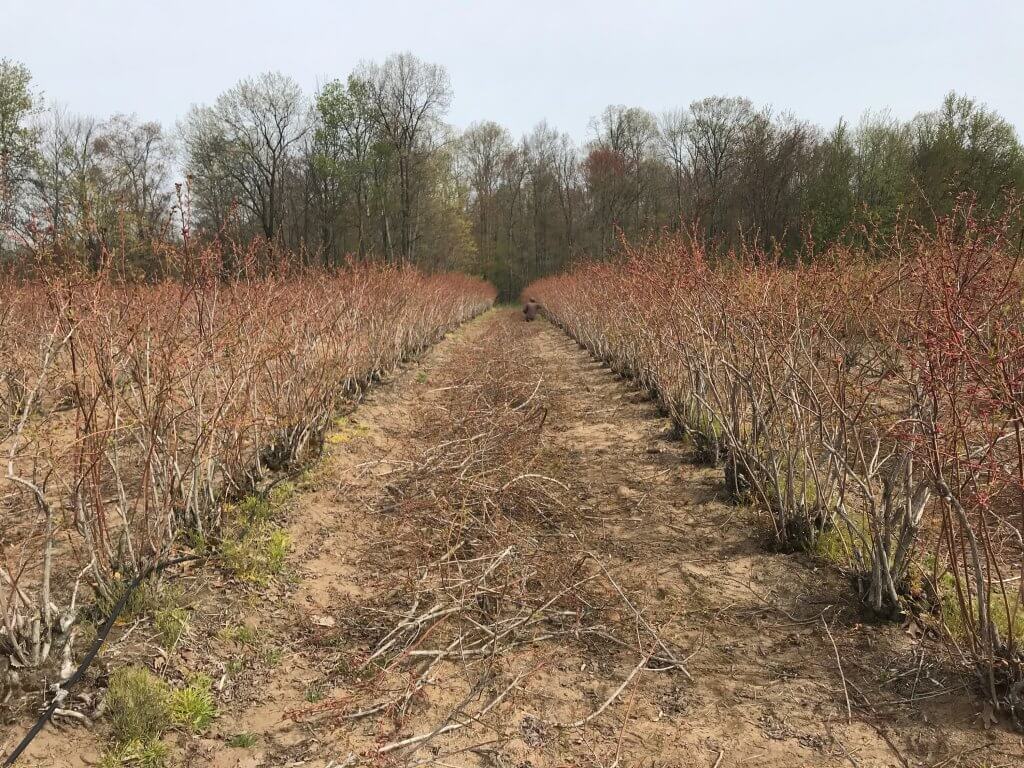
    Heavy pruning in 2016.
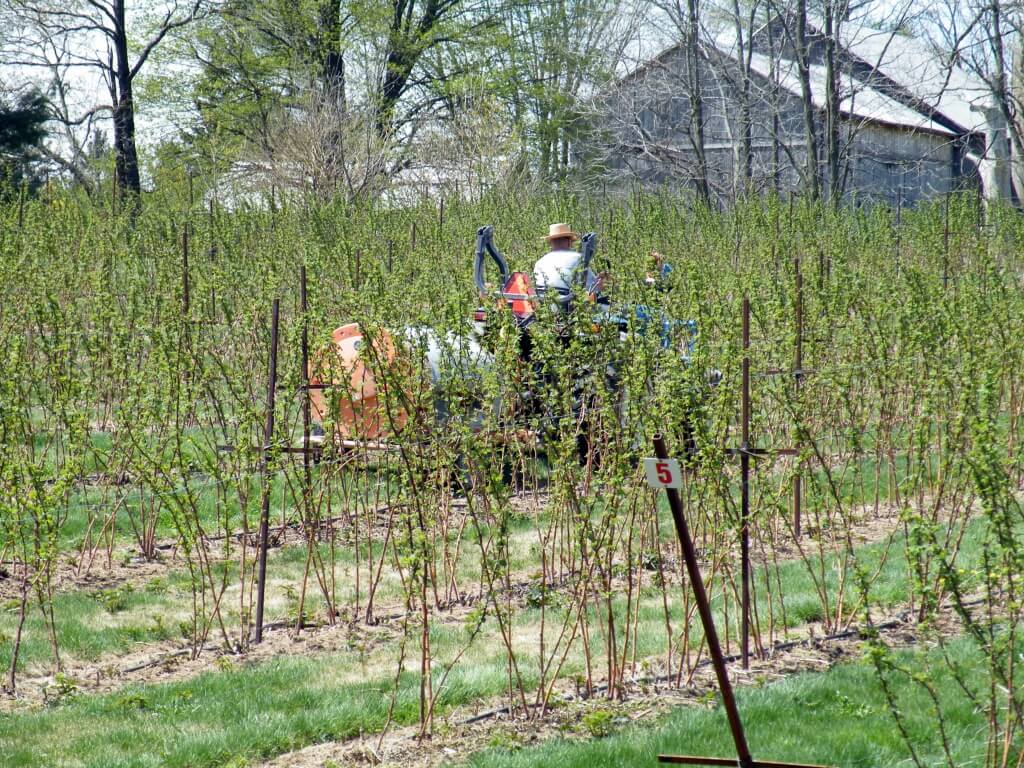
    Most years, bushes were pruned ~30% to maintain an ideal size and shape.
    Pickers were educated in how to pick cleanly and dropped / culled fruit was collected and buried.

    2. Selecting a sprayer suited to blueberries

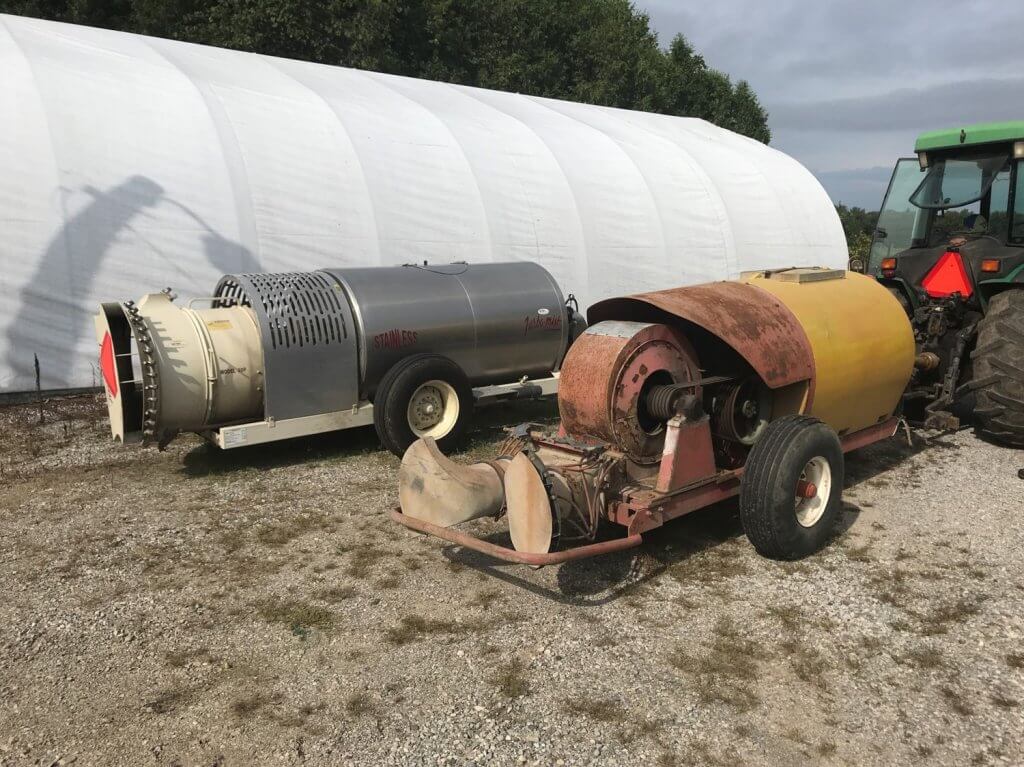
    In 2018, the operation replaced its aging KWH air-shear sprayer with a low-profile axial-fan sprayer equipped with conventional hydraulic nozzles.

    The KWH sprayer had been designed for standard fruit-tree canopies. It generated air speeds greater than 100 mph and produced an Extremely Fine spray quality. These characteristics were poorly matched to the shorter, denser architecture of highbush blueberries.

    The growers considered a cannon-style sprayer that could treat several rows in one pass. However, their priorities were improved coverage and reduced off-target loss. They therefore selected a low-profile sprayer and continued to travel every row.

    The new sprayer provided several immediate benefits:

    • Better control over droplet size and liquid distribution
    • Air direction and volume better suited to the canopy
    • Greater reliability
    • Lower fuel use
    • Less noise
    • Elimination of leaks
    • Positive nozzle shutoff at row ends
    Fore: An old KWH air shear sprayer. Rear: Low profile axial sprayer with conventional hydraulic nozzles.

    Correcting leaks and eliminating continued discharge during turns reduced spray use by approximately 20% before any further rate adjustment was made.

    3. Matching the application to the canopy

    Crop-Adapted Spraying, or CAS, provides a structured way to adjust an airblast application to the size, density, and shape of a three-dimensional crop canopy.

    Several established dose-expression systems perform a similar function, including Tree-Row Volume, PACE+, and DOSAVIÑA. Although each has value, adoption can be limited by crop-specific requirements or complicated calculations.

    CAS formalizes adjustments that experienced applicators often make informally, such as:

    • Turning individual nozzles on or off according to canopy height
    • Redistributing flow among nozzle positions
    • Adjusting travel speed for canopy density
    • Changing air output and direction to improve penetration and reduce loss

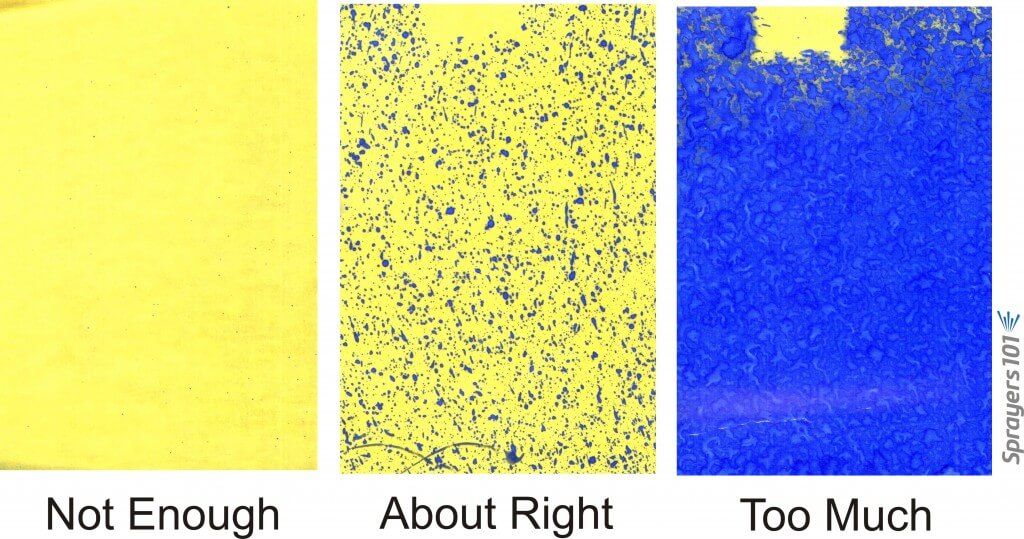
    The blueberry sprayer was calibrated by adjusting air energy and direction, travel speed, nozzle selection, and liquid distribution. Water-sensitive paper was placed throughout the canopy to confirm that the revised settings provided acceptable coverage.

    The working coverage targets were:

    • At least 85 deposits/cm²
    • Approximately 10% to 15% surface coverage
    • Achievement of these targets in at least 80% of the sampled canopy
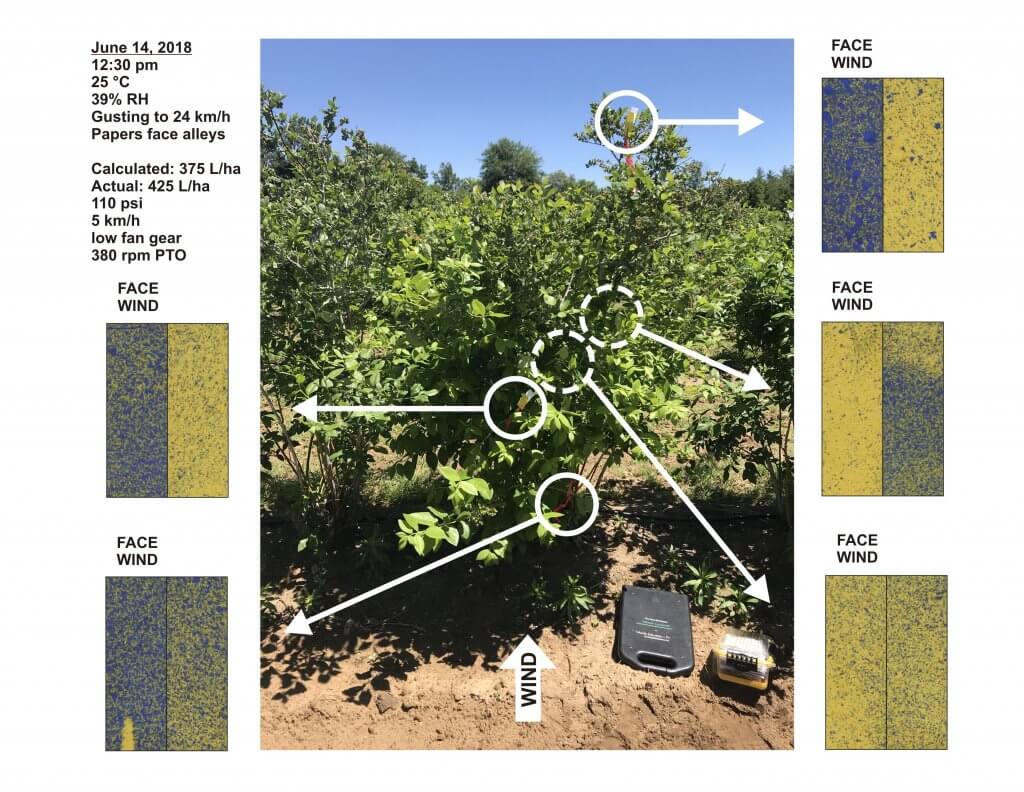
    Example of water sensitive paper coverage on a windy day (worst case scenario) in June, 2018.

    During the first season, coverage was reassessed every few weeks from April through June as the canopy developed.

    Spray volume / Pesticide

    Once the new sprayer was calibrated to the managed canopy, spray volume declined from approximately 1,000 to 400 L/ha. The concentration of formulated product in the spray mixture remained unchanged. Instead, the calibrated sprayer allowed each tank to treat a larger area while maintaining the required canopy coverage.

    Before the sprayer replacement and adoption of CAS, the operation applied approximately 78,260 L of spray mixture annually. Average annual water savings were approximately 55,173 L, equivalent to a 70.5% reduction. That’s almost 1/2 a million liters in 10 years.

    The lower spray volume also saved an estimated 15 hours of filling and spraying each year. This reduced labour and equipment time while potentially reducing operator fatigue and exposure associated with mixing and loading

    Pesticide costs were compared annually with the farm’s 2017 program using updated product prices. On that basis, the average savings were approximately:

    • $5,850 CAD per year
    • 63% of the equivalent pesticide cost

    Pest and Disease Monitoring

    The growers retained responsibility for product selection and application timing. Products were rotated, and treatment decisions were made according to integrated pest management principles.

    Air-induction hollow-cone nozzles were installed in the uppermost nozzle positions. The larger droplets produced at the top of the spray plume were more likely to settle if they passed over the canopy, reducing the potential for off-target movement

    SWD monitoring

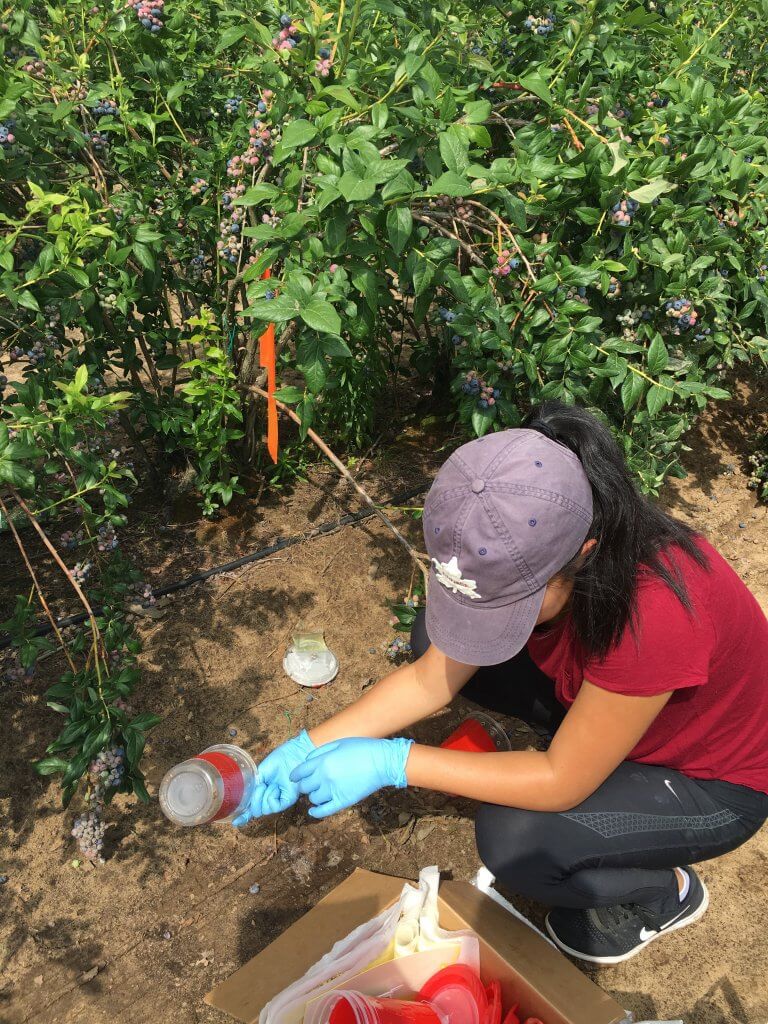
    Spotted-wing drosophila traps were monitored weekly from 2018 through 2020. Three traps were placed within the blueberry crop and one was placed in an unmanaged wild host along an adjacent treeline.
    Regional monitoring provided comparisons with other horticultural operations:

    • Up to 16 berry and tender fruit sites in 2018
    • Approximately 10 to 12 sites in 2019
    • Four blueberry, raspberry, and cherry sites in 2020

    Average SWD captures were higher at surrounding conventionally managed sites in 2018 and 2020. Captures were higher in the CAS planting in 2019. Across the three monitoring years, the overall difference was negligible.

    Trap capture does not necessarily predict the amount of fruit damage. The growers therefore also tested harvested berries regularly. SWD damage remained within commercially acceptable limits, and the growers reported satisfactory disease control.

    Because the monitoring was not replicated or subjected to statistical analysis, it cannot establish that CAS provided equivalent control under all conditions. It does indicate that, on this farm, lower spray volumes and pesticide use were compatible with acceptable commercial control.

    Yield and seasonal conditions

    Yield varied for reasons unrelated to sprayer calibration, including pruning intensity, labour availability, harvest timing, market conditions, and weather.

    • 2016: The baseline before any management changes. The farm harvested 12,076 flats, each containing approximately 9 lb of fruit.
    • 2017: Following the initial canopy-management changes, harvest increased to 18,335 flats; an increase of approximately 50%.
    • 2018: Yield remained essentially unchanged in the first year of CAS.
    • 2019: Harvest began about one month late. Low blueberry prices also prompted the farm to stop harvesting approximately one month early. Allowing for the shortened harvest period, production appeared comparable with previous years.
    • 2020: Anticipated shortages of seasonal labour during the COVID-19 pandemic led the growers to prune heavily and deliberately reduce the crop.
    • 2021: Little pruning was needed following the previous year’s heavy pruning. The resulting denser canopy, combined with unusually high precipitation, contributed to serious anthracnose pressure. More fungicide applications were made than in any other study year, although CAS-calibrated rates and settings were maintained.
    • 2022 and 2023: Spotted-wing drosophila pressure was low, anthracnose pressure was moderate, and production conditions were relatively typical.
    • 2024: Heavy rainfall contributed to an early start and finish to the season, but yield remained near normal.
    • 2025 and 2026: The seasons were generally typical, with no major production disruptions.

    These annual differences demonstrate why pesticide use, pest pressure, yield, and weather should be interpreted together. A low-use year may reflect either improved application efficiency or low pest pressure. Likewise, a high-use year may reflect exceptional disease pressure rather than a failure of the calibration method.

    Additional benefits reported by Falcon Blueberries

    The operation identified several benefits beyond direct pesticide and water savings:

    • Reduced pesticide use provided a positive response to questions from U-pick customers.
    • Lower environmental pesticide loading aligned with the growers’ production philosophy.
    • During a regional fungicide shortage in 2018, the farm had enough unused product to return some to the distributor.
    • Reduced early-season disease damage decreased the amount of fruit removed on the packing line.
    • Fewer tank fills reduced labour, machinery time, and interruptions during spraying.

    Practical implications for all highbush blueberry growers

    The results from this farm should not be interpreted as a recommendation to reduce pesticide rates by a fixed percentage. The important principle is to match the application to the canopy and confirm performance. Growers considering a similar approach should:

    1. Manage the canopy. Maintain a reasonably open and consistent target through regular pruning.
    2. Correct obvious sources of waste. Repair leaks, confirm positive nozzle shutoff, and prevent discharge during turns.
    3. Match the sprayer to the crop. Adjust fan output, air direction, nozzle positions, droplet size, travel speed, and liquid distribution.
    4. Measure coverage. Use water-sensitive paper or another suitable method at representative locations and depths.
    5. Reassess as the canopy changes. Settings that work before bloom may not be appropriate after the canopy fills.
    6. Respect the label. Do not reduce application volume or pesticide use below label requirements.
    7. Document the results. Record settings, weather, water volume, products, pest pressure, coverage, and crop response.
    8. Make changes incrementally. Confirm coverage and control before adopting larger reductions.

    The achievable reduction will vary with canopy size and density, sprayer design, product requirements, pest pressure, weather, and the applicator’s ability to verify coverage.

    Conclusion

    Over ten years, this southern Ontario blueberry operation substantially reduced spray volume and pesticide costs while maintaining commercially acceptable pest and disease control. These outcomes resulted from a coordinated production-system change rather than from a single calibration adjustment. Canopy management created a more accessible target, the new sprayer provided better control of air and liquid, and Crop-Adapted Spraying supplied a repeatable method for confirming coverage.

    The case study demonstrates that meaningful pesticide savings are possible when rate adjustment is based on crop structure, appropriate application technology, and measured coverage. It also reinforces an important limitation: results from one farm should guide further evaluation, not replace on-farm calibration, label compliance, or local validation.

    Here’s a narrated PowerPoint presentation of this study (includes data up to 2020):

    The monitoring portion of this project was funded by Niagara Peninsula Fruit and Vegetable Growers Association, Ontario Grape and Wine Research and Ontario Tender Fruit Growers in collaboration with private consultants.
  • How to Succeed with a Soil Drench Application in Strawberries

    How to Succeed with a Soil Drench Application in Strawberries

    In 2016, Ontario berry growers were surveyed to determine the typical spray volume they used to apply unspecified crop protection products. For strawberry growers (day-neutral and June-bearing), the results spanned 50 to 1,000 L/ha (~5 gpa to ~100 gpa). In an earlier survey (2013), respondents specified 250 to 650 L/ha (~26.5 to 70 gpa) for fungicides, herbicides and insecticides. Miticide applications were as high as 750 L/ha (80 gpa).

    This rather wide span of carrier volumes shouldn’t be surprising. No matter the horticultural cropping system, the choice of carrier volume reflects the operation’s unique pressures and priorities. These variables include, but aren’t limited to, operation size, spray equipment, crop varieties/staging, geography, and pest profiles. The ultimate goal is to achieve threshold coverage (i.e. efficacy) while maximizing productivity.

    However, even the highest carrier volume reported did not reach the volumes required for those crop protection products intended to drench the soil. These products can span a range of 1,200 to 2,000 L/ha (~128 to 214 gpa). Experienced matted-row strawberry growers employ different methods to apply soil drenches, and we will discuss them later in the article. But first let’s address three common factors that must be considered:

    Know the target

    If (for example) the target is white grubs in the root zone, or phytopthora root rot, then the spray should be focused at the base of the plant in a banded application. Performing a broadcast application that covers the alleys as well as the plant rows may represent wasted spray. Knowing the target can help make the most efficient use of carrier.

    Know the soil

    Soil that is compressed or has high clay content won’t soak up water as quickly as drier, looser or sandier soil. If the beds are raised and resist absorption, much of the volume will run off into the alleys. This may not be desirable if the target is the raised bed itself. The following basic water movement principles come from the Manitoba Agriculture, Food and Rural Initiatives Soil Management Guide.

    • Water flows more quickly through large pores (sandy soils) than small pores (clay soils); water is held more tightly in small pores (clay soils) than in large pores (sandy soils).
    • Water moves from wet areas to dry areas (not necessarily by gravity) due to forces of adhesion and cohesion. This is called matric flow.
    • Water will not move from small soil pores to large soil pores unless conditions are saturated.

    Know the weather forecast

    Spraying on a hot, dry day means a higher rate of evaporation. As the carrier evaporates, the product will have less opportunity to infiltrate the soil. Conversely, applying product just before a heavy rain can result in a much diluted product being rinsed too deeply into the soil and beyond the target area.

    Consider that one millimetre of rain on one hectare of land is 10,000 litres. That seems like a lot, but how deeply does it infiltrate into soil? One way to know is to use calculations based on soil porosity and bulk density. From these calculations it can be generalized that 25 mm of rain will infiltrate 45 mm into dry, sandy soil, but only 32 mm into dry clay soil. Remember, that 25 mm of rain represents 250,000 L/ha!

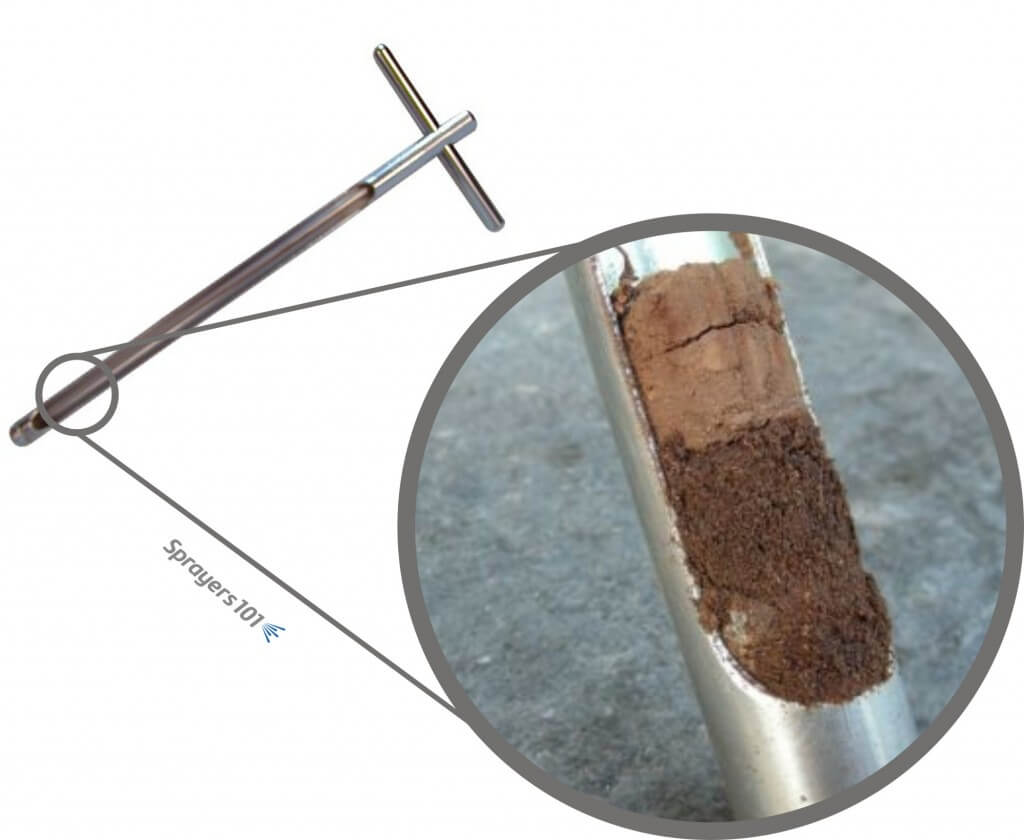
    Perhaps the best way to know how far water will infiltrate the soil is to use a soil probe (aka soil sample tube). They can be purchased from local dealers for about $100.00 CAD, or they could be borrowed from whomever provides soil sampling services in the area. For the best results, perform this test in multiple locations in the field.

    The soil probe. See how far water infiltrates soil by taking core samples.
    The soil probe. See how far water infiltrates soil by taking core samples.

    So what methods do strawberry growers employ to apply a drench? Here are the top three:

    1. Slow down

    Some growers elect to use their existing sprayer setup, but they slow down to get more volume on per hectare. For example, if the grower normally applies 500 L/ha (53.4 gpa) driving at 5 km/h (3.1 mph) they would have to drive 1.25 km/h (0.78 mph) to achieve the 2,000 L/ha some labels require. If the sprayer tank held 1,500 litres (~400 US gallons) that would mean doing 0.75 hectares (1.9 acres) to a tank compared to the normal 3 hectares (7.5 acres). That would be four times as long, without considering the time for the extra refills.

    Alternately, but related to slowing down, is double-pass spraying. In this case the tank is mixed at half-rate and the operator makes a pass through the field. Then, a second half-rate tank is applied immediately afterwards, ideally driving from the opposite direction. This effectively gives a full rate of product in a higher volume of water.

    2. Re-nozzle

    When slowing down is not enough (or not an option), some growers elect to re-nozzle. It may be tempting to increase the operating pressure to increase output on existing nozzles, but that makes finer droplets which tend to drift off target. The largest hollow-cone nozzles will only emit ~870 L/ha at 5.0 km/h (93 gpa at 3.1 mph) and that’s at 125 psi, which many trailed sprayers cannot manage. Further, many labels indicate a need for Coarse droplets in a drench, and hollow cones cannot produce such large droplets.

    There are a limited number of flat fan nozzles that can achieve sufficiently high rates, and even then they must be used at slightly slower travel speeds. For example, the TeeJet AI11008 used at 70 psi will apply 145 gpa (~ 1,350 L/ha) with a Very Coarse spray quality at 4 mph (6.4 km/h). Driving slower can rise those volumes considerably. Alternately, streamer nozzles (e.g. TeeJet’s 5 or 7 hole StreamJets) require lower pressures (up to 60 psi) to emit as much as 2,310 L/ha at 5.0 km/h (247 gpa at 3.1 mph). The grower can maintain their travel speed, but will still have to refill more often.

    3. “Wash In” the spray

    Still another choice is to apply the product using the existing sprayer set-up, using a typical carrier volume, just prior to a rain event or sprinkler (not drip line) irrigation. For example, if the grower normally applies 500 L/ha (53.5 gpa), they would continue to do so. If the grower is relying on rain to wash the product in, it should be sufficient precipitation to move the product to the desired soil depth. Where sprinklers are an option, this can be controlled, and the depth of infiltration tested with a soil probe. Washing in the spray should take place as soon after application as possible to ensure the product is distributed evenly into the soil.

    Thanks to Pam Fisher, former OMAFRA Berry Crop Specialist, and Anne Verhallen, former OMAFRA Soil Management Specialist, for their contributions to this article.

  • Disease Control in Berry Crops

    Disease Control in Berry Crops

    In the spring of 2016, the Ontario Berry Growers Association (OBGA) conducted a survey of its membership to poll how fungicides were being applied. The results were very interesting.

    Fungicide basics

    Generally, fungicides registered for berry crops are contact products, so coverage and timing are very important. The fungicide has to be distributed evenly on the target before disease has a chance to infect the crop. That means the sprayer operator must be aware of the susceptibility of the crop to the level of disease pressure to ensure timing is appropriate. While kickback and post-application distribution of pesticide residue is sometimes possible, sprayer operators should not rely on it. The following table outlines application recommendations for a fungicide commonly used in Ontario. It combines labelled information and provincial recommendations and is representative of most fungicides.

    Summer-fruiting and Fall-bearing Raspberry / Blackberry Highbush Blueberry Day-neutral and June-bearing Strawberry
    Labelled rate 2.5 kg/ha 2.25 kg in 1,000 L/ha2.75-4.25 kg in 1,000 L/ha
    Diseases (Labelled and Ontario provincial recommendations) Anthracnose fruit rot, Spur blight, Leaf spot, Botrytis grey mouldAnthracnose fruit rot, Shoot blight (Mummy berry), Botrytis twig and/or blossom blightCommon leaf spot, Botrytis grey mold
    Crop staging Bloom, Pre-harvest, HarvestFirst bloom, Fruit ripeningFlower bud, First bloom, 7-10 days after bloom, Pre-harvest, Through to fall
    As of 2016

    The spray target

    The applicator reading the recommendations should be considering the best way to get the fungicide to the target. But, what is the target, and what is the best way to apply it? It seems the recommendations raise as many questions as they answer:

    • With the possible exception of blueberry, this fungicide can be applied through much of the growing season (especially when it’s been a wet season). That means the crop staging is highly variable.
    • The primary target is blossoms, but depending on the disease, leaves and stems are also important.
    • The label states a volume of carrier (i.e. 1,000 L/ha) for strawberry and blueberry, but not the cane fruit. It does not specify highbush blueberry versus the sessile, ground cover variety.

    So, this means is the sprayer operator has to spray crops with highly variable physiology (e.g. bush, cane or sessile row crops), onto very different targets (e.g. leaves, canes, stems, flowers) throughout much of the season as the crop canopies grow and fill. This is a very challenging spray application. It would be wrong to suggest a single spray quality, water volume or sprayer set-up to efficiently accomplish all these goals (more on that later). The first consideration is the application equipment itself.

    The application equipment

    Berry growers employ a variety of sprayers to protect berries. Without considering models or optional features, there are three fundamentally different styles: Airblast, backpack and boom. According to the survey, the following table shows which sprayers are used in which berry crop in Ontario. Approximately 60 growers responded, and many grow more than one variety of berry and use more than one style of sprayer.

    Jacto airblast in raspberry
    Jacto airblast in raspberry
    Airblast SprayerBackpack or Wand SprayerVert. or Hor. Boom SprayerTotal
    Highbush blueberry 8109
    Day-neutral Strawberry 302124
    June-bearing Strawberry503237
    Raspberries & Blackberries211729
    Total37260

    So, generally, cane and bush berries are sprayed using airblast sprayers and strawberries using horizontal booms. The survey didn’t specify features such as air-assist on booms, or whether or not those booms are trailed or self-propelled. The type of, and features on, any given sprayer dictate the limits of what an operator can adjust to improve coverage.

    Water volume

    Respondents also reported on how much carrier (i.e. water) they used to spray fungicide on their crops. Given Canada’s propensity to report volumes in many different forms, I have converted all values into the most common units: L/ha, US g/ac and the dreaded L/ac:

    nL/ha ± std (max./min.) US g/ac ± std (max./min.) L/ac ± std (max./min.)
    Highbush Blueberries7534.2 ± 340.1 (1,000/150)57.1 ± 36.4  (106.9/16)216.2 ± 138 (404.7/60.7)
    Day-neutral Strawberries22418.5 ± 192.2 (1,000/224.5)44.7 ± 20.6 (106.9/24)169.4 ± 77.8 (404.7/90.8)
    June-bearing Strawberries33403.1 ± 235.1 (1,000/50)43.1 ± 25.1 (106.9/5.3)163.1 ± 95.1 (404.7/20.2)
    Raspberries & Blackberries27450.1 ± 279.4 (1,200/50)48.1 ± 29.9 (128.3/5.3)182.1 ± 113.1 (485.6/20.2)
    Trailed horizontal boom in strawberry
    Trailed horizontal boom in strawberry

    There appears to be a lot of variability in the volumes applied, but on the whole, very few are using the 1,000 l/ha indicated in the fungicide recommendations. The ~430 l/ha overall average is no surprise; labelled volumes are quite often higher than what sprayer operators use. In some cases, high label volumes are warranted because the product requires a “drench” application to totally saturate the target, or to penetrate very dense canopies. Conversely, a high label volume might reflect outdated practices if that label hasn’t kept up with current cropping methods or application technology. Sometimes label volumes are suspiciously large, round numbers that suggest they are intended to encompass a worst-case scenario (e.g. a large, unmanaged crop with high disease pressure and a less-than-accurate spray application). In the particular case of crops sprayed with an airblast sprayer, it is very difficult for a label to accurately predict an appropriate volume due to the variability in crop size, density and plant spacing. This has led to methods to interpret labels, such as crop-adapted spraying.

    The disparity between label language and grower practices is not entirely the fault of the label. Most sprayer operators don’t want to carry a lot of water because more refills prolong the spray day. In situations where the crop has reached a critical disease threshold, or bad weather has compressed the spray window, sprayer operators sometimes reduce the volumes in the belief that “getting something on” trumps “good coverage”. Perhaps that’s true, but insufficient volumes greatly reduce coverage. This can be further exacerbated when operators do not account for the increase in crop size and density over the season, or the impact of hot dry weather on droplet evaporation.

    Improving coverage

    So, is there an ideal sprayer set up and volume? As previously alluded, the variability in crop staging, crop morphology, target location and spray equipment make a single recommendation impossible. But that doesn’t mean there aren’t diagnostic tools and a few simple rules to help a sprayer operator determine a volume to suit their particular needs. Much can be accomplished with these three things:

    • Water-sensitive paper
    • A modest selection of nozzles and a nozzle catalogue
    • An open-minded sprayer operator willing to spend a little time and reconsider traditional practices
    Rule-of-thumb fungicide coverage on water-sensitive paper.
    Rule-of-thumb fungicide coverage on water-sensitive paper.

    Water-sensitive paper is placed in the canopy, oriented to represent the target (e.g. leaf, bloom, etc.). It is important to put multiple papers in at least three plants to ensure the coverage reflects a typical application. The paper changes colour when it’s sprayed and this provides valuable and immediate feedback. Did the spray go where it was supposed to go and did it distribute throughout the target? If so, then the operator now knows that they can safely focus on timing rather than targeting. If not, a little diagnosis is required:

    1. Were targets completely drenched? If so, there is too much coverage. Operators can drive faster (if possible, and as long as it doesn’t create drift), reduce operating pressure (if possible, and as long as the nozzle is still operating in the middle of its registered range), or change nozzles to lower rates (as long as spray quality is constant).

    2 .Were targets only partially covered, as if a leaf obstructed part of the target and created a shadow? This mutual-shading is the bane of spraying dense canopies. One possible solution lies in understanding droplet behaviour: Coarser sprays generally mean fewer droplets and they move in straight lines. Therefore, when they hit a target, they might splatter or run-off, but typically their journey is over. If the spray is too Coarse, a slightly Finer spray quality increases droplet counts and may help droplets navigate around obstacles and adhere to more surfaces. Sprays that are too Fine will not penetrate dense canopies without some form of air assist. They slow very quickly and tend to drift and evaporate before they get deep enough into a canopy to do any good. A Medium droplet size is a good compromise because it produces some Fines and some Coarser drops – the best of both worlds.

    Increasing volumes and reconsidering spray quality often helps, but there might be other options. If using air assist, there are tests that can confirm the air volume and direction are appropriate. Another solution might lie in canopy management (where pruning bushes and canes can help spray penetration immensely). Still another might lie in the use of adjuvants to improve droplet spread on the target.

    3. Were targets missed entirely, or coverage is consistent but sparse? The operator is likely not using enough water, and/or the spray quality is too fine. It has been demonstrated time and again that higher volumes improve coverage, but operators can try any of the options listed previously for partially-obstructed coverage. All the reasoning is the same.

    Conclusion

    Spraying fungicides effectively requires an attentive sprayer operator. Timing and product choice are very important, but when it is time to spray the sprayer operator should diagnose coverage with water-sensitive paper, and be willing to make changes to the sprayer set-up to reflect changing conditions. Thanks to the OBGA for sharing the survey data.

  • When is Fungicide Coverage Critical? Always!

    When is Fungicide Coverage Critical? Always!

    Introduction

    A local strawberry producer was just beginning his harvest when the entire field was suddenly stricken with anthracnose. He would have done almost anything to save it, but he could only watch in frustration as the disease quickly devastated his crop. While he was telling me this story, he was wringing his hands; I’m sure he didn’t realize he was doing it. It had been more than a month since the crop was lost and he was obviously still very upset. Let’s put on our deerstalker hats and consider what might have caused the trouble.

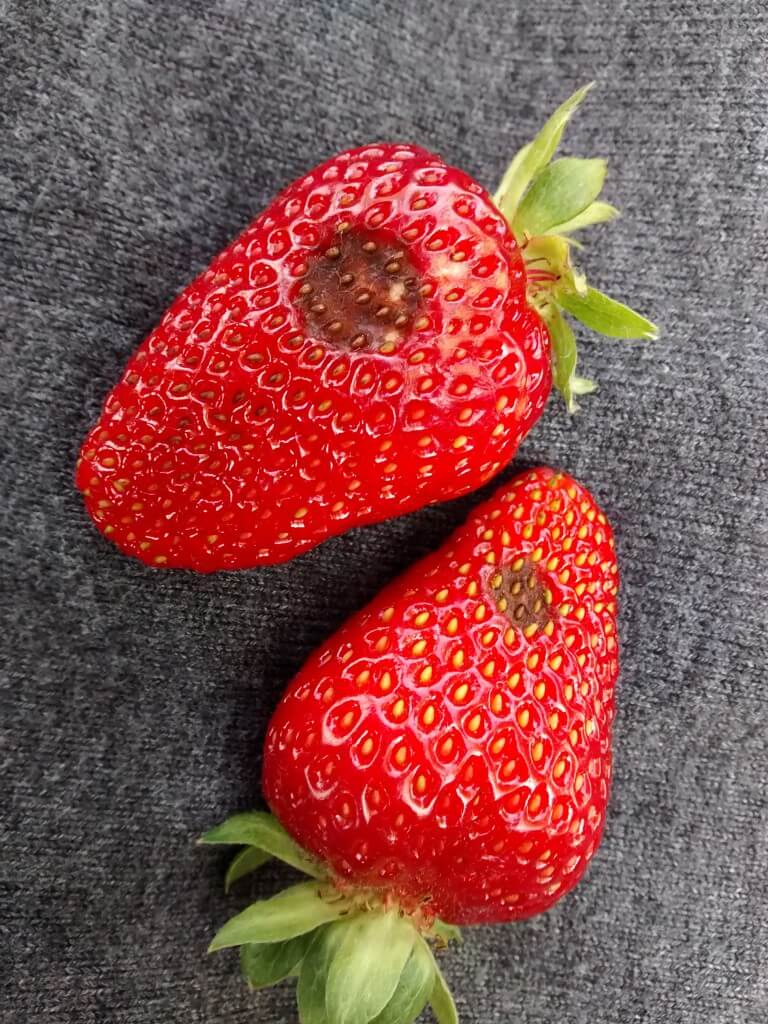
    Strawberry anthracnose. Photo by Pam Fisher, OMAFRA.
    Strawberry anthracnose. Photo by Pam Fisher, former berry specialist with OMAFRA.

    Most of the fungicides we apply in horticulture are protectants, not curatives. What that means is that the fungicide has to be in place before disease has a chance to take hold. Once it establishes a beachhead, you can typically only hold it at bay, not eradicate it. So, if you’re guilty of waiting too long between fungicide applications, the problems may have already begun. This is exacerbated when you don’t achieve the necessary spray coverage. Put the two together and mix in rainy and warm conditions and diseases like anthracnose can spread at alarming speed.

    Method

    I focus on the sprayer part of disease management, so I have to assume that inoculum is being controlled as much as possible (e.g. culling infected plants, drip irrigation, etc.). I asked the grower about his sprayer and his spraying schedule. He admitted to pushing the limits between fungicide applications, and being uncertain about the spray coverage he was achieving with his conventional flat fan nozzles.

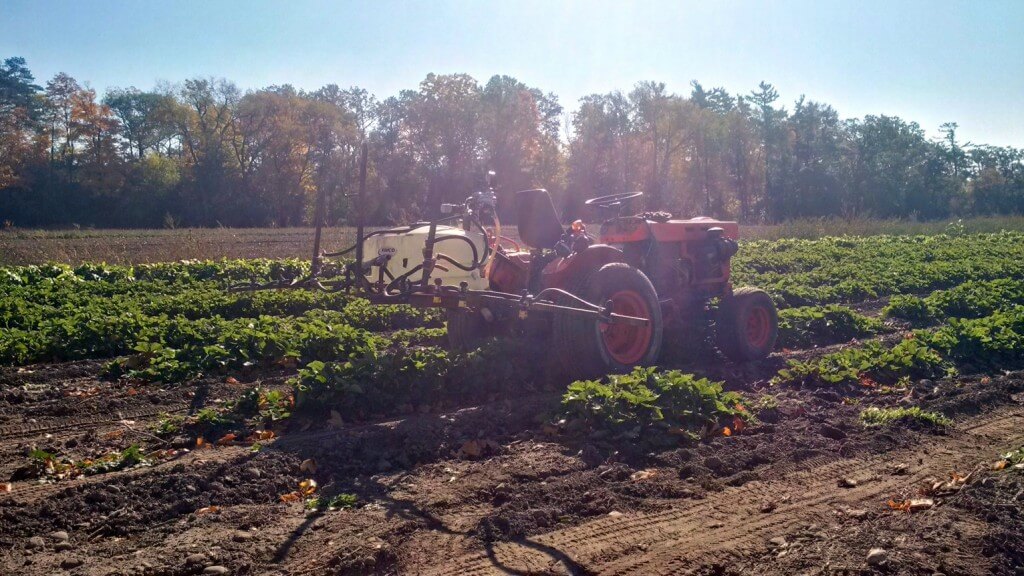
    Strawberry Sprayer
    Strawberry Sprayer

    In cases like this I try to find gentle ways of introducing the idea of using more water, increasing the frequency of applications, or buying new nozzles, because there is time and expense involved and many growers don’t want to hear that. However, when I started my soft sell routine, he looked me straight in the eye and said he’d lost tens of thousands of dollars in revenue so a few nozzles or a couple more applications were not a pressing concern. There’s a point in any endeavour when you’ve committed so much time and money that you’ll do pretty much anything to see it come to fruition (pun intended). He was willing to do whatever it took. This was my kind of guy.

    So, in preparation for next year, we diagnosed spray coverage from five different sprayer set ups. Let me point out, as I always do, that spray coverage analysis does not necessarily extend to control. They correlate well, but if you aren’t using the right product or your timing is off, even the best coverage won’t help you. Caveats aside, here’s what we tested:

    Setup1:

    Broadcast application using a horizontal boom with TeeJet Twinjet 8006’s at 8.3 bar (120 psi) on 50 cm (20 in) centres. We calculated a nozzle rate of 3.9 L/min (1.03 gpm), so at 5.0 km/h (3.1 mph) that’s 923 L/ha (98.7 g/ac).

    Setup 2:

    Banded application on a horizontal boom equipped with a row kits suspending three TeeJet XR 8002’s at 8.3 bar (120 psi). We angled the two side nozzles so the fans were not perpendicular or parallel with ground. This kept more spray on the raised row and out of the alleys. The swath covered 50 cm (18 in) and we calculated a nozzle rate of 1.29 L/min (0.34 gpm), so at 5.0 km/h (3.1 mph) that’s 1,016 L/ha (108.6 g/ac).

    Setup 3:

    Banded application on a horizontal boom equipped with a row kits suspending three TeeJet XR 8002’s at 6.2 bar (90 psi). We angled the two side nozzles so the fans were not perpendicular or parallel with ground. This kept more spray on the raised row and out of the alleys. The swath covered 50 cm (18 in) and we calculated a nozzle rate of 1.14 L/min (0.3 gpm), so at 5.0 km/h (3.1 mph) that’s 896 L/ha (95.8 g/ac).

    Setup 4:

    Broadcast application using a horizontal boom with TeeJet Twinjet 8004’s at 6.2 bar (90 psi) on 38 cm (15 in) centres. We calculated a nozzle rate of 2.27 L/min (0.6 gpm) so at 5.0 km/h (3.1 mph) that’s 717 L/ha (76.5 g/ac).

    Set up 5:

    Broadcast application using a horizontal boom with TeeJet Twinjet 8006’s at 6.2 bar (90 psi) on 38 cm (15 in) centres. We calculated a nozzle rate of 3.4 L/min (0.9 gpm) so at 5.0 km/h (3.1 mph) that’s 1,076 L/ha (115 g/ac).

    Protocol and Conditions

    It was late September, so the weather was a cool 8 °C, humidity was low and winds averaged 5 to 15 km/h. We timed our passes to correspond with lighter wind wherever possible. Three sets of water-sensitive paper were placed in a single row, but only one pass was made per sprayer setup. One paper was placed at the top of the canopy which is always very easy to hit, so we oriented it sensitive-face-down. The second paper was placed midway down the canopy, oriented facing up. The final paper was also oriented facing up, but placed at the very bottom of the canopy, more or less on the ground. Collectively, we spanned the depth of the canopy.

    Following each application, papers were collected for digital analysis using “DepositScan” which determines the percent of the paper covered with spray, and the droplet density. Both of these factors contribute to overall coverage. This wasn’t intended to be a rigorous experiment, so the means are presented here with standard error for the sake of comparison. There was no statistical analysis. In the case of papers located face-down, when only trace amounts of spray were discernible they were assigned a percent coverage of 1% and droplet density of 25 droplets/cm2.

    Results

    A few observations before we get to the results. Research has demonstrated that row kits and higher volumes improve spray coverage, and that’s why we tried banding the applications using row kits in Setups 2 and 3. However, this grower didn’t use GPS to plant his rows, and while they weren’t too crooked, they made it challenging to apply in a band. Further, there is some concern that a banded application would miss any inoculum in the alleys. These are important points to factor in when considering methods to control disease.

    The keen reader might notice we sprayed using pressures that exceed the manufacturer’s recommendations. In fact, none of these tips were rated over 60 psi and I used a formula to calculate their output at our high pressures. I have been heard to say (many times) never to exceed the manufacturer’s rates because it makes a mess out of the spray quality: droplets get much finer and pressure does not cause finer drops to penetrate a dense canopy. Better to switch to larger nozzles and stay within the pressures indicated on the manufacturer’s rate tables. I maintain that assertion. However, the grower was assured by fellow growers and custom applicators that this was the way to go and he wanted to try it. So, that’s where Setups 1, 4 and 5 came from.

    Be aware that a small sprayer like the one in this study needs considerable pump capacity to support such high pressure and flow to the boom and maintain effective agitation. For more information on pumps, check out this article.

    The following table expresses the coverage obtained by setup:

    Set upPaper PositionMean % Coverage (±SE)Mean Deposits/cm2 (±SE)
    Setup 1 – Broadcast XR 8006’s on 20” centres at 120 psi for 98.7 gpaTop1.0 ± 025.0 ± 0
    Middle23.6 ± 4.5253.5 ± 72.9
    Bottom15.2 ± 2.1423.2 ± 35.3
    Setup 2 – Three banded XR 8002’s at 120 psi for 108.6 gpaTop2.1 ± 1.178.9 ± 53.9
    Middle54.8 ± 12.1275.2 ± 145.3
    Bottom29.1 ± 2.7544.5 ± 70.4
    Setup 3 – Three banded XR 8002’s at 90 psi for 95.8 gpaTop7.4 ± 5.9134.4 ± 52.2
    Middle31.6 ± 15.9203.6 ± 108.5
    Bottom8.1 ± 3.9224.4 ± 102.3
    Setup 4 – Broadcast Twinjet 8004’s on 15” centres at 90 psi for 76.5 gpaTop1.0 ± 025.0 ± 0
    Middle33.3 ± 5.0240.7 ± 70.9
    Bottom12.9 ± 6.0263.9 ± 95.2
    Setup 5 – Broadcast Twinjet 8006’s on 15” centres at 90 psi for 115 gpaTop2.3 ± 1.3105.6 ± 80.6
    Middle48.9 ± 5.5194.3 ± 25.6
    Bottom19.5 ± 10.3246.8 ± 40.4

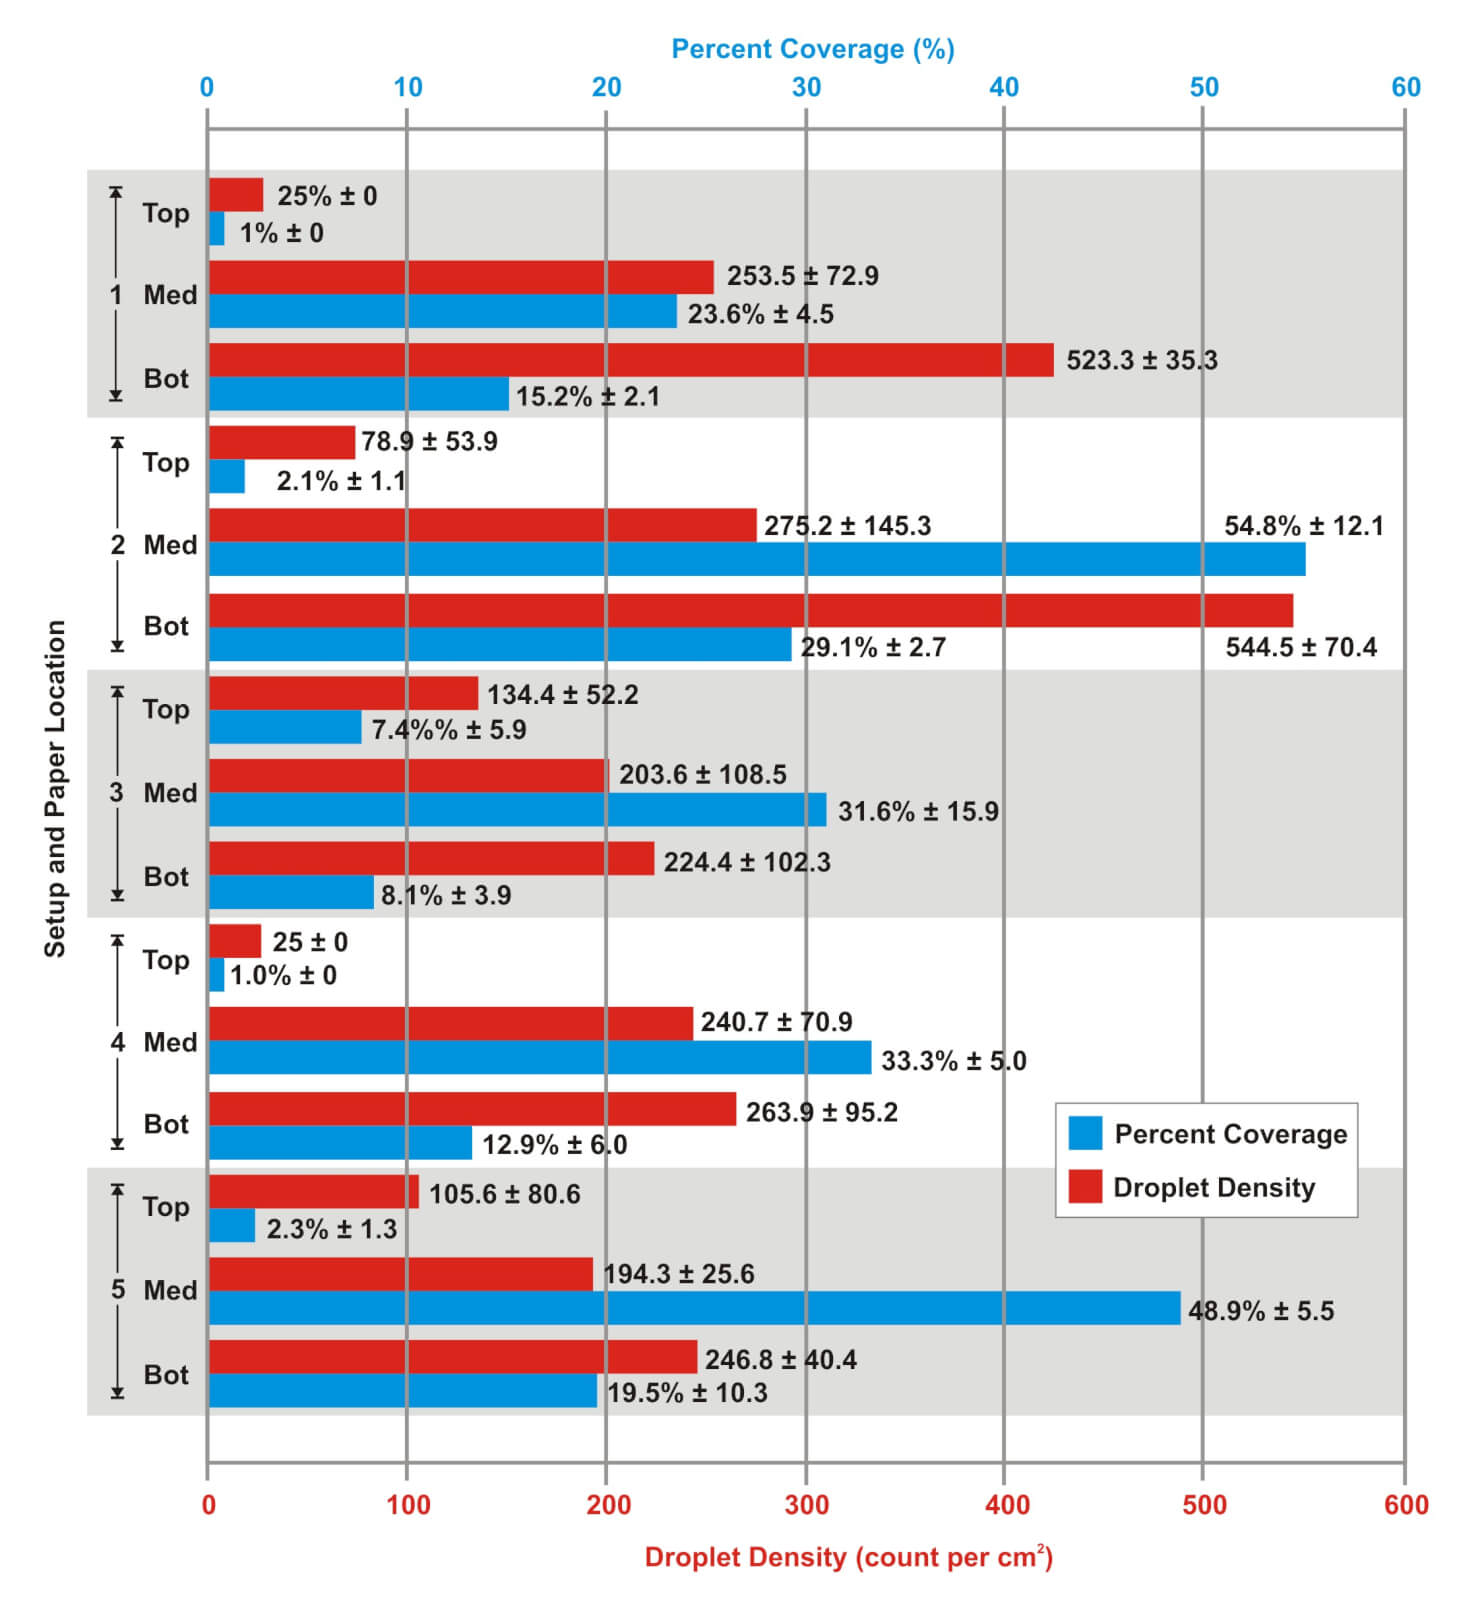
    The results may be easier to compare and contrast in the following graph.

    Strawberry coverage results for all five setups.
    Strawberry coverage results for all five setups.

    Observations

    According to the results, Setup 2 appeared to provide the best overall coverage. This is no surprise given that it was the second highest volume and employed a row kit. This corresponds with findings that have been published elsewhere. However, the excessively high pressure did create a lot of drift and the row kit didn’t always line up with the planted row. Further still, there’s the potential for missing anything that might harbour inoculum in the alleys, like runners. This setup wasn’t appropriate for this particular situation.

    The second-best overall coverage was obtained from Setup 5. This represented the highest volume, and a preferably lower pressure on twinjets, which may have allowed the spray to penetrate the canopy from multiple angles. This broadcast application is more reliable for hitting meandering rows and covers the alleys as well. So, the grower plans to employ this setup for the 2016 season, spraying at shorter intervals and confirming his coverage with water-sensitive paper. Let’s hope it works out.

    End-of-Season Update

    The grower that volunteered his time to this study has reported that his strawberries at the end of the 2016 season were absolutely beautiful. Granted, it is always difficult to draw a direct correlation between sprayer calibration and control. For example, 2016 was a very dry growing season and disease pressure was lower than in 2015. Nevertheless, spray coverage plays an important role in crop protection and our work to improve sprayer performance definitely played it’s part. His success is great news!