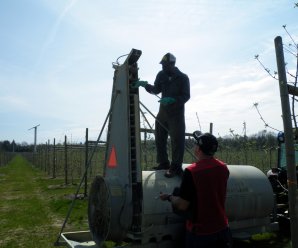
Category: Speciality Sprayers

Main category for all sprayers that are not horizontal booms

  • Airblast Towers are Worth Considering

    Airblast Towers are Worth Considering

    Are you considering shelling out for a tower extension for your airblast sprayer? Spray towers are an excellent investment, but they warrant special consideration. Towers move the air and nozzles closer to the target compared to the curved booms on a conventional airblast sprayer. When the distance-to-target is reduced, the odds of droplets reaching the target are improved. That means less pesticide drift and more deposit in the plant canopy.

    Be Aware: Nozzles need a minimal distance from the target to create an optimal spray pattern, so do not get too close.

    Many growers report savings when switching from conventional airblast to towers. The towers are more efficient at depositing the spray, so they have to reduce their typical sprayer volumes to prevent run-off. We worked with one apple grower that switched from a conventional sprayer to one with a tower. His lake-side orchard was plagued by wind, and his conventional sprayer had a relatively small fan diameter (~2 feet) that couldn’t compete. Traditionally, the grower used higher spray volumes to compensate. His new tower sprayer had a larger fan (~3 foot diameter) but perhaps equally import was that the tower reduced the distance-to-target. As a result, he was able to reduce his spray output by more than 200 L/ha while improving his overall coverage! That represented considerable cost savings and reduced environmental impact.

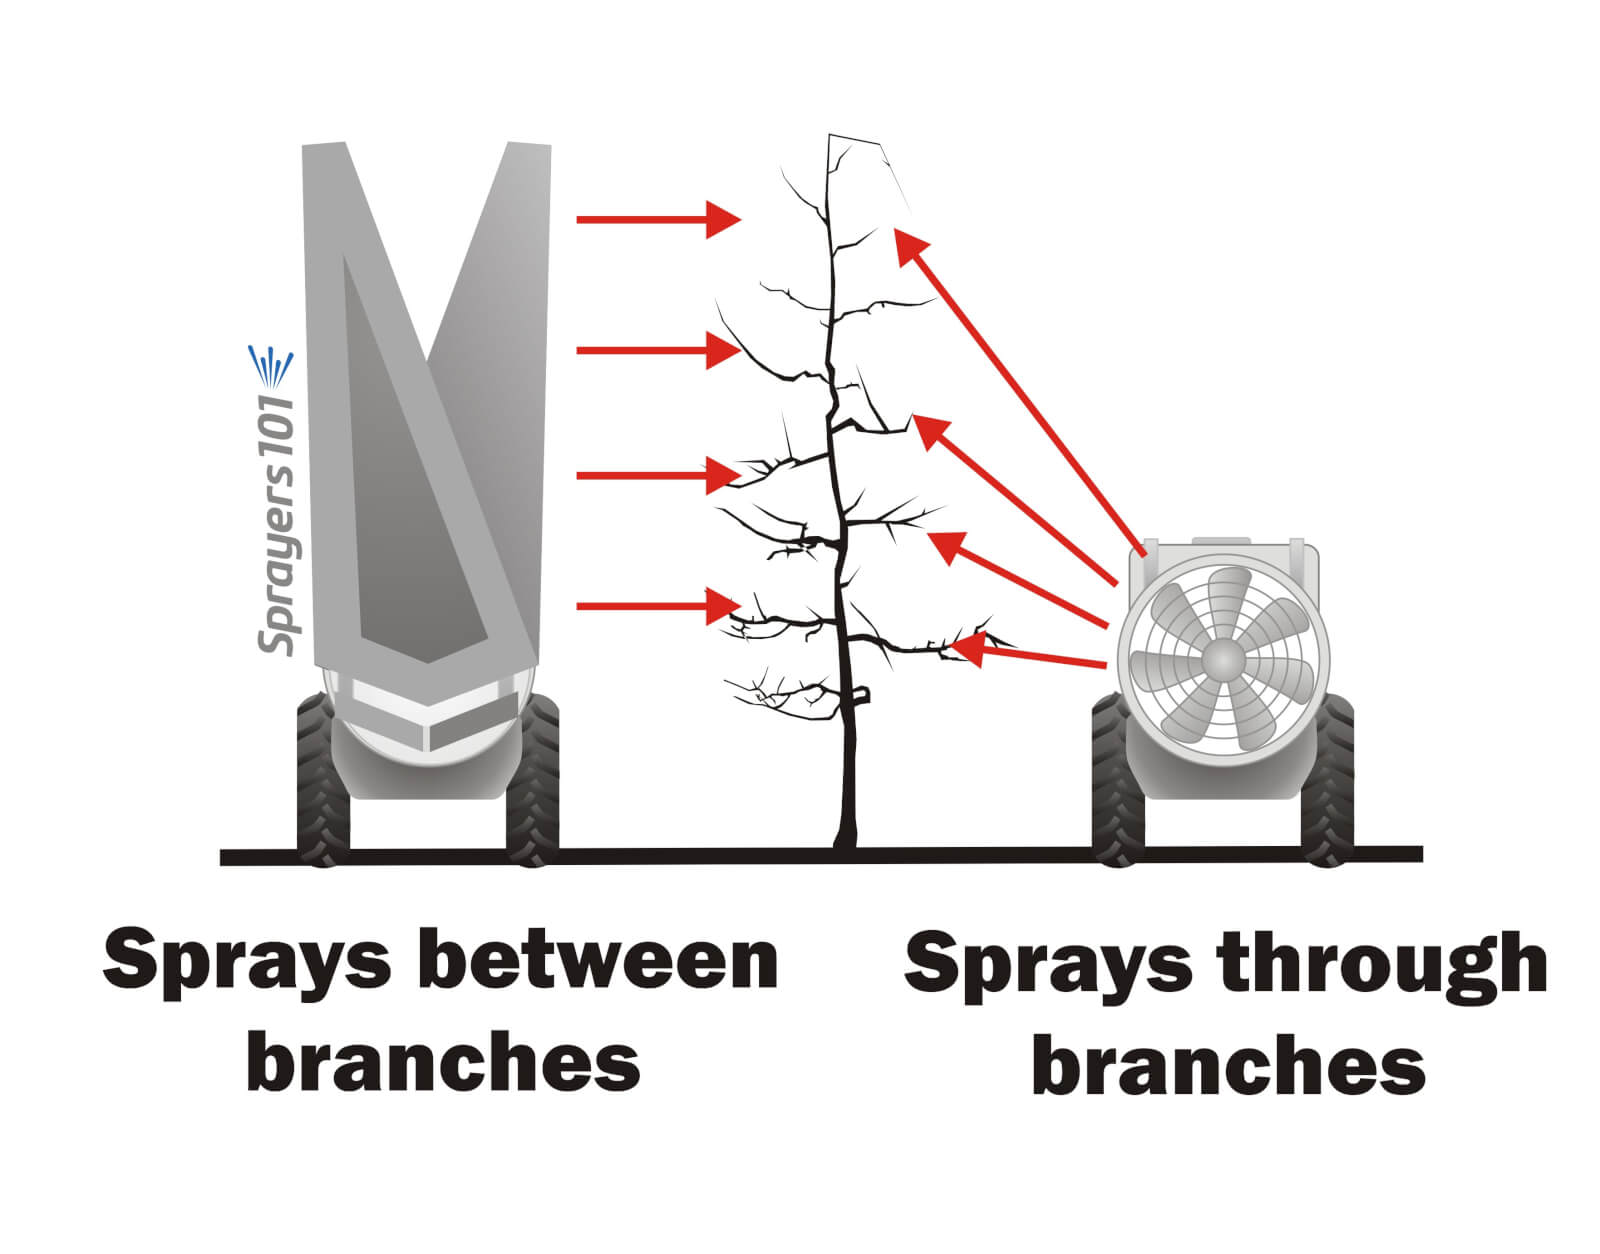
    Towers may provide better coverage than conventional sprayers in orchards with horizontal scaffolding. The tower sprays between branches, penetrating more easily, while the conventional sprayer has to spray through them. Concept from K. Blagborne, British Columbia.
    Towers may provide better coverage than conventional sprayers in orchards with horizontal scaffolding. The tower sprays between branches, penetrating more easily, while the conventional sprayer has to spray through them. Concept from K. Blagborne, British Columbia.

    While there are many benefits associated with towers, they are not suitable for all situations:

    • Towers must be taller than the highest target (e.g. treetop)
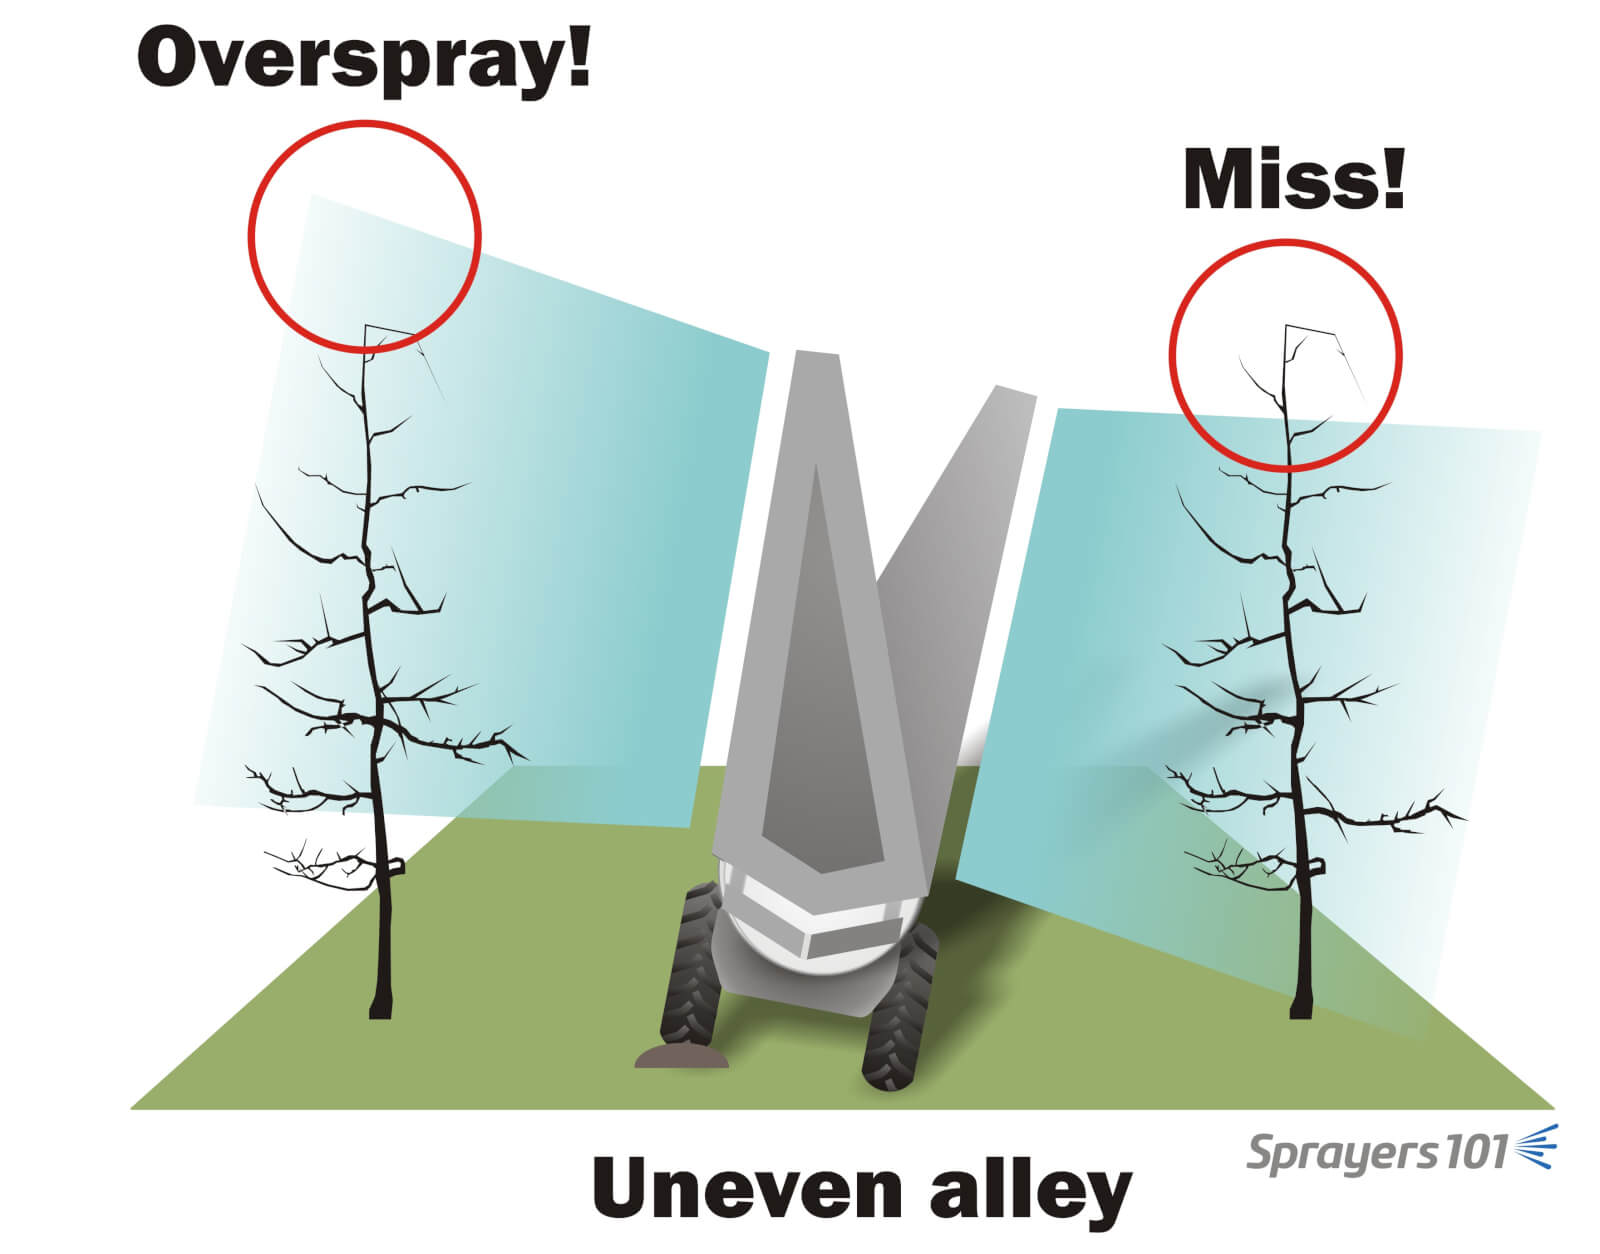
    • Towers should be used on level ground. Towers will roll on the vertical axis (i.e. tip left and right) on uneven ground, potentially missing or over-shooting targets
    • Towers must be able to clear netting, trellises, or an overhanging canopy.
    The perils of towers on uneven ground. For towers to be effective, the tower must be at least as tall as the target. When the target is only slightly higher than the tower, some sprayer operators install an additional nozzle body on the top deflector plate to extend the reach.
    The perils of towers on uneven ground. For towers to be effective, the tower must be at least as tall as the target. When the target is only slightly higher than the tower, some sprayer operators install an additional nozzle body on the top deflector plate to extend the reach.
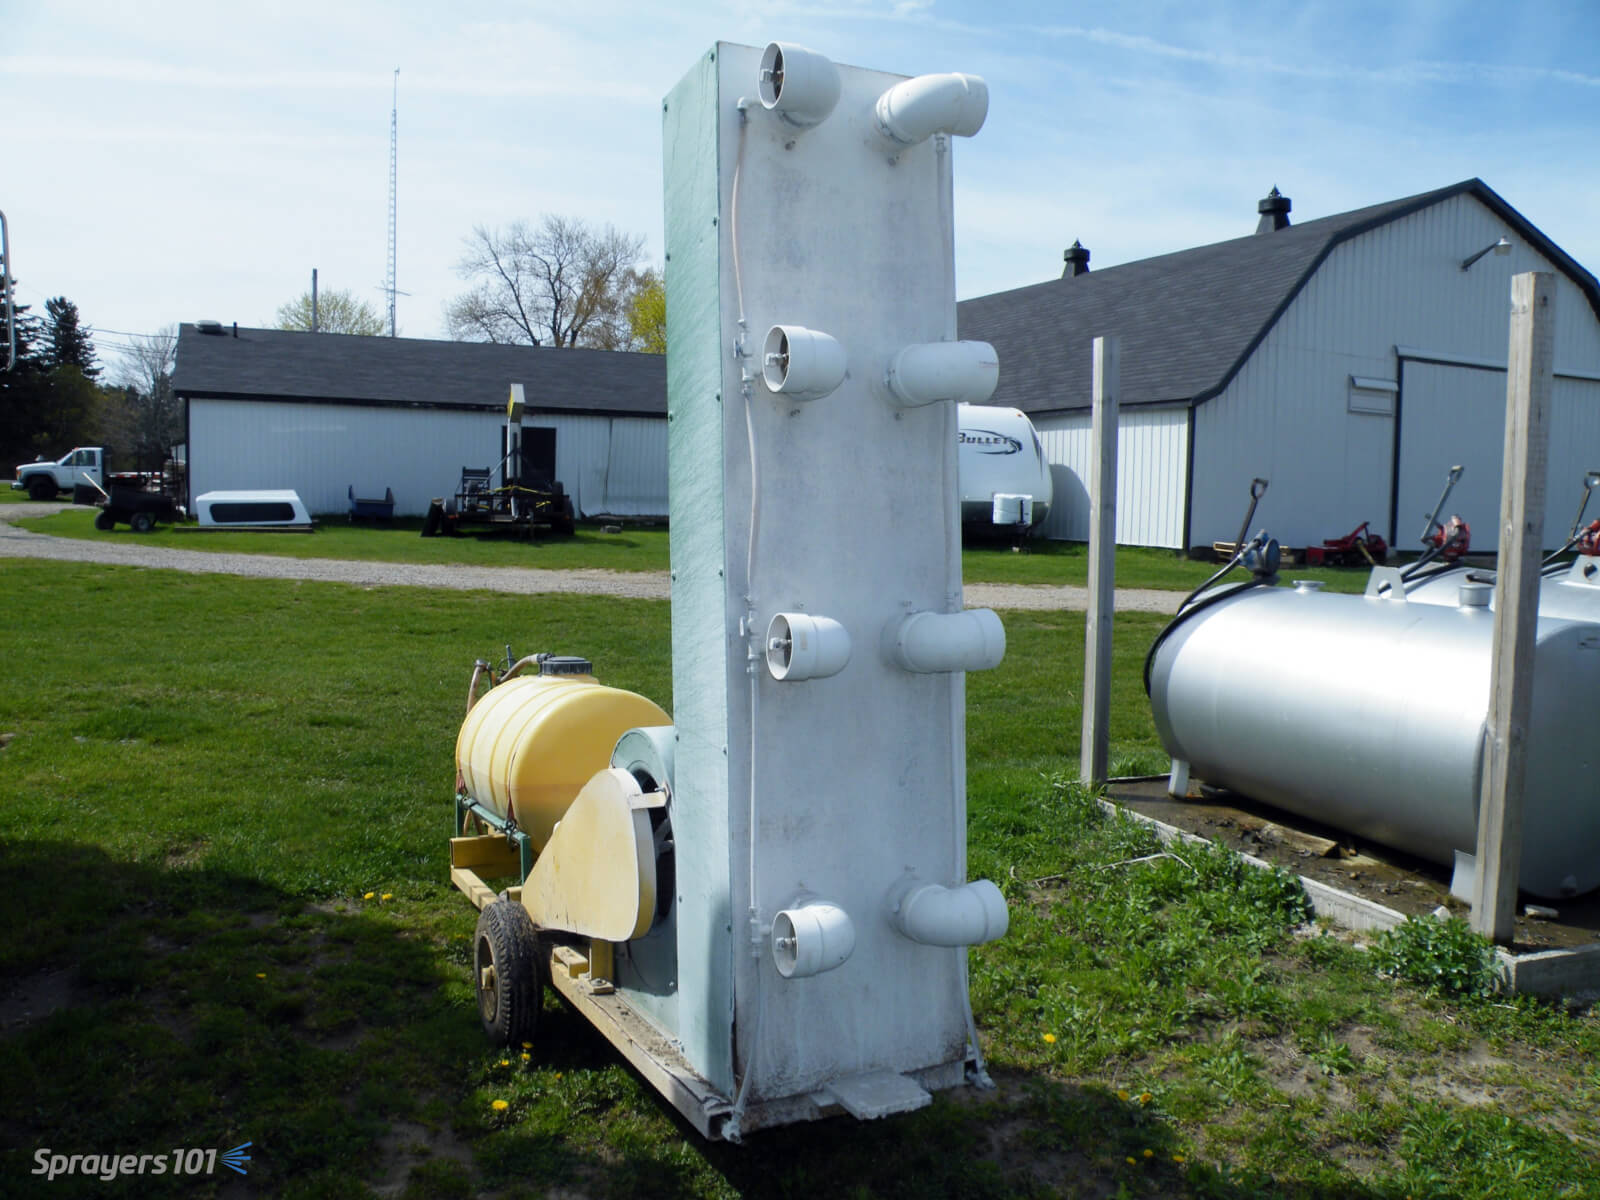
    A home-grown airblast sprayer with tower. PVC ducts, sheets of plastic, a squirrel cage blower and grower ingenuity. While it looks suspect, and difficult to clean, it reputedly works very well in highbush blueberries.
    A home-grown airblast sprayer with tower. PVC ducts, sheets of plastic, a squirrel cage blower and grower ingenuity. While it looks suspect, and difficult to clean, it reputedly works very well in highbush blueberries.

    Occasionally, we have discovered areas along tower outlets where there is reduced air flow. You can usually feel these “dead zones” with your hand (beware flying debris), but it’s better to observe short ribbons attached to the nozzle bodies as described in our articles about adjusting air direction and speed/volume. In low fan gear, watch to see if any ribbons flag or appear slack from a lack of air, you can “borrow” air by re-positioning neighbouring deflectors. If that’s not possible, try replacing the conventional nozzles in the dead zone with air induction nozzles; coverage should improve in that zone because pressure propels coarser droplets further than finer droplets. We’ve seen significant improvements using this technique in high density orchards.

    In the end, if a tower will fit in our operation, we suggest it’s a worthwhile investment that will make coverage more consistent, reduce off-target drift and possibly reduce the volume of spray needed per hectare.

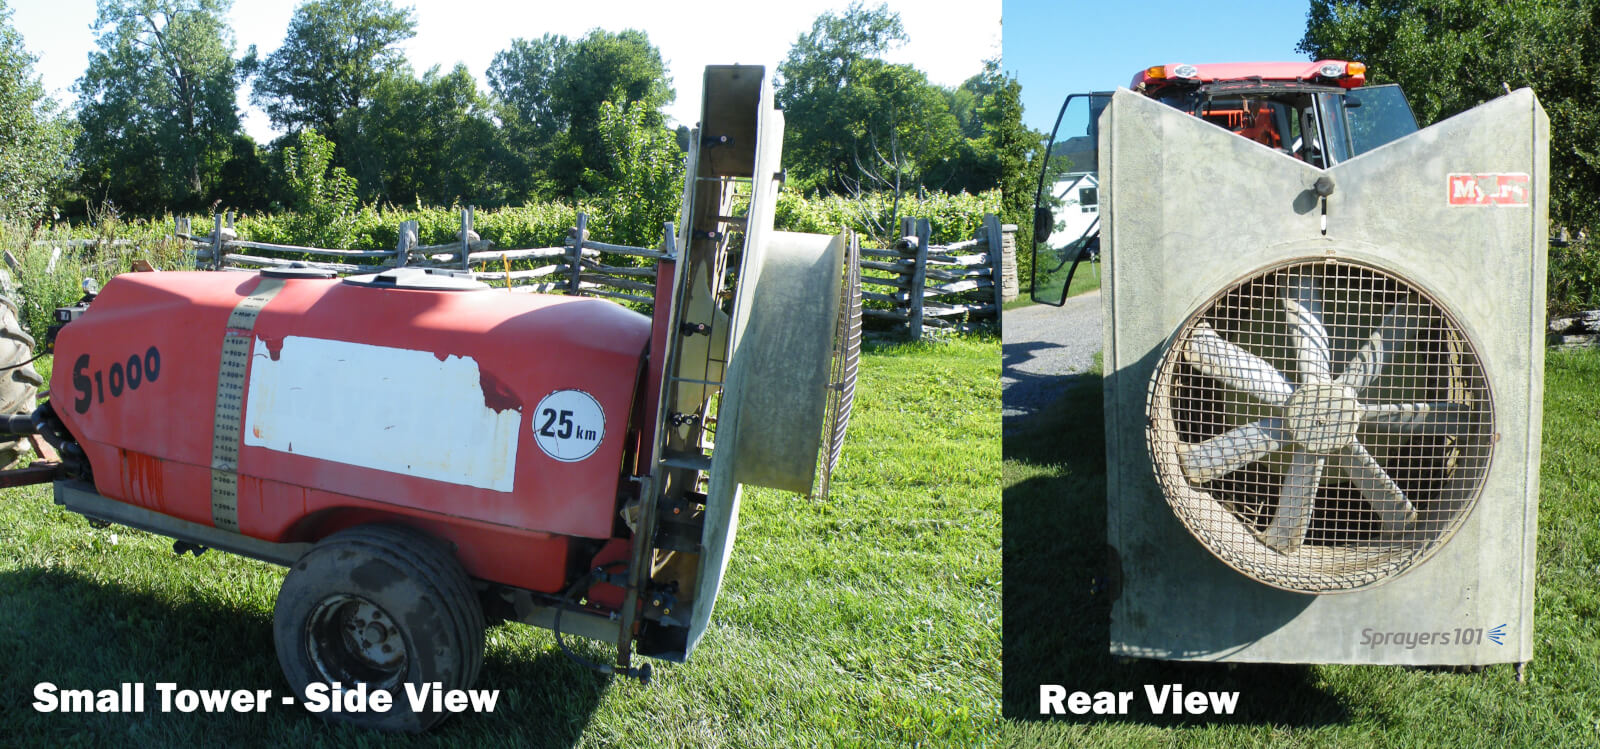
    Towers come in many shapes and sizes. Orchards aren’t the only good fit for towers; grapes, bushes and canes can also benefit from small towers.
    Towers come in many shapes and sizes. Orchards aren’t the only good fit for towers; grapes, bushes and canes can also benefit from small towers.
  • Nozzle Sizing and Calibration Charts

    Nozzle Sizing and Calibration Charts

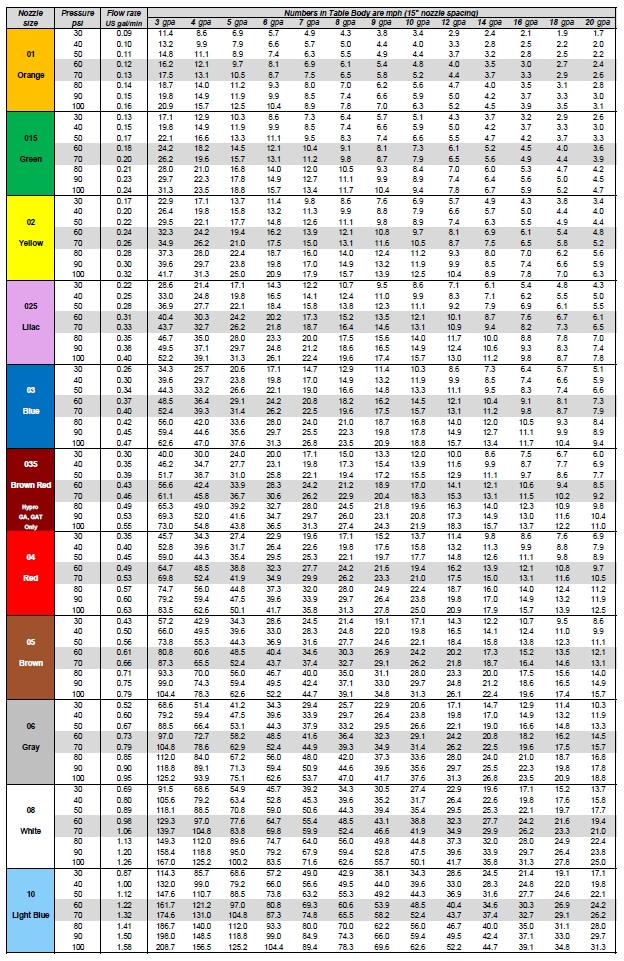
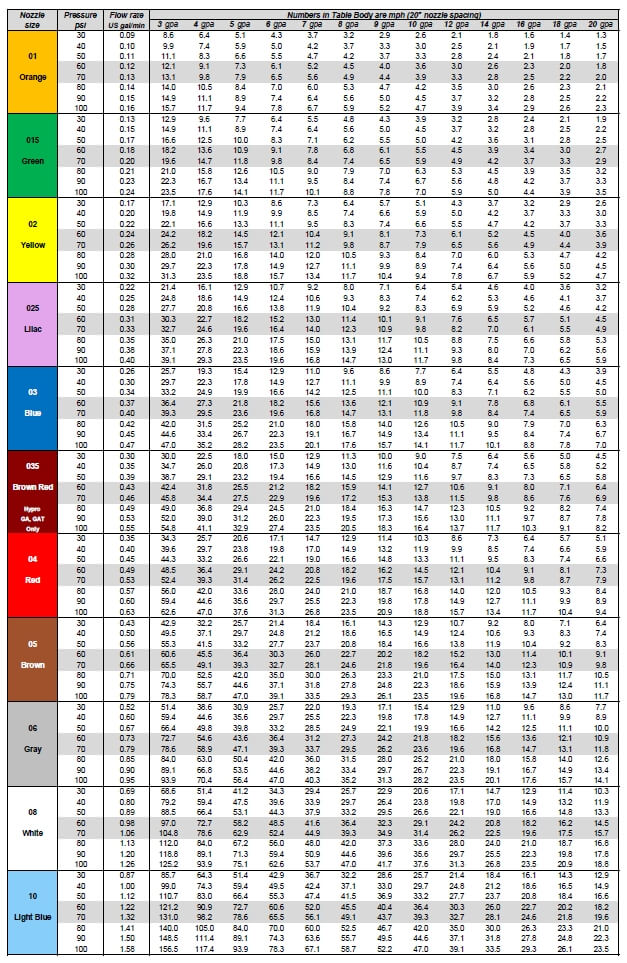
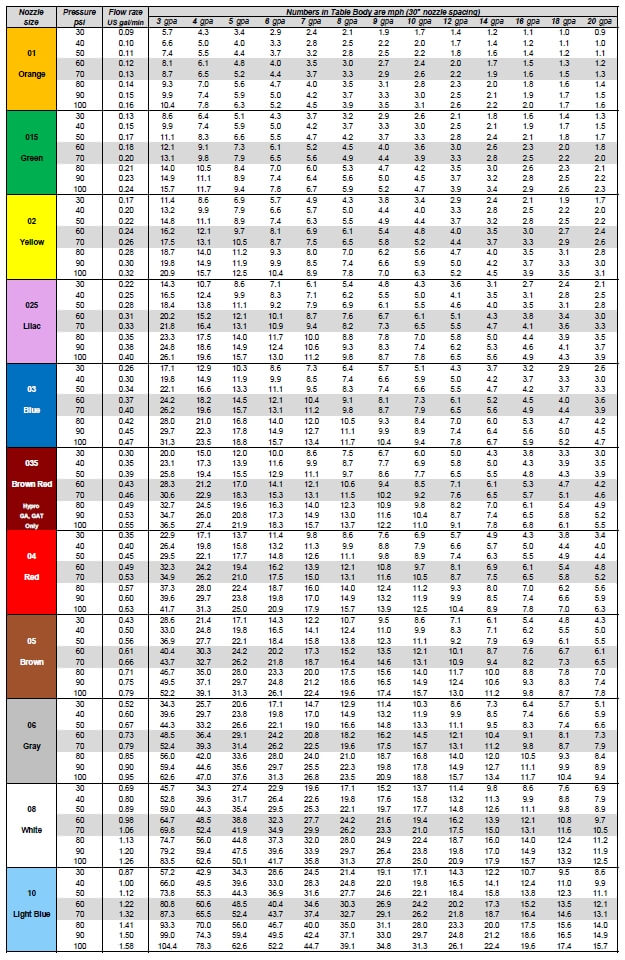
    Need to find the right nozzle size for your application?  Sometimes a simple chart is the easiest way to figure things out.  Print it and place it in your sprayer cab.

    In this chart, identify your water volume along the top row, and follow the column until you encounter the travel speeds you’re interested in.

    Once you’ve encountered your travel speed, move along the row to the left to identify the nozzle size and spray pressure.

    Make sure that your travel speeds are achieved at a pressure that’s right for the nozzle you’re using. For most air-induced nozzles, this will be about 60 to 70 psi (highlighted).

    Once you’ve decided on a nozzle size, the travel speed column for that size becomes the travel speed range at various pressures. Avoid operating a low-drift spray below 30 psi – its pattern will be too narrow and likely its spray quality will be too coarse for good results.

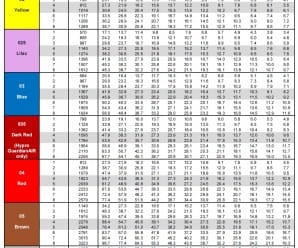
    Click on the images or text below to download a high quality pdf version of each chart, starting from the top with US, 15″ spacing, then US, 20″, then US 30″, then metric, 50 cm. Print, laminate, and place them in your sprayer cab.

    Calibration Chart (US, 15 in)

    Download Application Chart (US units, 15″ spacing)

    Calibration Chart (US, 20 in)

    Download Application Chart (US units, 20″ spacing)

    Calibration Chart (US, 30 in)

    Download Application Chart (US units, 30″ spacing)

    Application Chart 2015 (metric)

    Download Application Chart (metric, 50 cm spacing)

    Make your own chart using this Excel Template.

  • Diluting 20,000-Fold with a 30 Gallon Remaining Volume in a 1,200 Gallon Tank

    Diluting 20,000-Fold with a 30 Gallon Remaining Volume in a 1,200 Gallon Tank

    (This short article is an addendum to this article)

    Our goal in this example is to dilute by a factor of 20,000.

    The maximum amount of dilution possible with a 1,200 gallon tank and a 30 gallon remainder is 1200/30=40.

    The formulae:

    Dilution per Rinse = final dilution ^(1/# of rinses)

    Rinse Volume = (dilution per rinse * remaining volume) – remaining volume

    • One rinse diluting by 20,000 – impossible with a 1,200 gallon tank (max achievable is 40-fold);
    • Two sequential rinses, each diluting by a factor of 20,000^(1/2) = 141. Also impossible with a 1,200 gallon tank;
    • Three sequential rinses, each diluting by a factor of 20,000^(1/3) = 27. A volume of 780 gallons can do this  (27*30)-30=780 gallons. For three rinses, the total volume is 2,340 gallons.
    • Four sequential rinses, each diluting by a factor of 20,000^(1/4) = 12. A volume of 330 gallons can do this, for a total volume of 1,320 gallons;
    • Five sequential rinses, each diluting by a factor of 20,000^(1/5) = 7. A volume of 180 gallons can do this, for a total volume of 900 gallons;
    • Six sequential rinses, each diluting by a factor of 20,000^(1/6) = 5.2. A volume of 126 gallons can do this, for a total volume of 757 gallons.

    Second, let’s assume the operator is prepared to prime the boom where it doesn’t harm soybeans. Now the first new product tank takes care of the last dilution, lowering the cleanout dilution requirement by 1,200/30 = a factor of 40. Now the cleanout dilution requirement is only 20,000/40 = 500.

    • One 1,200 gallon tank rinse can only achieve 40-fold dilution.
    • Two rinses, each diluting by 500^(1/2) = 22. Rinse volumes of 640 gallons are sufficient, for a total of 1,280 gallons.
    • Three sequential rinses, each diluting by a factor of 500^(1/3) = 7.9. A volume of 210 gallons can do this, for a total volume of 630 gallons;
    • Four sequential rinses, each diluting by a factor of 500^(1/4) = 4.7. A volume of 112 gallons can do this, for a total volume of 448 gallons.
  • How Clean is Clean?

    How Clean is Clean?

    One of the more perplexing questions in tank cleanout is knowing when the cleaning process is good enough to prevent harm. This question is especially relevant to producers that grow canola and use Group 2 herbicide products, or grow soybeans and use dicamba on some of their area. In both of these examples, crops can be extremely sensitive to very small residues.

    When does an applicator know that the cleaning job was good enough? In about two weeks! There is no easy way to tell, except to be precautionary.

    A bit of math can help put us in the ballpark. First, we need to know the tolerance of a crop to the herbicide, preferably expressed as a proportion of the tank mix to be cleaned. Let’s use dicamba as an example. It’s been reported that non-dicamba tolerant soybeans can show leaf-cupping symptoms from dicamba at rates as low as 1/20,000 of the label rate.

    Recall that sprayer cleanout is really two separate processes that we’ve written about here, here, and here. The first is dilution of the remaining volume in the system. The second is decontaminating specific sprayer components (filters, boom ends, hoses). We’ll focus on dilution in this article.

    If you’re diluting, the second piece of information you need is how much liquid is left in the sprayer when you start cleaning. All sprayers have a certain amount of liquid left in the tank and associated plumbing after the tank is empty. The sump, the suction line feeding the pump, and the lines returning to the tank via agitation or sparge are most common. Even when the pump no longer draws liquid, those lines retain some volume of product. This volume can’t be pushed out to the boom, most of it goes back to the tank.

    The volume of this “remaining liquid” is likely somewhere between three and thirty US gallons.

    The remainder volume depends on the sprayer, and also how the tank is emptied. Some applicators simply spray until the solution pump pressure drops, others choose to drain the remaining liquid from a sump valve. When draining, product should be captured in pails rather than allowing it on the ground where it will harm the soil and possibly make its way into runoff.

    It’s always preferable to spray the tank empty in a field.

    As we’ll see below, a low remaining volume greatly improves the efficiency of the dilution process. It’s a sprayer feature that should be considered at purchase.

    The table below has some sample calculations. Note that the paired cases (1&2, 3&4, 6&7) all use the same total water volume, but compare a single vs triple rinse of three different remaining volumes.

    Comparing Case 1 to Case 3 or Case 6, (remaining volumes of 10, 20, and 50, respectively), it’s clear that minimizing the remaining volume is important.

    It’s also striking that the same amount of clean water, subdivided into three smaller repeat batches (Case 2, 4 and 7), is much more powerful than using single batches with the same total clean water amounts.

    Reducing the size of each batch even further and increasing the number of batches (Case 5) approaches what a properly executed continuous rinse can do.

    Is it necessary to dilute to the level that’s safe for the next crop? Not always. The next product in the tank acts to dilute the remainder once again, possibly by a factor of 100, depending on the remaining volume and the tank size (Case 8). The material in the boom, however, won’t be diluted by this additional volume, and therefore may harm the crop unless it is first sprayed out elsewhere, especially when section ends are not drained and rinsed.

    This is where a recirculating boom is valuable, providing an opportunity to charge the boom without spraying. The penalty is that the boom volume is then returned to the tank in the process, increasing the amount that needs to be diluted.

    Let’s return to the dicamba example with a 20,000-fold dilution requirement and a 1,200 gallon tank. We’ll consider two examples. In the first, the operator wants to prime the boom in the soybean field without any harm to the dicamba-susceptible beans. A 20,000-fold dilution is needed.

    We’ve looked at five options that each assume a remaining volume of 10 gallons. Note that our goal is the same – dilute by a factor of 20,000.

    The formulae:

    Dilution per Rinse = final dilution ^(1/# of rinses)

    Rinse Volume = (dilution per rinse * remaining volume) – remaining volume

    The maximum amount of dilution possible with a 1,200 gallon tank and a 10 gallon remainder is 120 (see Row 8, Table above).

    • One rinse diluting by 20,000 – impossible with a 1,200 gallon tank (max achievable is 120-fold);
    • Two sequential rinses each diluting by a factor of 20,000^(1/2) = 141. Also impossible with a 1,200 gallon tank;
    • Three sequential rinses, each diluting by a factor of 20,000^(1/3) = 27. A volume of 260 gallons can do this  (27*10)-10=260 gallons. For three rinses, the total volume is 780 gallons.
    • Four sequential rinses, each diluting by a factor of 20,000^(1/4) = 12. A volume of 110 gallons can do this, for a total volume of 440 gallons;
    • Five sequential rinses, each diluting by a factor of 20,000^(1/5) = 7. A volume of 60 gallons can do this, for a total volume of 300 gallons.

    The first two examples don’t work because the tank isn’t big enough. But the three remaining examples all work equally well, they just consume different amounts of clean water.

    If that doesn’t seem like a lot of work, then repeat this calculation with a 30 gallon remainder volume, common on many sprayers. Short on time? We did it for you here.

    Second, let’s assume the operator is prepared to prime the boom where it doesn’t harm soybeans. Now the first new product tank takes care of the last dilution, lowering the cleanout dilution requirement by 1,200/10 = a factor of 120. Now the cleanout dilution requirement is only 20,000/120 = 166.

    • One 1,200 gallon tank rinse can only achieve 120-fold dilution.
    • Two rinses, each diluting by 166^(1/2) = 13. Rinse volumes of 120 gallons are sufficient, for a total of 240 gallons.
    • Three sequential rinses, each diluting by a factor of 166^(1/3) = 6. A volume of 50 gallons can do this, for a total volume of 150 gallons.

    The math is simple, and can be done using the formula in the first table, or this app:

    The hard part is knowing what the remaining volume is. It would be very useful for a manufacturer to provide this information.

    In the meantime, you can estimate on your own. Add water with surfactant to your tank, and spray it empty. While spraying, turn the agitation on and off to fill and activate the sparge, if equipped. Once the tank is empty and the spray pressure drops, stop and drain the sump into pails. Ensure that the pump suction line and the pressure line up to and including the agitation and sparge lines also drain. Disconnect these if necessary. If there is a filter housing in this circuit, remove it as well.  Avoid collecting liquid from the pressure line beyond where the the agitation or sparge split off, as this will be pushed out to the boom.

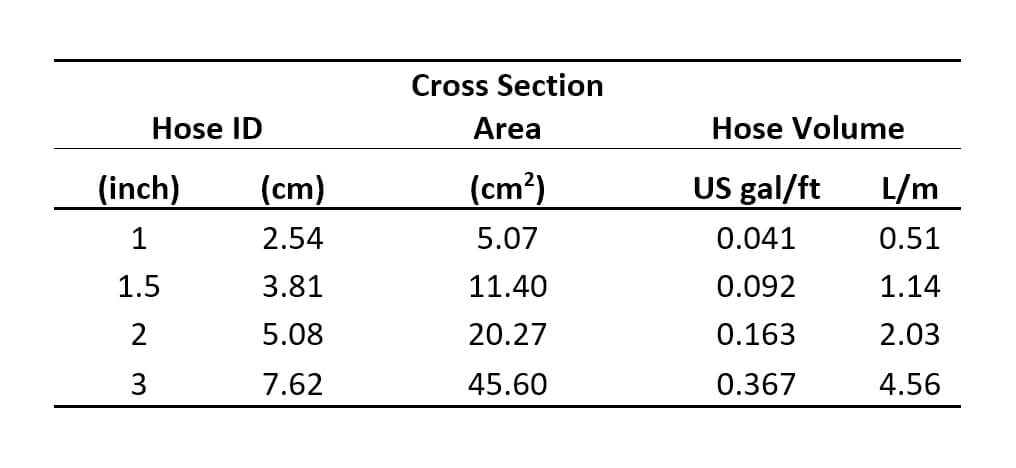
    An alternative is to estimate the length of hose in this circuit, using the following table as a guide:

    And remember, diluting the remaining liquid is only one part of a cleaning process.
  • Application Recordkeeping: Focus on Environmental Conditions

    Application Recordkeeping: Focus on Environmental Conditions

    Note: This article was written by Bob Wolf of Wolf Consulting and Research, and first appeared as an NDSU Extension Service publication. Bob has agreed to reproduce the article on our website.

    When applying crop protection products, a good steward is one who can identify and record the environmental factors that may negatively impact making an application; particularly, the possibility of spray drift.

    New label language states: “Avoiding spray drift at the application site is the responsibility of the applicator.” A wise sprayer operator must possess the ability to assess the environmental conditions at the field location to determine how best to spray the field, or maybe decide it would be best not to spray that field, or part of that field, at that time. Instruments that assess environmental conditions are available to assist applicators in making good decisions.

    Making the correct measurement is the critical first step. Record the information measured to document the application conditions. Quality records help mitigate against any misapplication allegations, such as a drift complaint. Many of the items listed below are based on past legal experiences with applications involving spray drift litigation.

    The following guidelines should help you measure and accurately record environmental conditions at the application site.

    1- Document any instrument used by recording the manufacturer and model number. Accurate portable weather instruments are recommended. Portable weather instruments are available that log and store data, and aid in auditing and recordkeeping. Some will have Bluetooth/wireless capabilities.

    2- Environmental measurements include wind speed and direction, temperature, and relative humidity.

    3- At a minimum, record data at the start and finish of the job. Consider more often as conditions change or for a job that lasts over a longer period. For example, make observations when tank refilling for larger fields. Time stamp all observations with a.m., p.m., or military time.

    4- Take meteorological readings as close to the application site as possible. Be advised that the weather data received via a smart phone or local weather station may not be accurate for the location being sprayed.

    Note the specific location where the measurement was made, such as GPS coordinates, field entry point, field location, etc. Check the label to see if it requires a specific observation location in relation to the treatment area.

    5- Make all measurements as close as possible to the nozzle release height (boom height) and in an area not protected from the wind by the spray machine or your body. For aerial applications, six feet is suggested when using a hand held instrument.

    6- Record wind speed averaged over a 1 to 2 minute time span. Note the time the observation was recorded. Most instruments give an average over a period of time. Make sure the instrument’s anemometer is facing directly into the wind.

    Do not record winds as variable or with a range i.e. 4 to 8 mph – an average gives a better indication of the transport energy. Light and variable winds, where directions may change several times over a short period, can be more problematic than higher speed winds in a sustained direction. Observe any label restrictions on wind speed.

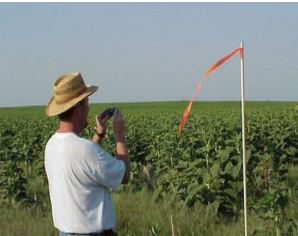
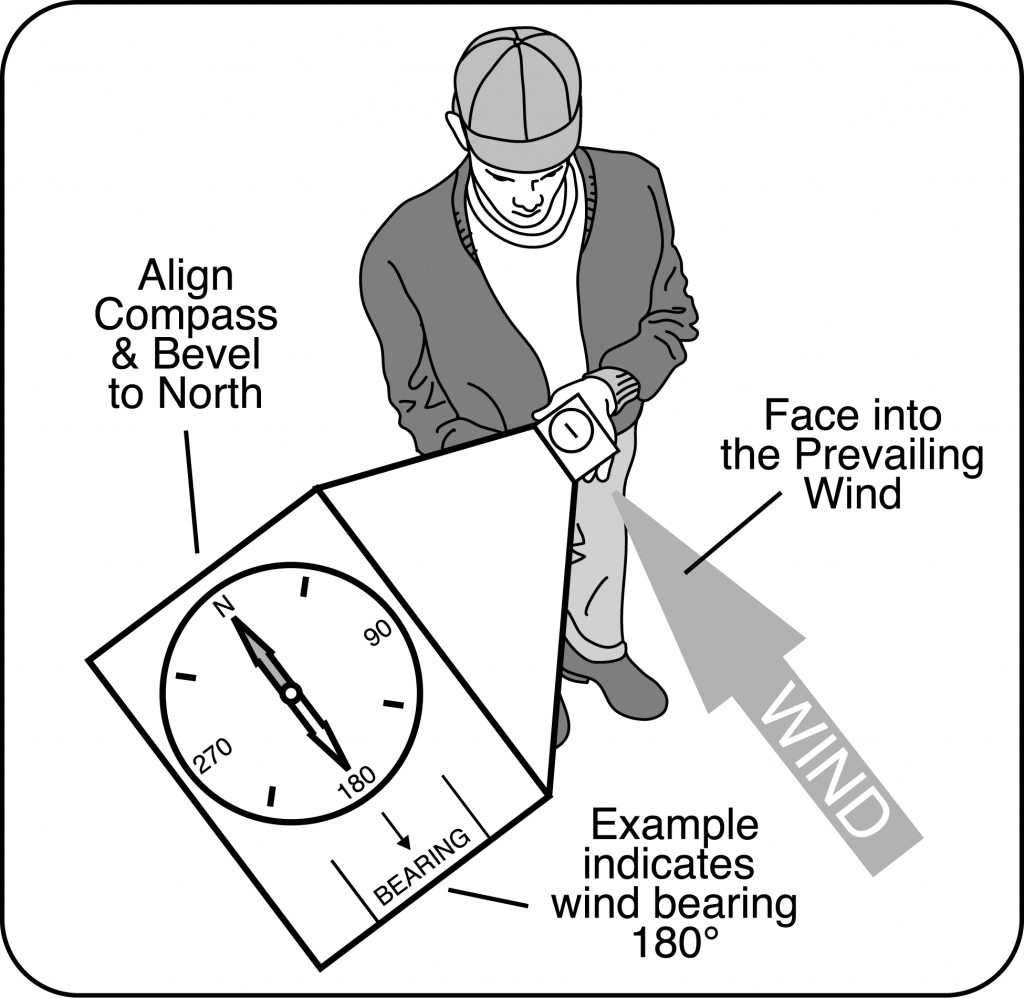
    Wind direction requires a similar averaged measurement. Record direction in degrees magnetic from a compass (0-360°). The use of alphabetic characters, i.e., N, S, NW, to indicate wind direction is discouraged. The key for determining direction is to have an accurate assessment method: trees moving, dust, smoke, a ribbon on a short stake, etc. Face directly into the wind and record the direction from which the wind is coming. A ribbon on a stake with the ribbon blowing directly at your body is a simple fail safe approach. Movement of smoke, particularly from moving aircraft, or dust may help determine direction.

    7- Record temperature and humidity since they can be helpful in determining temperature inversion potential. It may be advisable to record both temperature and humidity well before and after the application for this purpose. In fact, recording a morning low and an afternoon high would be useful regarding determining the potential for an inversion. Take temperature measurements with the instrument out of direct sunlight. Shade the instrument with your body or spray equipment. This is especially critical if you are trying to assess temperature differentials for determining if an inversion is in place.

    8- Be alert to field level temperature inversion conditions which typically occur from late afternoon, can be sustained through the night, and into the next morning. Beware, inversions can start mid-afternoon. Observe conditions such as the presence of ground fog, smoke layers hanging parallel to the ground, dust hanging over the field/gravel road, heavy dew, frost, or intense odors (i.e., smells from manure or stagnant water from ponds are held close to the surface when inversion conditions exist). Inversions commonly occur with low (less than 3 mph) to no wind speeds. Spraying in calm air is not advised. If a mechanical smoker is used note wind direction and smoke dissipation with a time stamp.

    9- Note any variances due to terrain or vegetation differences, tree lines, buildings, etc.

    10- Initial or sign all recordings to indicate who made the observation(s).