Tag: coverage

  • Assessing Water Sensitive Paper – Part 3

    Assessing Water Sensitive Paper – Part 3

    This is the final part of our three-part article discussing methods for digitizing and processing water sensitive paper. You can read part one here and part two here.

    Morphological operations

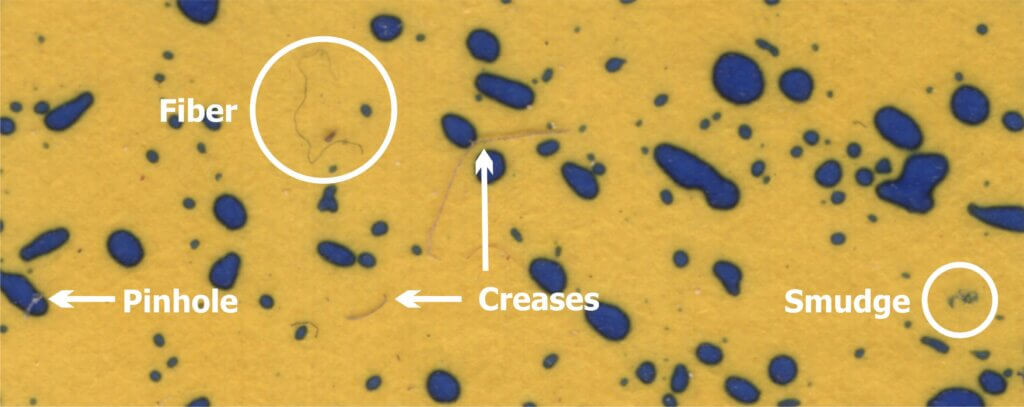
    We can now move on to the larger shapes, or “morphology” of the objects in our binary image. Our goal is to quantify deposits by interpreting these shapes. Once again, these operations are powerful processing tools, but we must acknowledge three overriding limitations:

    1. Inconsistent stains

    Sometimes deposits do not create a consistent blue colour – they can get lighter or take on a greenish-yellow hue towards the perimeter of the stain. During thresholding, the outer edge can be accidently eroded, leaving behind an object with a jagged edge. This may lead us to underestimate the percent area actually covered. In the case of tiny stains, it might eliminate them entirely and lead us to underestimate deposit density.

    2. Overlaps

    It can be difficult to determine if an object represents a stain from a single droplet or is the result of multiple, overlapping deposits. This becomes significant when the surface of the WSP exceeds ~20% total coverage. The resulting objects may or may not have hollow centres where droplets do not overlap entirely. Misidentifying overlaps leads us to falsely conclude that an object is the result of a single, coarser droplet rather than multiple finer droplets.

    3. Ellipses

    Non-circular stains are formed when droplets scuff along the surface. Two droplets with the same volume encountering a paper at different angles can create stains with significantly different areas. We may wrongly conclude that the droplets that created them were coarser than they truly were. One approach is to use Feret’s Diameter (aka Caliper Diameter) by measuring the widest spans on the X and Y axes and taking the average. Another approach is to interpret the ellipse as a series of circular stains. Or we can decide to only acknowledge these objects when calculating percent area covered, but omit them when calculating deposit density or predicting original droplet size. Each strategy is a compromise, so it is important to be consistent and transparent when reporting results.

    Three common problems when analysing water sensitive paper.

    We’ll explore two morphological operations that can help us separate fact from fiction: Granulometry and Dilation-and-Erosion. We’re introducing these operations as part of the processing and detection step, but they may also overlap with the measurement step in our three-step process.

    Granulometry

    We can estimate the range of object sizes and get a sense of how they are distributed on the paper by filtering or “sieving” the image. Imagine pouring a mixture of sand and rocks through a series of ever-finer sieves. Doing so allows you to separate particles based on size exclusion. A granulometry function compares each object to a series of standardized objects with decreasing diameters. This isolates objects of a similar size and bins them in that size range. This is a powerful operation, but accuracy is lost when stains overlap to form larger objects. In this case, we move on to Dilation and Erosion.

    Dilation and Erosion

    Think of dilation as adding pixels to the boundary of an object. This makes tiny objects bigger, fills in any interior holes and can cause objects to merge. The number of pixel-wide dilations required to make objects contact one another can be used as a measure of deposit density.

    Erosion removes pixels from the outer (and sometimes inner) boundaries of an object. This eliminates tiny artifacts that may not actually represent stains. It can also split non-circular objects into multiple parts before shrinking them into multiple nuclei (aka centroids). These last-remaining points are not necessarily the centre of a stain, but the pixels furthest away from the original boundary.

    When a non-circular shape has more than one nucleus, they likely represent individual droplets that combined to form the larger stain. We can then use these nuclei to measure deposit density, such as in a Voronoi partition which triangulates each nucleus in relation to the two closest neighbours.

    Many image processers use both these operations sequentially. When an image is eroded and then dilated (a process called “Opening”), smaller objects are removed, leaving the area and shape of remaining objects relatively intact. Dilating and then eroding (a process called “Closing”) fills in small holes and merges smaller objects, once again leaving the area and shape of remaining objects relatively intact. We can use both of these functions to help smooth an image prior to measurement.

    (Top) Opening operations erode and then dilate the image. Moving left to right, the smaller objects tend to disappear. (Bottom) Closing operations dilate and then erode the image. Moving left to right, smaller objects either disappear or merge and holes are filled in

    Distance Transformations

    Distance transformations are advanced operations specifically used to separate objects that are densely packed. While not typically used when analyzing WSP, distance transformations are another means of identifying object nuclei. They are another means for teasing apart objects that are likely the result of overlapping deposits and then mapping their relative sizes and positions.

    Measurement

    The calculation of the area covered by deposits is straightforward. The pixels belonging to objects (the deposits) and those belonging to background are summed and then the fraction is converted to percent area covered. Research has shown that the image resolution does not significantly impact percent coverage assessments and has suggested that all image analysis software tends to produce similar results (+/- 3.5% observed when the same threshold was applied to multiple papers). This is acceptable because it’s within the variability inherent to spraying.

    We ran a similar experiment wherein we analyzed the same piece of WSP using four methods. Here are a few facts about the software we used:

    • DropScope produces images between 2,100 and 2,300 DPI. Currently, it ignores ellipses and doesn’t count anything spanning less than ~35 µm (3 pixels).
    • We set ImageJ to ignore any object spanning less than 3 pixels, which at 2,400 DPI was 30 µm in diameter.
    • Snapcard was a free app created by Australia’s GRDC. It was benchmarked using ImageJ, tended to underestimate coverage and was fairly inconsistent. Nevertheless, it was convenient for field work. Instances may still exist, but as of 2025 it no longer available through the GRDC.

    The images shown in the figure below were cropped from screenshots produced by each method. The actual ROI analyzed was ~3 cm2 for SnapCard, 3.68 cm2 for DropScope and 2.0 cm2 for both Epson/ImageJ methods. Our results indicate an +/- 4% difference in percent area coverage. This variability reflects the results of a 2016 journal article that compared SnapCard with ImageJ and other leading analytical software. That study claimed no statistically significant difference in percent coverage detected (standard deviations were about 20%). However, the ImageJ results tended to trend several percent higher than SnapCard. We saw this as well. And so, while resolution may not have a significant impact on percent area covered, there does appear to be some correlation.
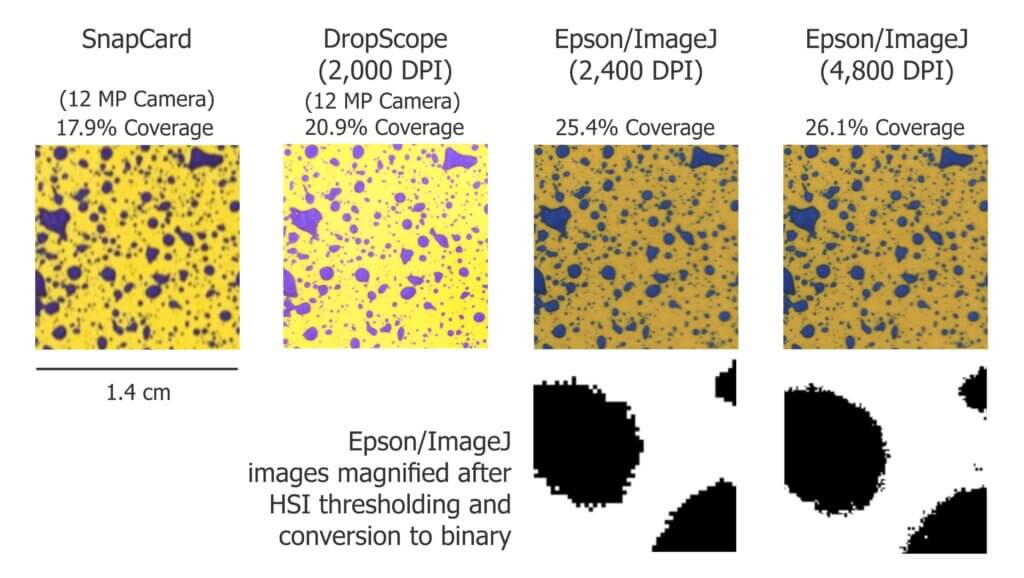
    Percent area covered as reported by three image analysis systems. Only a minor difference was observed when resolution was doubled using the Epson/ImageJ method.

    Resolution definitely affects deposit counts. Particularly in applications that employ finer droplets. Consider the difference between detecting or missing 1,000 30 µm diameter objects. It may only amount to a fraction of a percentage of the surface covered, but +/- 1,000 objects on a 2 cm2 area is significant in terms of deposit density.

    Output

    Once a WSP image (or set of images) has been scanned, pre-processed, processed and measured, we will receive some manner of output. Some software packages create an attractive report with images, graphs and key values. These reports include percent coverage and many provide droplet density. Deposits may be binned by size, or spread factors are used to calculate the original droplet diameters and even estimate the volume applied by area. Other software packages provide raw data that can be imported into a statistical program or spreadsheet program like Excel for further analysis. Some software packages provide both.

    How far can we take this?

    Blow-by-blow data analysis is beyond the scope of this document, but how much weight should we give to coverage data obtained using WSP? The answer depends on the metric in question, but in all cases we must first acknowledge the three overriding caveats. Take it as said that they apply to everything that follows:

    1. Different brands (and even different production runs) of WSP can produce significantly different coverage metrics. When conducting experiments, use a single brand of WSP. Better still, use papers from the same production batch whenever possible.
    2. The same of piece of sprayed WSP can produce significantly different results depending on the software and protocol used to analyze it. When conducting experiments, use the same software and assessment protocol and be transparent about the process when communicating results.
    3. WSP coverage may not reflect the coverage achieved on an actual plant tissue surface. It is suitable as a relative index (I.e. papers can be compared to papers, but not to tissues) but the spread factor changes with surface wettability and the surface tension of the liquid sprayed. Note the differences in percent area covered in the following experiment with an organosilicone super-spreader:
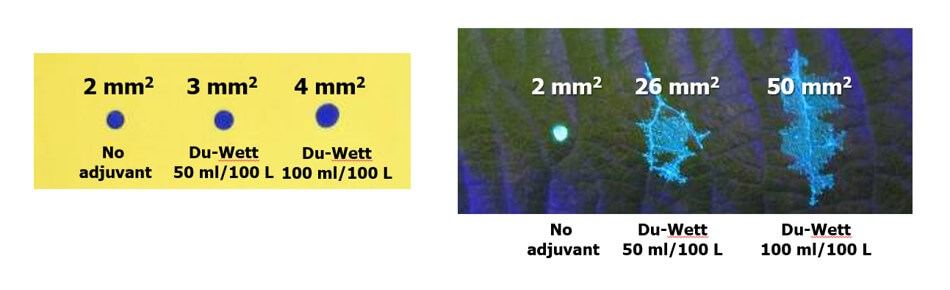
    Difference in deposit spread on water sensitive paper versus a leaf surface using an organosilicone super-spreader and UV dye. The same volume was applied in each case and while the area increased two-fold on WSP it increased ~10-fold on an actual leaf. Image reproduced from work by Robyn Gaskin, Plant Protection Products, New Zealand.

    Recall that we started this document by listing the four pieces of information commonly sought using WSP. They were listed in order of reliability, and now we can explain why.

    • The percent surface area covered: We have established that this is the most reliable piece of data. Droplets do not spread on WSP the way they do on plant surfaces, so it will underestimate actual coverage. The results vary by analytical method, but it’s likely not dependent on resolution and still falls within the variability inherent to spraying. This metric gives us valuable and actionable information. We can say whether or not we hit a target, and evaluate whether a sprayer change resulted in more or less deposit.
    • The density of deposits on the target area: We have established that that there are limits to the reliability of this metric. It is affected by the analytical method used and can be greatly underestimated when resolution is poor or when deposits overlap in high numbers. Also, it will never reliably reflect deposits under 30 µm. Nevertheless, under controlled conditions this information does have value and is of great interest in enquiries about drift and contact fungicides.
    • The size of the droplets that left the stains: This metric is highly questionable except under controlled conditions. The many assumptions about surface tension, droplet speed, and droplet evaporation make it impossible to make definitive statements about spray quality. Finer droplets are greatly underestimated in this equation. Therefore, while there may be some value in using WSP as a relative index, this metric is a crude indication at best.
    • The dose applied to the target surface: This metric has not been discussed up to this point, but is quickly and easily dismissed. Let’s assume that a droplet with a high concentration of an active ingredient will leave a stain that is the same area as another droplet with a lower concentration. This will lead some to suggest that as long as the original concentration is known, we can back-calculate the dose (which is the amount of active on a given area). However, one droplet has the same volume as eight droplets that are half it’s diameter. This cubic relationship means that if they all deposit, the larger droplet will cover roughly 1/2 the surface area as the eight smaller droplets. Therefore, the smaller droplets spread the same amount of active over a greater area. Spread factor muddies this a bit, but ultimately it means that dose cannot be estimated from area covered. Dose is better assessed using collectors that permit the residue to be removed, such as Petri dishes, Mylar sheets, pipe cleaners, alpha cellulose cards, or glass slides.

    And so, the image analysis process described here is powerful and effective when used with water sensitive paper as long as the limitations are acknowledged. The same process can also be used with dyes and specialized collectors such as Kromekote to permit even greater resolution. But that’s another story.

    2026

    A new Brazilian cellphone-based system (SprayDex) emerged in 2026 that offers possibilities. Preliminary testing alongside other methods indicate it is consistent within itself, but as we saw in previous testing, the same WSP scanned using different systems will create different results. This is why, ultimately, WSP is a relative index and should only be compared within a given system; coverage cannot be reliably compared across WSP brands, or between digitization methods.
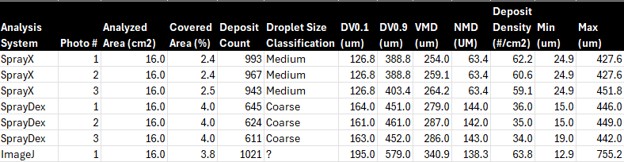
    2026 Comparison of three digitization / analysis methods. Same WSP was scanned each time.

    References (Further reading)

    Bankhead, P. 2014. Analyzing fluorescence microscopy images with ImageJ.

    Cunha, J.P.A.R., Farnese, A.C., Olivet, J.J. 2013. Computer programs for analysis of droplets sprayed on water sensitive papers. Planta Daninha, Viçosa-MG. 31(3): 715-720.

    Ferguson, J.C., Chechetto, R.G., O’Donnell, C.C., Fritz, B.K., Hoffmann, W.C., Coleman, C.E., Chauhan, B.S., Adkins, S.W. Kruger, G.R., Hewitt, A.J. 2016. Assessing a novel smartphone application – SnapCard, compared to five imaging systems to quantify droplet deposition on artificial collectors. Computers and Electronics in Agriculture. 128: 193-198.

    Ledebuhr, M. 2016. Small Drop Sprays.

    Marçal, A.R.S., Cunha, M. 2008. Image processing of artificial targets for automatic evaluation of spray targets. Trans. of the ASABE. 51(3): 811-821.

    Moor, A., Langenakens, J., Vereecke, E., Jaeken, P., Lootens, P., Vandecasteele, P. 2000. Image analysis of water sensitive paper as a tool for the evaluation of spray distribution of orchard sprayers. Aspects of Applied Biology. 57.

    Panneton, B. 2002. Image analysis of water‐sensitive cards for spray coverage experiments. Applied Eng. in Agric. 18(2): 179‐182.

    Salyani, M., Zhu, H., Sweeb, R.D., Pai, N. 2013. Assessment of spray distribution with water-sensitive paper. Agric. Eng. Int.: CIGR Journal. 15(2): 101-111.

    SnapCard website. University of Western Australia and the Department of Primary Industries and Regional Development, Western Australia. (Note: As of 2026, may no longer exist).

    Syngenta. 2002. Water‐sensitive paper for monitoring spray distributions. CH‐4002. Basle, Switzerland: Syngenta Crop Protection.

    Turner, C.R., Huntington, K.A. 1970. The use of a water sensitive dye for the detection and assessment of small spray droplets. J. Agric. Eng. Res. 15: 385-387.


  • Assessing Water Sensitive Paper – Part 2

    Assessing Water Sensitive Paper – Part 2

    This is part two of our three-part monster-article on methods for digitizing and processing water sensitive paper. You can read part one here.

    Image analysis software

    There are many choices of software designed to analyze digitized WSP images (E.g. Optomax, Stainalysis Freeware, DropVision, ImagePro Plus, DropletScan, AgroScan, DepositScan, UTHSCA ImageTool). Some were developed for aerial applicators to evaluate entire swaths and others to focus on single collectors. Some are more user-friendly than others, some cost money, and some are no longer supported. All of them employ algorithms (a set of rules a computer follows when making calculations) that often make image processing decisions. Sometimes these algorithms are pre-set, which can be convenient but may also restrict our analysis.

    ImageJ is a free, open-source application developed at the National Institute of Health by Wayne Rasband to adjust and analyze high-resolution images of small structures. There’s a variation called “Fiji” (Fiji Is Just ImageJ) which bundles ImageJ with tools specifically intended for biologists. Happily, they are equally valuable for analyzing WSP. The interface can be intimidating, but only because there are so many functions that we won’t be using. The learning curve is worthwhile because the user has complete control over the analysis.

    The ImageJ menu. Version 1.53e.

    Three steps to image analysis

    No matter the software, the operations used to analyze a digital image tend follow a three-step progression:

    1. Pre-processing: We select an ROI (a Region Of Interest) in the image and perform a few preliminary operations to improve image quality and contrast. In selecting a specific region, we can avoid unwanted flaws like drips or fingerprints as well as crop the image to some standard size for scaling purposes.
    2. Processing / Detection: Point and Morphological Operations are used to refine the image and establish a threshold so we can differentiate between deposits and the unstained background. The ideal outcome sees the original colour image converted to a binary (typically black and white) image.
    3. Measurement: We use ready-made computational routines to quantify some value. Typically, the percent area covered by deposits, but possibly the count and density of those deposits and perhaps even an estimate of the original droplet size.

    Let’s explore each of these steps.

    1. Pre-processing step

    Pre-processing establishes the scale of the image and allows us to isolate the specific region we want to analyze. Perhaps the water sensitive paper was folded during sampling and we want to analyze each half separately. Perhaps we want to avoid obvious imperfections that would interfere with our results. In some cases, pre-processing might also include adjusting the image brightness to improve the contrast between stains and the yellow background.

    Flaws and imperfections become obvious when water sensitive paper is examined under magnification. Part of pre-processing is to select a region of interest that represents typical coverage and does not include artifacts that might interfere with the analysis.

    2. Processing / Detection step

    Processing and detection can take time because of the degree of computation involved. The higher the resolution and the larger the ROI, the longer it will take. Depending on what you want to measure, it might be acceptable to sacrifice some accuracy for speed.

    We begin by determining which pixels represent part of a deposit stain and which represent part of the unstained background. We can accomplish this through global point operations called Thresholding and Filtering. If you haven’t already noticed, image analysis includes has a lot of jargon: “global” means the entire image and “point” refers to our focus on individual pixels. Ultimately each pixel is assigned one of two values, reducing the image to a binary (or 1-bit) format.

    Once we have a binary image, we explore the shapes of the deposits (which are sometimes referred to as objects) to determine the limitations of what we’re confidently able to measure. Morphological operations are used to refine or modify these shapes in order to smooth jagged edges and identify whether an object is the result of a single deposition or multiple overlapping deposits.

    3. Measurement step

    Depending on the image analysis software, the user may be limited in what they can measure. The spectrum ranges from a single value (usually percent area covered) to in depth data relating to each object in the image. The latter might appear in a pre-formatted report, or as a CSV (Comma Separated Value) file for further exploration in spreadsheet format.

    Thresholding

    A thresholding operation sorts all the pixels in an image by some characteristic, and then allows us to set a threshold dividing them into two camps. In our case, we want to divide them into “stained” and “unstained”. The process is almost like taring a scale, where anything above the weight of the container is identified as the weight of the contents.

    Thresholding is like taring a scale. Just as the weight of the container is isolated from the total weight of the container and contents, the stain colour is isolated from the background colour.

    The HIS thresholding operation

    ImageJ’s Colour Threshold operation is only one way to threshold an image, but it serves as a good example. This method uses HIS (Hue, Intensity and Saturation) to separate the deposit stain colours (blue-green) from the background colour (Yellow). As discussed, each pixel is represented by one or more 8-bit values. In this case pixels represent 0 – 255 hues, 0 – 255 intensities and 0 – 255 saturations. That may seem intimidating, but we mostly focus on hue.

    When the Colour Threshold operation is selected, ImageJ sorts all the pixel values in the image into a binned histogram (where the Y-axis is the pixel count and the X-Axis is the range of pixel values).

    a. Hue

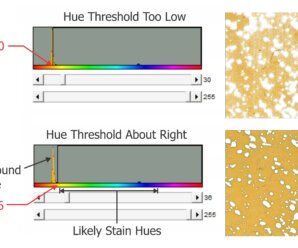
    We begin by considering the hue, which is simply another word for colour. An image with no stains would produce a histogram with pixel colours producing a distinct peak in the yellow range. An image with stains would also display peaks in the blue-green range. The user then segments the background from the foreground by manually setting the threshold between these peaks.

    (Top) When the threshold overlaps the background yellow hue (set to 30 here), some portion of the background is falsely identified as a stain. (Bottom) When the threshold is adjusted to fall in between background hue and stain hues (set to 36 here), a sharper distinction is made.

    The hue thresholding process is less reliable (or can outright fail) when WSP has coverage in excess of 50%. This is because the color of the intermittent unstained areas changes as the distance between stains decreases. Think of it as blue bleeding into the yellow. The result is that the level of contrast between stained and unstained regions is inconsistent, making it difficult to confidently differentiate between “stained pixels” and “unstained pixels”. Similar issues arise when humidity causes the background colour to change but this tends to be more uniform and easier to threshold.

    If the hue threshold it is set too low, stains will appear smaller and lose their shapes. If it is set too high, stains will appear larger and the gaps between adjacent, separate stains can disappear. This can have a significant impact on deposit count and distribution assessments, resulting in the loss of thousands of tiny, distinct deposits. Threshold accuracy has less impact on the determination of percent area covered. Research has shown that the use of a single threshold for multiple papers gives an absolute error of +/- 3.5% area covered. This is considered well within the intrinsic variability of spray coverage data.

    b. Intensity

    Sometimes referred to as “Value”, intensity can be thought of as pixel brightness. No threshold is required here because capturing the entire 256 pixel value range improves the contrast between colours.

    c. Saturation

    Finally, saturation (a measure of the difference between red, green, and blue levels) is a useful thresholding adjustment when WSP has been exposed to humidity. Humidity does not affect WSP’s ability to resolve stains, but as we mentioned it can cause the background to take on an overall greenish hue. An increase in low end saturation limit can increase the contrast between the stain colour and a less-distinct background colour.

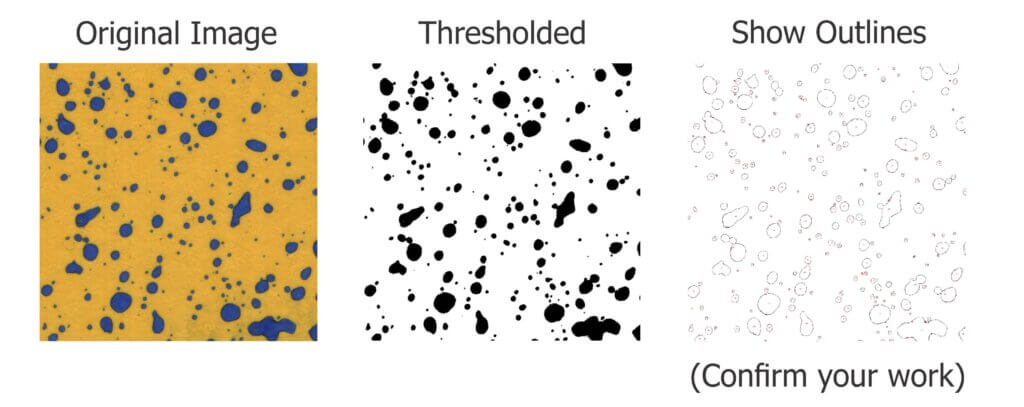
    When the HIS thresholds are set, ImageJ converts the pixels values closer to the foreground (stains) to black and those closer to background (yellow) to white. Users can invert this if they wish, or even make the stains red. The important part is that we now have a binary image that makes a clear distinction between the stains and the unstained background. Ideally, thresholding should be performed for each consistent set of samples.

    Learn how HIS thresholding is being used to perform weed recognition functions on sprayers in this article.

    This 2 cm x 2 cm ROI was HUI thresholded. You can double check your accuracy by having ImageJ “show outlines” which outlines and numbers each distinct object. Zoom in to see if any artifacts remain (or were inadvertently created) and go back to make minor thresholding adjustments if needed.

    Pixel filtering

    We won’t belabor filtering because it isn’t often required when analyzing WSP. Filtering operations compare pixel values to those of their neighbours and then replace those values with some form of weighted average. This reduces the relative differences between pixel values, smoothing the image and reducing noise (at the cost of lost detail).

    Last article –Part three: Morphological Operations and Interpretation.

  • Crop-Adapted Spraying (CAS) and an Apple Orchard Case Study

    Crop-Adapted Spraying (CAS) and an Apple Orchard Case Study

    An orchard spraying scenario

    Here’s a common situation: An orchardist following IPM identifies a pest that poses an economic threat. It’s an annual pest and spraying is really a matter of when, not if. The operation is 150 acres and runs three airblast sprayers; two have a tower and one does not. Multiple varieties are planted in several blocks on different rootstocks and they are at different stages of maturity. The newer blocks are trellised high density trees and the older blocks are semi-dwarfs on different row spacing. Let’s also imagine the pruning team hasn’t finished yet, so some trees are not pruned.

    The orchardist turns to the pesticide label to decide how to spray such variable targets. It prescribes a range of doses per planted area (not canopy size), depending on the pest pressure. It advises the orchardist to use “enough water” to ensure “good coverage” without incurring “runoff”.

    The orchardist recognizes that the label is vague, and elects to rely on what has worked historically: A water-soluble pouch is dropped into each tank (dose is close enough), and each sprayer operator is instructed to drive at an efficient speed (get it done because rain is coming), spraying until the tank is empty. They say that if a tank is running low before the job is done, speed up and stretch it. If the spray is overshooting a younger planting, they suggest turning off the top nozzles and/or driving faster.

    Airblast operators face this situation regularly. The question is: “Is there a problem with spraying this way if it results in a respectable crop of quality fruit?” Agricultural engineers specializing in application technology in Spain, Australia, Great Britain and the United States say there is a problem, and on behalf of Canada, I completely agree with them.

    Canopy and Sprayer Variability

    The fundamental problem is inconsistent spray coverage and avoidable waste (of time, water and pesticide) due to variability. Our scenario notes multiple sprayer operators, different models of sprayer, and a range of varieties, orchard architectures and canopy management practices. The label does not allow for any of these factors, adhering to a rate based on planted area and remaining silent on water volume.

    International peer-reviewed journal articles stretching back to the sixties have conclusively demonstrated order-of-magnitude differences in the area-density of orchard canopies from one acre to the next. There can even be fold-differences in canopy area-density in the same planting as the season progresses. A label prescribing a fixed dose based on the area planted is not appropriate for any vine, bush, cane or tree crop, and the result is that more crops are over- or under-sprayed than receive appropriate coverage.

    Let us not forget the variability that comes from a poorly adjusted sprayer. I won’t to attempt to quantify the impact (although some researchers have suggested order-of-magnitude differences from sprayer to sprayer). Instead, let’s illustrate it as a conceptual “before and after”:

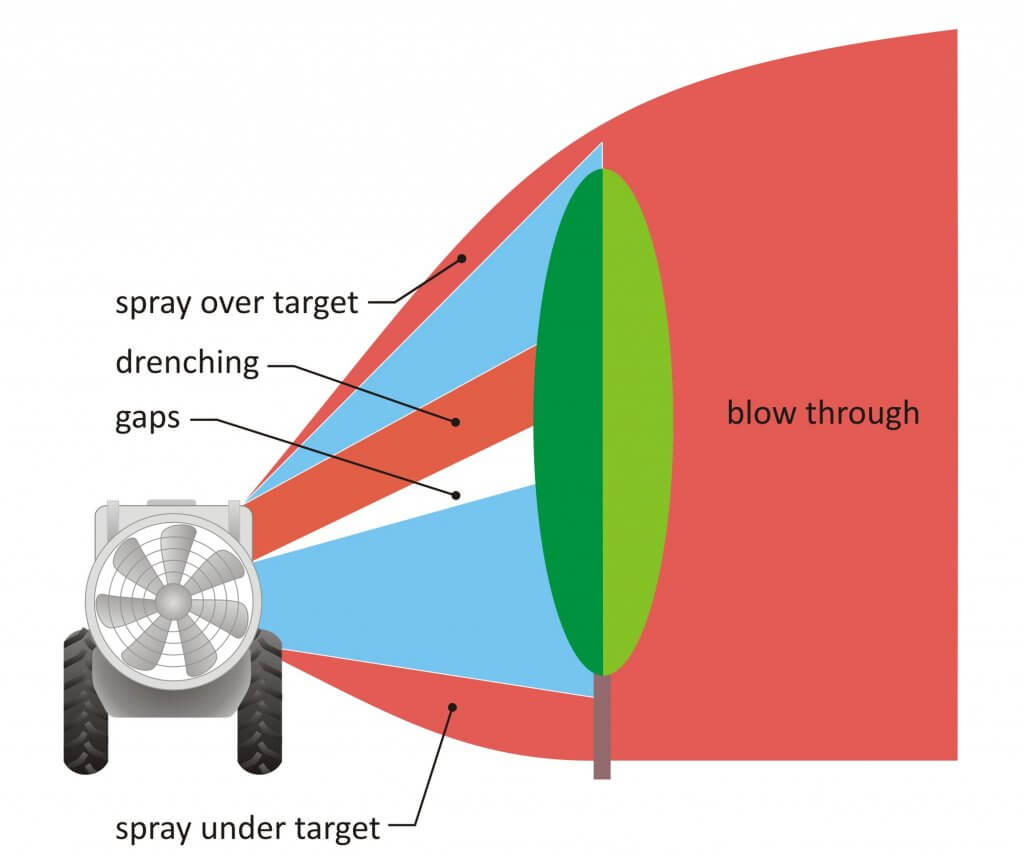
    Before: Potential spray loss and inconsistency before adjusting sprayer to match the canopy
    After: Coverage variability reduced and unnecessary waste mostly eliminated.

    Beyond the immediate impact on efficiency, variability makes it difficult to diagnose pesticide effectiveness. As an example, there was a scab outbreak in Ontario in 2009 that elicited questions about timing, weather, product choice and resistance. There was very little attention given to spray coverage, which to my mind should have been the first question if only to eliminate it as a potential culprit. This is because each operation interprets labels differently, and very few confirm coverage in any quantifiable way. This practice makes it more difficult to identify a cause when crop protection fails.

    Optimizing pesticide rates

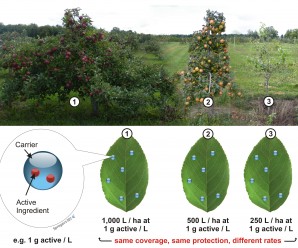
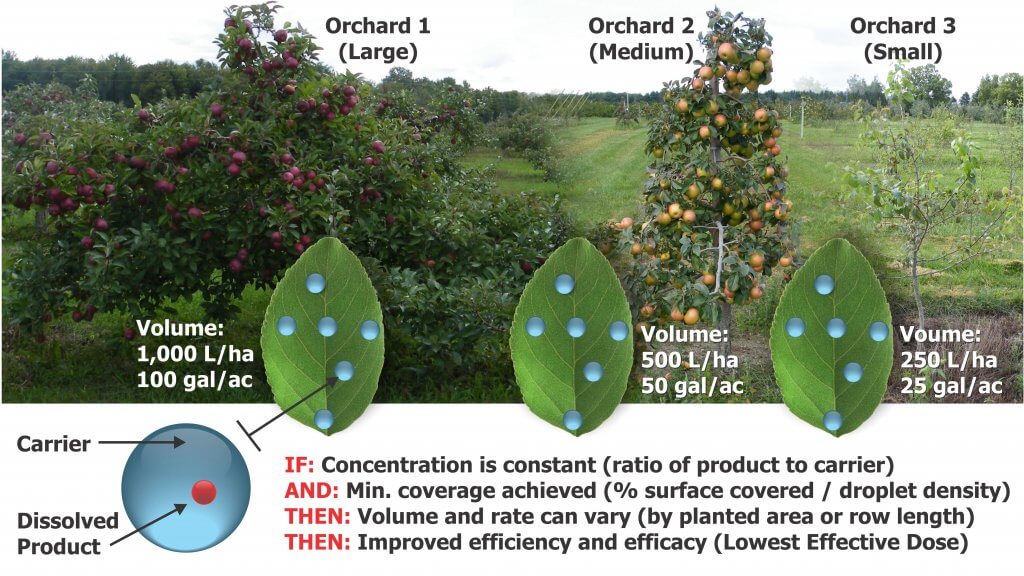
    That was a lot of preamble to describe an issue that many orchardists are already aware of. What is needed is a way to adjust the amount of pesticide per unit ground area (i.e. the label’s prescription) to achieve consistent foliar coverage for canopies of varying shape and density. The concept is visualized in the following figure. In addition, the method has to be simple, intuitive and effective.

    Many models have been proposed to tackle the dose expression issue, including Tree-Row Volume, Leaf Area Index, Leaf Wall Area, PACE+ and DOSAVIÑA. There are advantages and disadvantages to each method. Standing on the shoulders of giants, we combined aspects of each of these models, including incorporating coverage factor research from USDA ARS work in nurseries, to develop the Crop-Adapted Spraying (CAS) method. It is neither complicated nor sophisticated. It formalizes a series of qualitative calibration techniques and the objective is to achieve a target foliar coverage pattern. When achieved with sufficient accuracy, pesticide efficacy is maintained and waste is greatly reduced.

    Caveats

    Perhaps I shouldn’t point out flaws before I describe the model’s effectiveness, but it’s important to understand that CAS relies on a few critical assumptions.

    The first assumption is that the sprayer operator’s typical ratio of formulated product to carrier is appropriate. We need a starting point for adjusting the amount of pesticide per unit planted area, and unless the label specifies a concentration (i.e. a ratio of formulated product to water) or a minimum amount of product per planted area, this is a reasonable starting point. The appropriateness of this assumption is evidenced by a history of satisfactory pest control in the orchard.

    The second assumption lies in defining a threshold for sufficient coverage, and this is a real challenge. Applications can be concentrate or dilute. Some products translocate in the leaf or redistribute on the leaf surface while others do not. Even the droplet size employed (e.g. A mist blower’s fines compared to Medium-Coarse droplets produced by an air induction nozzle) will affect dose, bioavailability and how long residues are active. So, how does one draw a universal line in the sand and say “this much is enough”?

    Our threshold for suitable foliar coverage has evolved through experience, literature review and independent experimentation in several countries and in multiple 3D cropping systems. We propose 10-15 % surface coverage and a minimum of 85 droplets per cm2on a minimum 80% of the canopy. This standard is intended to be practical, versatile and robust in order to safely represent sufficient coverage for most foliar insecticides and fungicides. It is not suitable for ultra-low volume sprayers (e.g. misters, foggers, air-shear), nor is it intended to be a rigorous, scientific absolute.

    For example, a drench application, such as streptomycin or dormant oils, will obviously require more coverage. Plant growth regulators like thinners, stop-drops and foliar nutrients have their own unique criteria. Products that work through vapour redistribution (e.g. some forms of sulfur) and bio-rational products have a minimal dose threshold that must be ensured per planted area, no matter the water volume used. In these cases, Crop-Adapted Spraying may not be appropriate.

    So while it is the nature of models that they may not hold in every situation, this threshold has proved successful in multiple Ontario apple (later in this article) and highbush blueberry operations.

    The method

    The method is a simple and iterative approach that allows growers to adjust the product rate and sprayer output in relation to canopy and sprayer effects on deposits. Follow these steps to adjust the sprayer and optimize coverage. Only do so in conditions you would normally spray in.

    Step 1

    The sprayer should receive all seasonal maintenance prior to first use and undergo a visual inspection before each spray day.

    Step 2

    Park the sprayer in an alley between rows of trees and tie 25 cm (10 in) lengths of ribbon along the air outlet. That would be the deflectors on a low profile axial sprayer, the hubs of multifan systems or the ducted outlets on towers. Turn on the air and extrapolate where the air is aimed. Adjust the air to just overshoot the top of the canopy.

    Step 3

    It is important that the spray slightly overshoot the canopy height. It is less important to spray the lowest point of the canopy as secondary deposition tends to provide sufficient coverage. This may change if fruit weighs down the branches. Ensuring a full swath, turn off any nozzles that are not required. For small and medium canopy sizes, consider using air-induction hollow cones in the top positions of each boom to reduce drift. You may have to increase the rate in those positions to compensate for the fact that nozzles producing larger droplets produce fewer droplets.

    Step 4

    Affix 25 cm (10 in) ribbons to the upwind and far side of one or more trees. At minimum, affix them at the treetop and along the widest portion of the canopy. With the tank half-full of water, drive past in the spraying gear at the ideal RPMs with the air on. A partner in the next alley should see the highest ribbon move. Ideally the other ribbons will waft as well, but in large, dense canopies they may not. In this case, ensure leaves are moving beyond the trunk. No ribbons should strain straight-out.

    This will determine if more/less air is required from the airblast sprayer. The operator can change fan speed (e.g. fan gear), or adjust the sprayer’s travel speed. Lower speed causes air to go higher and deeper and vice versa. In some cases, operators can reduce fan speed by reducing the tractor PTO revolutions by gearing up and throttling down. When air is corrected, determine ground speed in the orchard using smartphone GPS app or a calibration formula.

    Step 5

    Place and interpret water-sensitive papers per this article. If coverage is excessive, reduce output in corresponding nozzle positions (by replacing them with lower rate nozzles). If you see less than ideal coverage, increase the nozzle rates in those positions.

    Be aware that excessive coverage may be unavoidable in the outer edge of the canopy, given that spray must pass through to get to the centre. It is not unusual to see half the deposition mid-canopy when the outside is saturated. Also be aware that ambient wind speed and humidity have significant impacts on coverage. Therefore, only test coverage in conditions similar to your typical spraying conditions.

    Step 6

    When the canopy grows and fills in sufficiently (usually after petal fall), you may have to reassess coverage to reflect a larger, denser canopy with more surface area. Given the critical nature of early season fungicide applications, it may be preferable to have slightly excessive coverage early season and allowing it to self-correct as the season proceeds. If you are suspicious that the spray is being stretched too thin or you are unsatisfied with the coverage, increase the output.

    For high density trees, there may be no need to increase output mid-season. Early in the season, wind travels relatively unimpeded in a high-density orchard and will blow spray off course, reducing coverage and requiring higher water volumes or possibly more air to compensate. As the trees fill in, the average wind speed is reduced and more spray can impact on the target.

    Mixing and Work Rate

    When the correct sprayer settings and volumes have been determined, the operator will mix their spray tank as they would for their typical application. The sprayer will likely cover more orchard than it has in the past, and the operator will have to re-assess how many tanks are required pre and post petal-fall. If your sprayer is employs conventional hydraulic nozzles (that is, it is not a low-volume sprayer), it is not advisable to go below 400 L/ha (~40 gpa).

    This is where OrchardMAX (the free CAS calculator app) can help the operator ballpark the correct rates for each nozzle position and estimate work rate, tanks required, and any potential savings in product.

    Yes. There’s an app for that.

    Apple Orchard Case Study

    Three Ontario apple orchards (and one Nova Scotia orchard) agreed to test the model. A block of trees was randomly selected from each operation to serve as the treatment condition. These trees received spray according to the CAS model. The rest of the orchard was sprayed according to the grower’s traditional methods. The orchards included several varieties and represented both semi-dwarf and high density plantings.

    OrchardTypical spray volume (Control)CAS spray volume (Treatment)% SavingsVarieties (age)Orchard StructureYears in study
    Orchard 1486 L/ha373 L/ha23%Gala + g. Del (~10 yr old)High density3
    Orchard 2748 L/ha478 L/ha &

    608 L/ha = 543 L/ha

    28%Macs + Empires (~30 yr old)Semi-dwarf3+
    Orchard 3577 L/ha

    (660 L/ha)

    407 L/ha39%

    (38%)

    Gala + Fuji (~20 yr old)High density2
    Nova Scotia544 L/ha416 L/ha33%Jonogold (~10 yr old)High density1+

    According to the model, each grower sprayed anywhere from 20-35% less per hectare in the CAS block than in their traditionally-sprayed block. In many cases, the overall canopy coverage was improved in the CAS block compared to the traditional method simply by aiming formally wasted spray into the canopy, and reducing volume in those areas that were unnecessarily drenched.

    A scout was dispatched to monitor insect and disease activity each week for ~15 weeks. They observed a typical IPM scouting protocol and were not informed which block was the traditional control and which was CAS treatment. Data was transformed where appropriate for analysis of variance. In almost every case, there was no significant difference in counts between the CAS treatment and the grower’s traditionally-sprayed control (p=0.05). In those few cases where a pest had higher counts in the CAS block, the counts were so far below a spray threshold as to be insignificant.

    If we look more closely at the three (of 128) ANOVA comparisons of control to treatment, we see that economic thresholds are rarely an issue, and essentially, difference between control and treatment are moot.

    2015_TSSM_O1_Y2
    2015_ERM_O1_Y3
    2015_ERM_O1_Y2

    This study was repeated over three years. Having examined the data to determine if three years of optimized doses had any effect on pest populations, results suggest no such effect.

    Apples were randomly sampled for destructive analysis at harvest and the total counts of any and all damage are shown below. This is simply a tally, and no statistical significance is implied. Note that Orchard 3 was only involved in the study for two years, and unfortunately a killing frost destroyed their harvest in their second year, so we didn’t have much to harvest.

    Apple_data_3_years

    An important part of knowledge transfer is whether or not growers will choose to adopt a method once the instructor is gone. By year two the biggest challenge was ensuring the orchardists in the study continued to spray the control block at their traditional volumes! They were more than willing to adopt the method wholesale and all three did so starting in 2016. Further, colleagues in Nova Scotia performed their own CAS trial for two years, and reported no significant difference in pest activity or apple quality. They accomplished this simply by following a written protocol.

    The orchardist’s enthusiasm, the ability for the study to be replicated without my direct involvement, and the successful results speak to the viability of the method.

    We would like to thank the researchers that developed the methods CAS is based upon, statistician Behrouz Eshani, the orchards that cooperated in the study, my OMAFRA colleagues and the OMAFRA summer students that scouted those orchards for three years.

    More information

    This method of application is really no more sophisticated than the pro rata practice of turning off nozzles that are aiming at the ground or above the target. It will take time for operators to get comfortable with the new volumes (and potentially reduced dosage) and regular scouting is highly encouraged to confirm they are achieving control.

    The maintenance, calibration and operation of an airblast sprayer is an involved process. Collectively, the sprayer setup, weather and crop morphology all influence the coverage obtained from an application. A fundamental understanding of application technology is required before attempting to optimize dosage using the CAS method. We suggest grabbing a copy of the second edition of Airblast101 – Your Guide to Effective and Efficient Spraying. The digital version is a free download, but you can buy a hardcopy as well.

    Finally, take a few minutes to watch this video by AAMS-Salvarani. In many European countries such as Belgium , France and Germany, sprayers must be calibrated regularly. While there is no mention of air speed adjustments, many of the steps in this video correspond with the airblast adjustments relating to Crop-Adapted Spraying.

  • Optimizing Sprayer Air Settings – Part 2

    Optimizing Sprayer Air Settings – Part 2

    This is part two of a two part article on how to optimize the match between the sprayer air and the target canopy. You can find the first part here. For a more fulsome description of the process, consult chapters 3, 9, 10, and 11 of Airblast101.

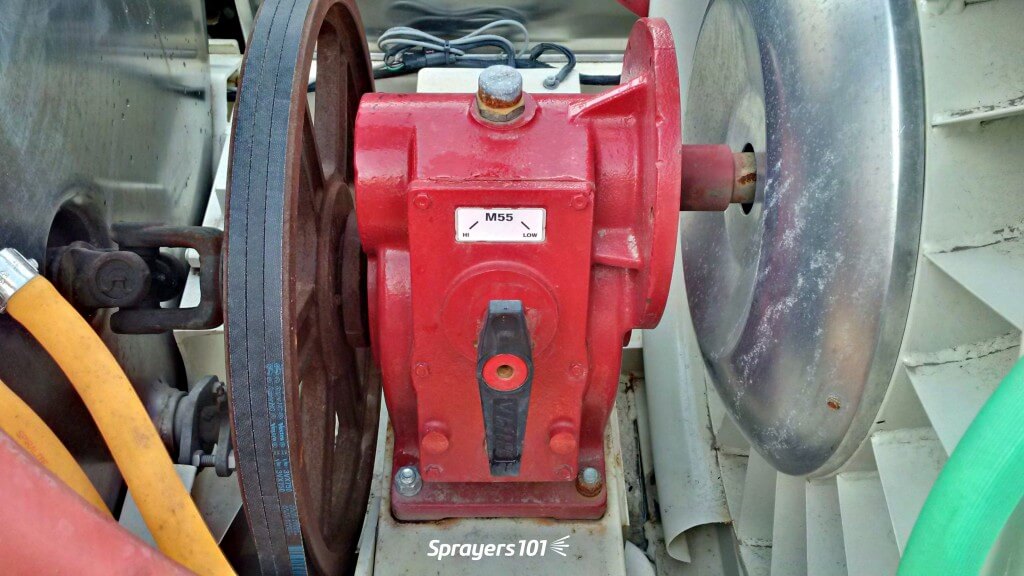
    A close up of an airblast gear box. There are usually two options – high or low.
    A close up of an airblast gear box. There are usually two options – high or low.

    Evaluating air energy – Ribbon test part 2

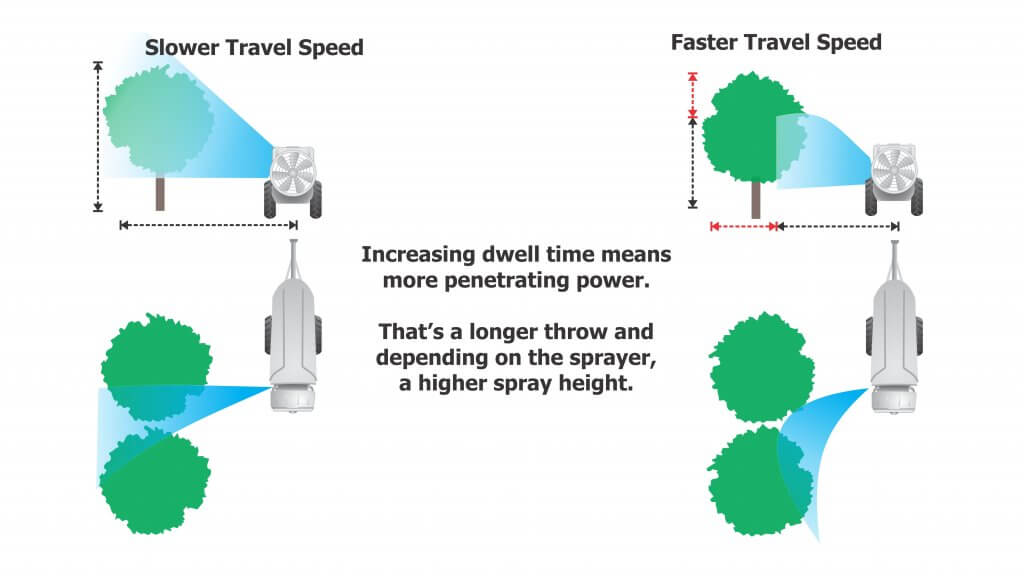
    Air behaviour can change radically between stationary operation and driving. We learned in part one of this article that slower travel speeds increase the throw and the spray height. The simplest way to monitor where air is going is for a partner to watch the leaves in the target canopy. Leaves that are ruffling indicate that air is reaching them.

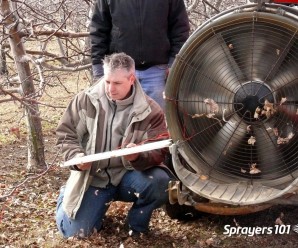
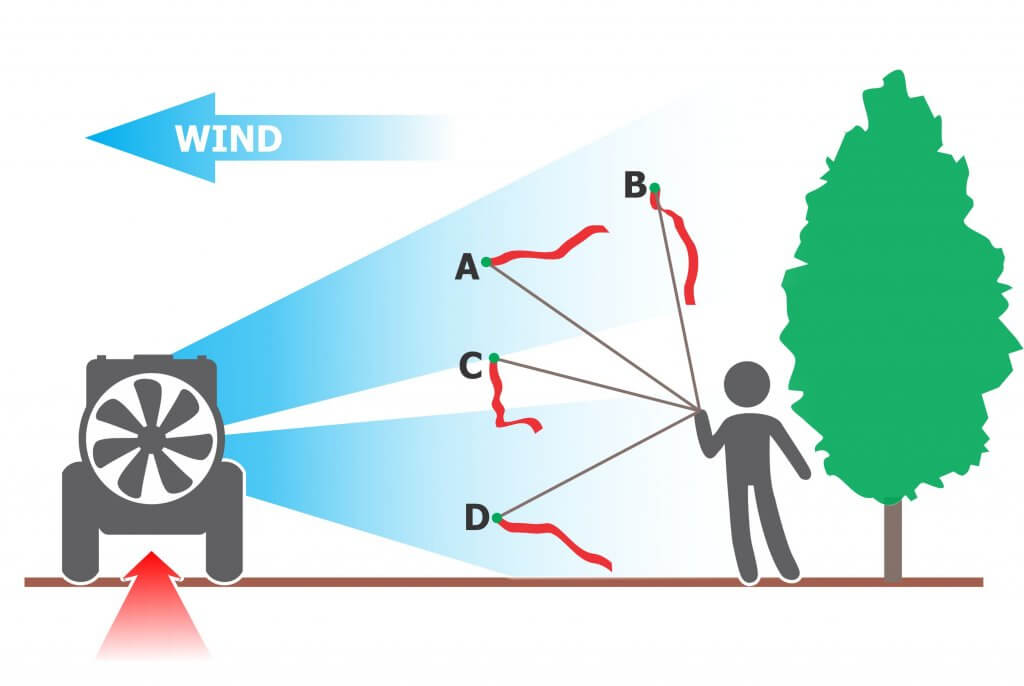
    A more informative method, and one that works during dormancy, requires a length of flagging tape tied to the end of a long stick. The partner (wearing eye and ear protection) can move the ribbon around in the air wash, extending it into areas of interest. The ribbon’s behaviour will indicate gaps, the air angle and relative air energy. The ribbon can be interpreted using the following figure.

    Work with the sprayer oriented to blow into any crosswind. Extend the ribbon into the sprayer air while the sprayer is stationary, or preferably, while driving. The ribbon’s behaviour will show what you couldn’t otherwise see. Here are a few possible outcomes: A. The angle and air energy are appropriate while the sprayer is stationary. B. The air energy is not sufficient to reach the tree top when the sprayer is driving. C. Obstructions or deflector misalignment can create gaps. D. Air is angled too low for the target canopy.

    Evaluating canopy penetration – Ribbon test part 3

    This final diagnostic accounts for the influence of any intervening canopy (or canopies for multiple-row strategies). It confirms that the air energy has the potential to carry droplets the full extent of the swath. Evaluating one side will give you a lot of insight but if you have the time it’s better to do both sides. Since most sprayers have at least some imbalance in air handling, the results may surprise you.

    1. Choose a canopy that is upwind and on the lift side of the sprayer (if applicable).
    2. Move the sprayer a distance into the row to allow it to reach target speed and to avoid wind effects on the periphery.
    3. Attach 25 cm (10 in.) lengths of flagging tape on the far side of the target canopy. Do this at the top, middle and bottom of the canopy. In tall canopies this might require a ladder, telescoping pole, or sections of galvanized pipe to raise the ribbons.
    4. With deflectors/spray outlets adjusted and the desired fan gear (or fan speed) selected, start the air without spraying and bring the sprayer up to the target travel speed. A partner wearing eye and ear protection will stand in the next alley and observe the ribbons as the sprayer passes (preferably recording a video for the operator).
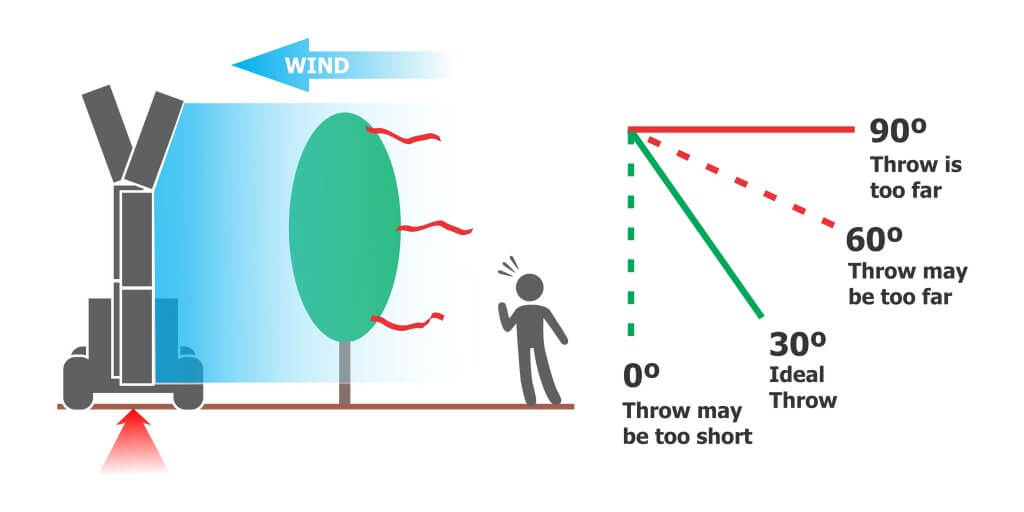
    Three ribbons are positioned on the far side of the upwind target canopy. In this case, an every-row traffic pattern is depicted. The observer watches or records the ribbons as the sprayer drives past with the air on (not the spray). For an every-row traffic pattern, the air energy is too high if the ribbon strains at 90⁰. It is ideal for the ribbon to briefly flutter (0⁰-60⁰). If the ribbon does not move (0⁰), the air energy may still be sufficient as long as it penetrates to the centre of the canopy. This is often the case with particularly dense/wide trees like nuts and citrus.
    Tying flagging tape in trees to indicate prevailing wind and to calibrate airblast air settings.
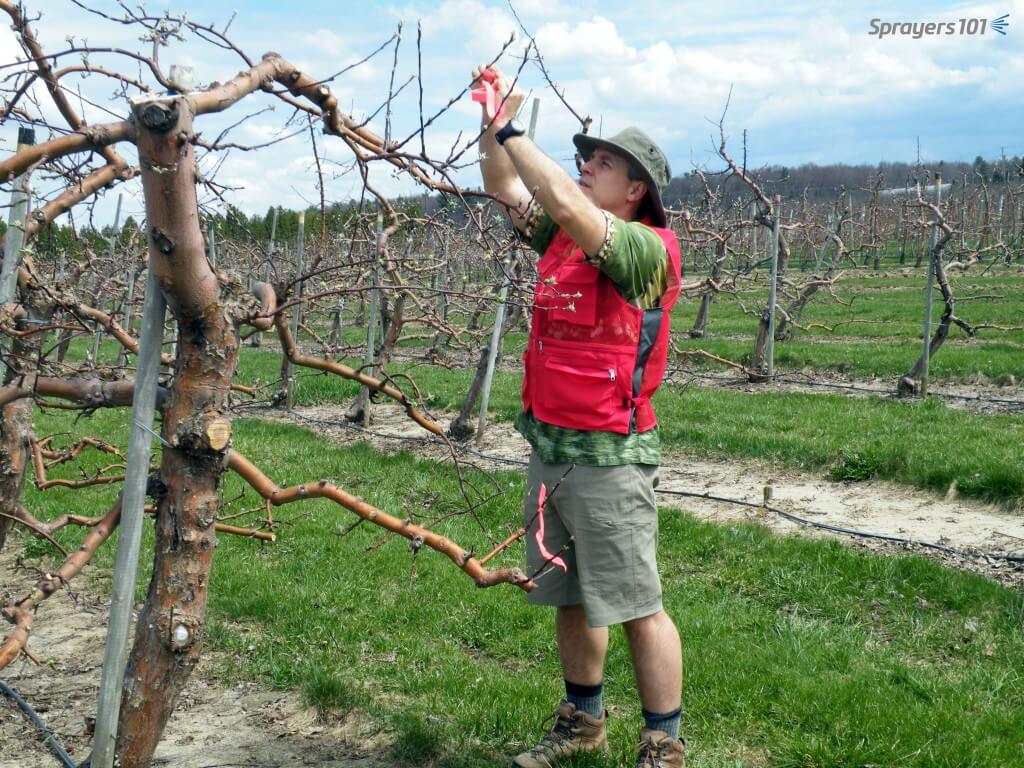
    Tying ribbons on the up-wind side in an apple orchard just past green-tip. The red vest has lots of pockets to hold supplies and sprayer operators can see it clearly for safety. The Hawaiian shirt is because it was a Friday.

    Repeat this process this for EACH significantly different crop sprayed with the sprayer. As with air direction settings, multiple set-ups might be needed to reflect each block, or you might choose to group of similarly-sized blocks and calibrate air to the worst case scenario. Record the set-up for each sprayer/block combination and keep a copy in the tractor cab(s).

    Interpreting the ribbon tests

    Interpreting the ribbons is not always straightforward. When they don’t behave as anticipated they may be indicating one or more of the following problems:

    1. The air angle is incorrect.
    2. The air energy is too low.
    3. The air energy is too high.

    There might be a single cause or several contributing factors. As you diagnose and attempt to correct these problems be aware that addressing one may create others. If the problem cannot be corrected, the sprayer configuration (or design) may be inappropriate for the canopy or the environmental conditions.

    Ribbons that don’t point from the sprayer to the canopy may indicate a misalignment of spray outlets or deflectors. The bottom of the air should align with the bottom of the target. More critically, the top of the air should slightly overshoot the top of the target. We want to avoid spray drift, but we must account for wind speed increasing with height and vertical booms that rock on uneven alleys. If the spray does not slightly overshoot the top of the target, it may miss it entirely.

    Adjusting horizontal alignment, when possible, can significantly impact sprayer performance. It can be tricky to optimize the angle because it represents the sum of several complicated interactions. Air outlets on wrap-around sprayers may be positioned too close to the target canopy to permit a ribbon test. However, you can still use the ribbon-on-a-stick technique to visualize how the air is behaving. Consider the following when positioning air outlets on either side of a canopy:

    Unresponsive ribbons are often observed during a ribbon test. Depending on where the ribbon is located, this may or may not indicate a problem. Ideally, the top ribbon should always move in response to sprayer air. In larger canopies, this location represents the greatest distance sprayer air must travel and the highest wind speed it will encounter. The middle and bottom ribbons may or may not move in response to sprayer air. This is common in larger, denser canopies. To confirm this, an observer would have to stand at the trunk and watch the leaves rather than the ribbons.

    Shingling and canopy distortion

    When possible, do not position laminar air outlets in direct opposition. The convergence creates a high pressure zone that reduces spray penetration. Laminar flows will deflect unpredictably around this pressurized area and carry droplets back out of the canopy. Unless the canopy is narrow and sparse, turbulent air handling systems do not typically create this problem. In both cases, canopy penetration is improved when fans are staggered and/or are angled slightly forward or backward.

    When too much air is vectored directly at the canopy face, it may close and compress that canopy rather than penetrate it. This is more likely when air is high energy, has a narrow air wash or is more laminar in nature. When leaves shingle, the overlap blocks spray and creates resistance to sprayer air. Air will then take the path of least resistance and either deflect around the canopy or channel through any openings. Shingling can be corrected by angling air outlets slightly forward or backward. A little goes a long way as small changes can have big effects.

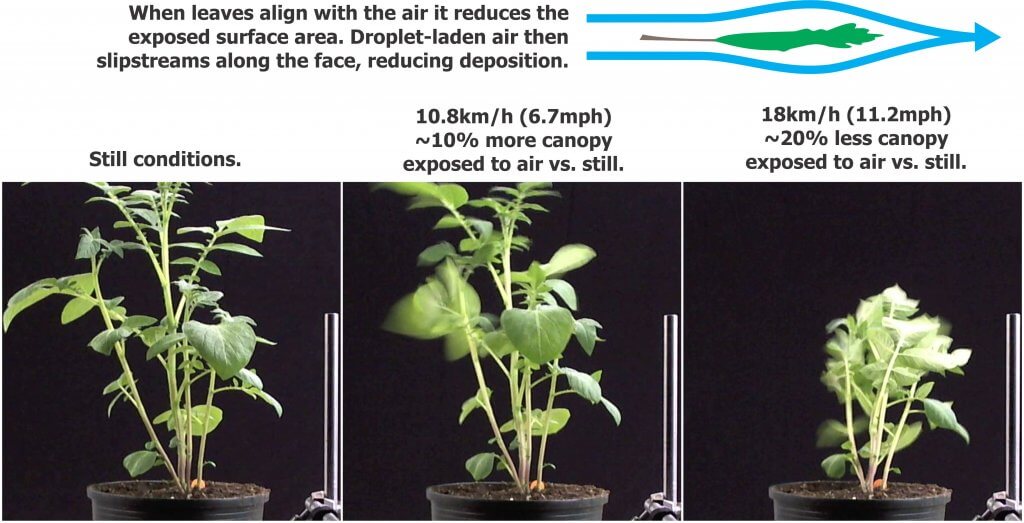
    Dr. Bernard Panneton (formally with the Horticultural R&D Centre, Agriculture and Agri-Food Canada) performed a series of experiments exploring the relationship between potato canopies and wind and his observations extend to all broad leaf crops. Bernard showed that as wind speed increased, the percent of leaf surface area exposed to spray also increased, but only to a point. If the wind got too fast, the percent of leaf surface exposed to spray dropped significantly: ~20% less!

    His interpretation was that low to moderate air speeds just ruffled the leaves, exposing their broad surfaces to spray more consistently. When air speed became excessive, leaves and twigs aligned with the wind, exposing only their thin edge to spray. The take home lesson is that spray will be more likely to impinge on all target surfaces when air speed and volume are calibrated correctly.

    Bernard summed this article up succinctly: “More air is not better!”

    Potato canopy distortion in an air tunnel. Research by Dr. B. Panneton.

    Video summary

    We’ll finish the article with a light-hearted video describing how the process works. It doesn’t explore the second ribbon test, but that’s more of a concern with distant targets or alternate row spraying strategies where the sprayer must penetrate one or more canopies in a single pass.

  • Optimizing Sprayer Air Settings – Part 1

    Optimizing Sprayer Air Settings – Part 1

    This is part one of a two part article on how to optimize the match between the sprayer air and the target canopy. For a more fulsome description of the process, consult chapters 3, 9, 10, and 11 of Airblast101.

    Why is air so important?

    Air handling is the most important and least understood mechanical system on a sprayer. Most air-assisted sprayers for three-dimensional perennial crops produce droplets that are Medium or smaller according to the ASABE S572.3 droplet size classification standard. These small droplets have very little mass relative to their surface area, so they don’t have much kinetic energy. Without air to impart speed and direction, most droplets would never go where we want them to. In addition, air opens and moves a canopy, exposing otherwise hidden surfaces to the droplets it’s carrying.

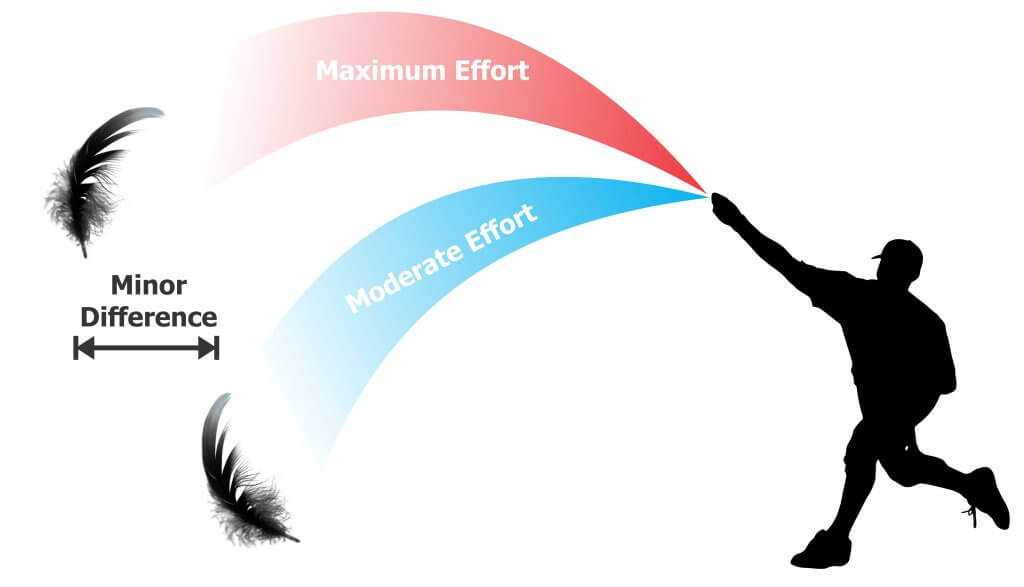
    Imagine throwing a feather. Now imagine throwing it as hard as you can. It may travel a little farther, but not much relative to the extra effort. Even then, an errant gust of wind might change its direction entirely. Similarly, we cannot rely on hydraulic pressure to propel small droplets. This is the primary reason for the “air” in air-assist spraying.

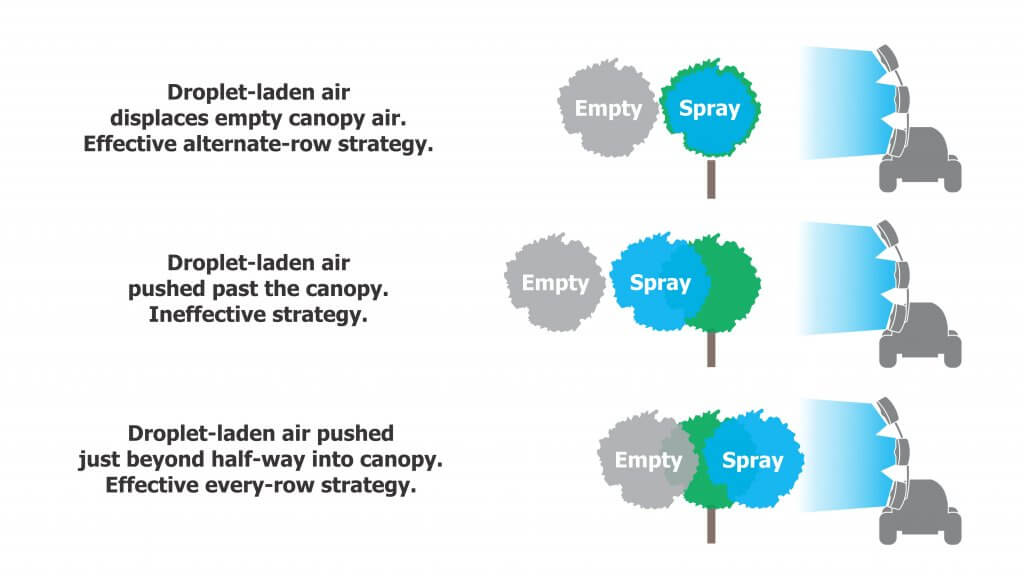
    Air-assist spraying attempts to replace the empty air within a canopy with droplet-laden air (and then get it to stay there). If we don’t have enough air energy, we won’t displace enough empty air and the throw will fall short. Likewise, if we have too much air energy, the throw will extend beyond the the target, wasting spray and likely compromising coverage. Ultimately, we want the air to expend all its energy, spreading, stalling and depositing droplets inside the target canopy.

    Travel speed

    Travel speed can have a significant impact on work rate. However, the effect of travel speed on air behaviour (and ultimately coverage) should be the sprayer operator’s primary concern. There will always be a trade-off between travel speed, coverage and work rate. Travel speed is the first and easiest adjustment to throw, spray height and canopy penetration. Just as travel speed modifies the liquid rate per row, it also modifies air energy per row.

    Environmental and canopy conditions

    Whenever calibrating or adjusting a sprayer, it is critical to do so in the crop, in environmental conditions you would typically spray in. You would not expect a sprayer to achieve the same results in high winds in a dormant vineyard as it would in calm conditions in a mature citrus orchard.

    I recommend using a handheld weather meter because local weather reports often don’t match the conditions in the planting. For temperature and relative humidity, take readings in the shade. For wind conditions, face into the prevailing wind and hold the meter as high as you can. Wind speed increases with height and we want to evaluate the most challenging part of the target – the top third of the canopy.

    Evaluating vertical air angles – Ribbon test part 1

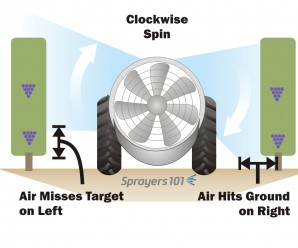
    The air angle (or direction relative to the target) is the first concern. Research has shown that low profile radial airblast sprayers without effective straightening vanes or deflectors make the air go up on one side and down on the other. In extreme situations, this might compromise the spray job (e.g. miss the lower portion of the target on one side of the sprayer) or it might simply waste spray and stir up debris. Here’s how you can see if this is happening on your sprayer:

    1. Park the sprayer in an alley between the rows.
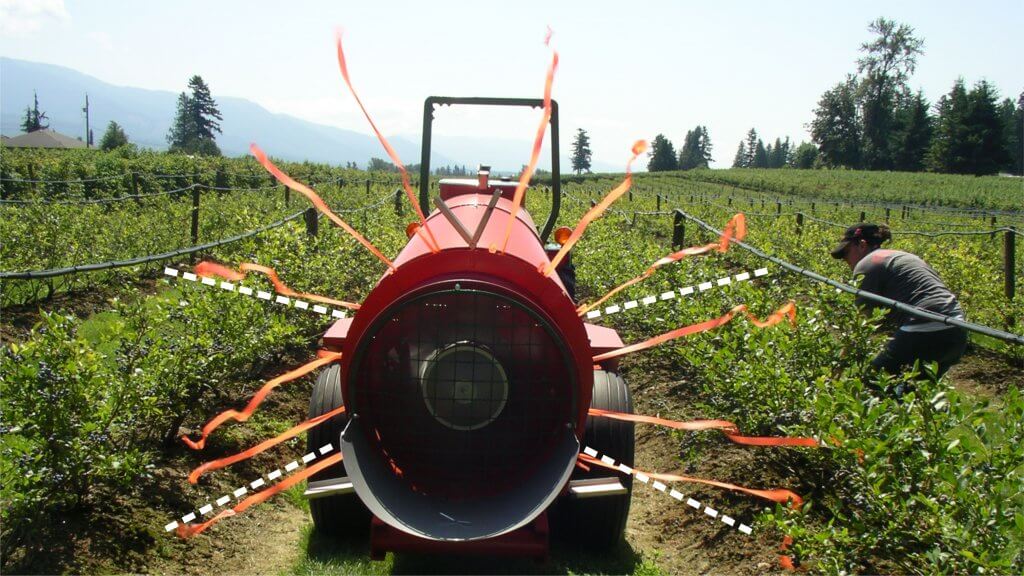
    2. Affix 25 cm (10 in.) lengths of tape along the air outlets. Tie them to nozzle bodies or use duct tape to position them so that they stand out in the sprayer-generated air.
    3. Bring the fan(s) up to the desired speed but do not spray. Stand back behind the sprayer and use the ribbons to extrapolate the air angle relative to the target canopy. Look for asymmetries and wasted air (i.e. angled above the canopy or into the ground.)
    The ribbons on the LPR sprayer in this photo are twice as long as they should be, but fortunately it was a calm day. Note the angles of the lower ribbons compared to the “ideal” broken white lines. The asymmetry corresponds to the misaligned bottom right deflector. Observe the ribbons while adjusting deflector positions. Any ribbons above the upper broken white lines indicate wasted air energy (and likely spray). Large upper deflectors, positioned horizontally, would reclaim wasted air and focus it into the crop.

    By observing the ribbons, you can extrapolate where deflectors or fan heads should be aimed. Air should be adjusted to slightly over- and under-shoot the target canopy. For ducted outlets, such as low profile Turbomist sprayers, the air outlet is not a uniform width – it’s widest about half-way down. Using ribbons to extrapolate air direction, aim the widest part of the outlet at the densest part of the canopy. This automatically repositions the booms as well, facilitating the next calibration step where we turn off nozzles that will significantly over- or under-shoot the target. This is discussed in another article.

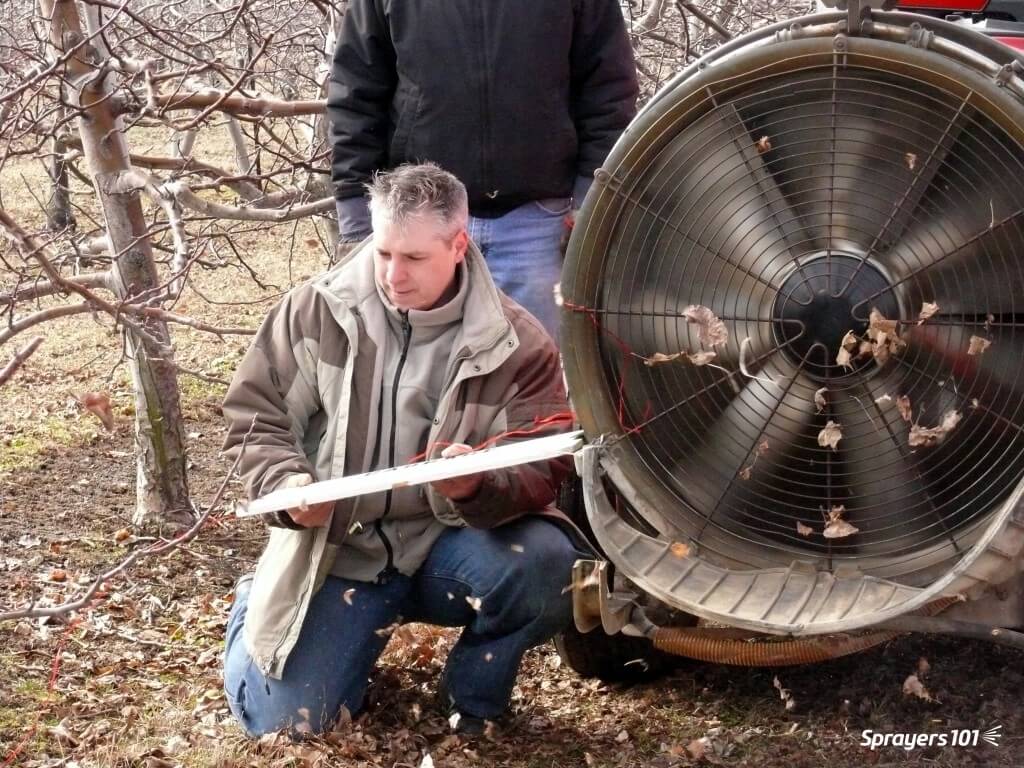
    Using a piece of scrap wood with a ribbon on the end to demonstrate how deflectors would channel air on a Florida airblast sprayer. Once convinced, this grower fabricated and installed deflectors and has been very pleased with their performance.
    Using a piece of scrap wood with a ribbon on the end to demonstrate how deflectors would channel air on an Economist airblast sprayer. Once convinced, this grower fabricated and installed deflectors and has been very pleased with their performance.
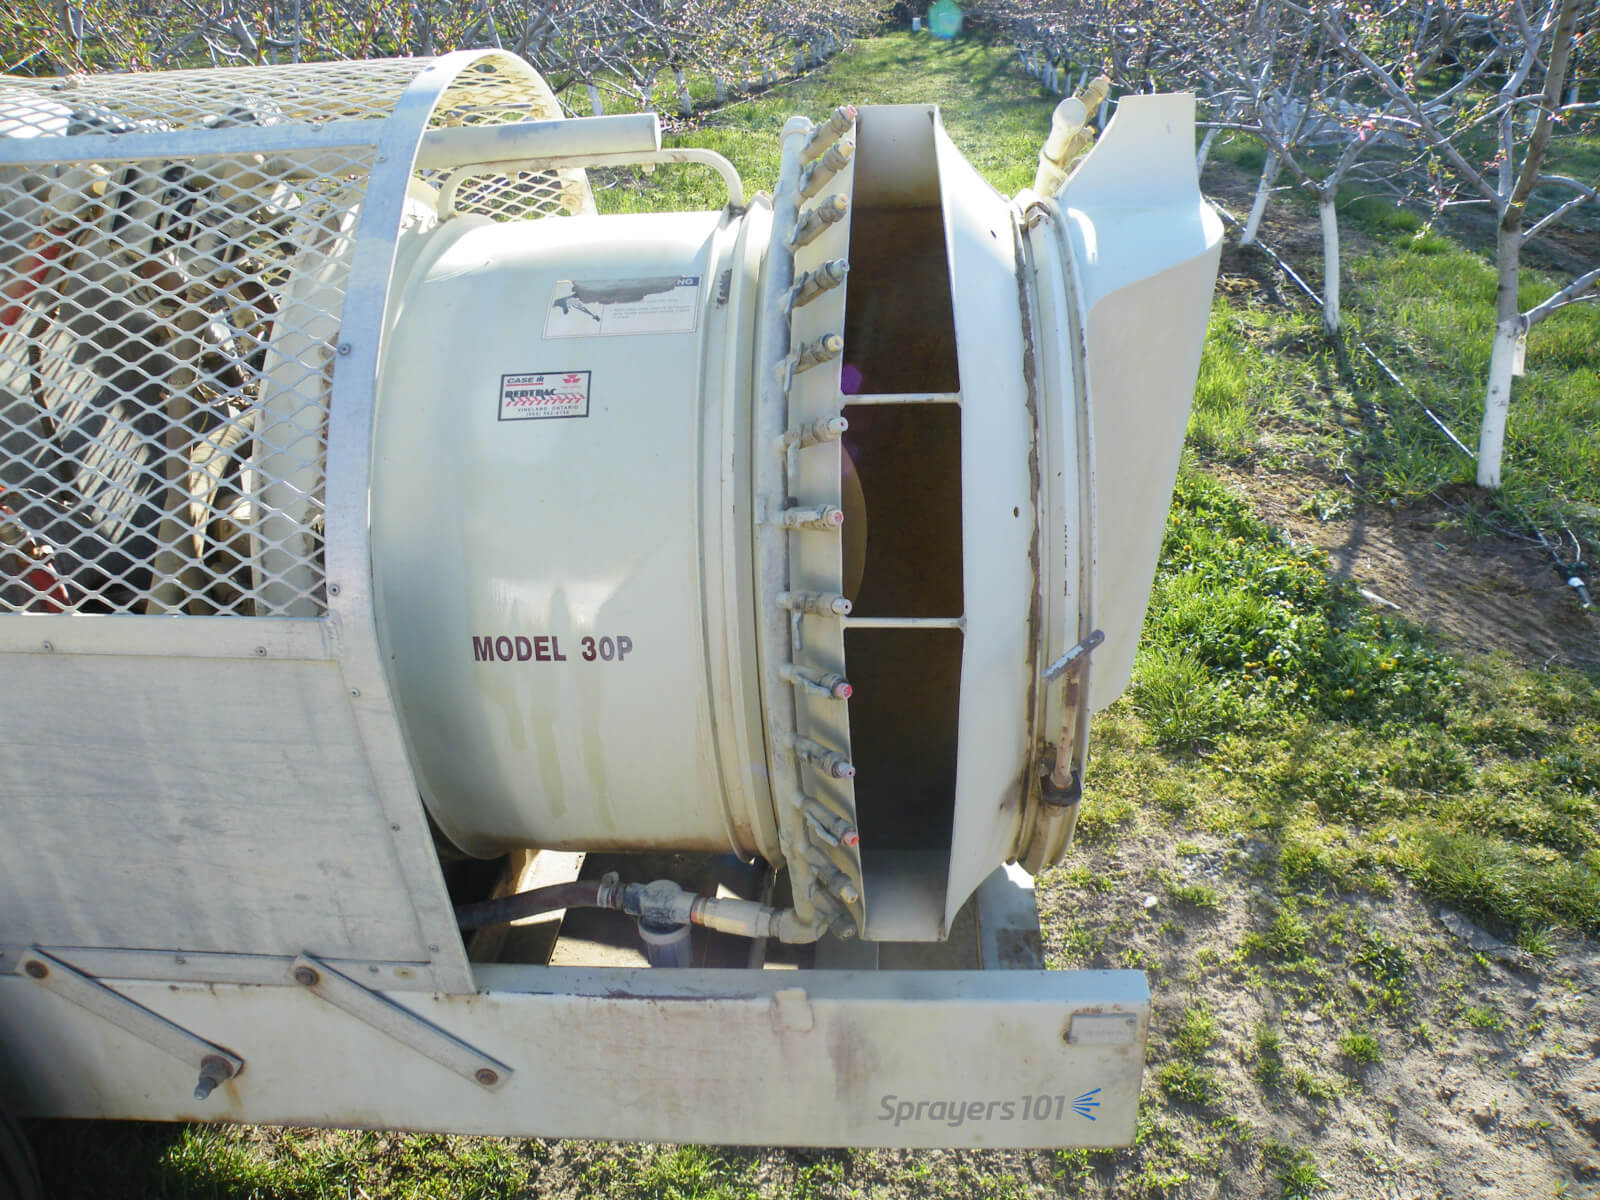
    When repositioning the air outlets on a Turbomist with no towers, aim the widest part of the outlet towards the densest part of the canopy, then turn off unneeded nozzles. Lubricate the nuts and bolts that hold the outlet bands tight.
    When repositioning the air outlets on a Turbomist with no towers, aim the widest part of the outlet towards the densest part of the canopy, then turn off unneeded nozzles. Lubricate the nuts and bolts that hold the outlet bands tight.

    Video Extras

    These videos are a bit long-in-the-tooth now, but the concepts are still sound. If you hear anything in the videos that contradicts what’s written in the article, go with the article. Live and learn. Thanks to Penn State, the University of New Hampshire and Chazzbo Media for producing these 2014 videos.

    This article will conclude in the second half:
    Optimizing Sprayer Air Settings – Part 2