“Sprayer calibration is an important part of any crop protection program.” Everyone says so, so it must be important. But what exactly are they asking you to do, and why?
When delivering presentations I often take the opportunity to ask audiences to define airblast sprayer calibration. Their responses cover a wide range of activities that can be rolled up into three related, but quite different, definitions:
Sprayer maintenance inspection
Adjusting sprayer configuration
Validating sprayer output
Ask a group of managers, sprayer operators, agrichemical reps, gov’t regulators and equipment manufacturers to define “calibration”. Be prepared for very different answers.
Traditionally, calibration refers to Number 3: Validating sprayer output, but all three are required to ensure a safe, effective and efficient application. Don’t panic – your workload didn’t just triple.
There is a time and a place for each of these activities. Some should be performed more often than others, but none of them are difficult. This is easier to accept when you realize that only a portion of the spray-day is actually spent spraying. Filling, travel time, cleaning and calibration-related activities are all essential components.
Let’s consider each activity.
Sprayer maintenance inspection
This is more maintenance than calibration (e.g. is it properly connected, is it worn out, is it plugged, is it leaking?). It should not be confused with spring start-up or winterization. For those lucky readers in temperate regions, “winterization” is preparing the sprayer for long-term storage post season… we just use antifreeze.
The maintenance inspection is the morning walk-around, no different from what any operator of heavy machinery must do before starting their work day. Learn more about sprayer inspection and download a helpful checklist in this article.
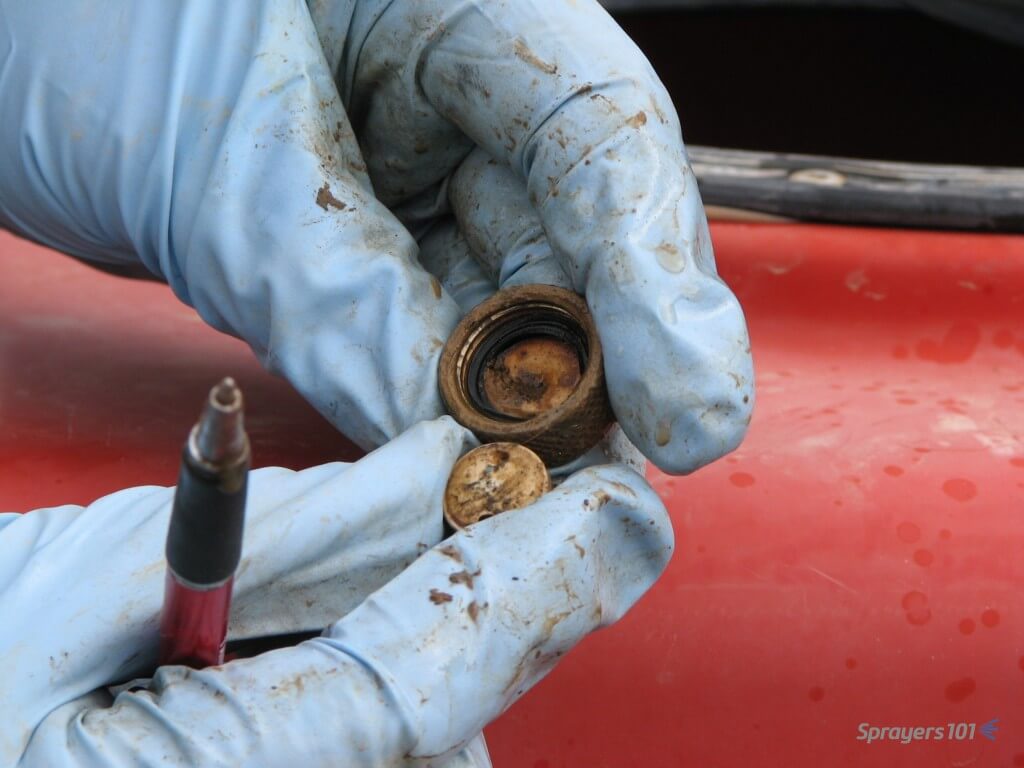
Here are some nasty disc & cores revealed during a calibration workshop. It certainly explained the poor performance the operator was complaining about. Is it time to replace yours? Photo credit – Dr. H. Zhu, Ohio.
Adjusting sprayer configuration
This is an ongoing process whereby an operator makes minor sprayer adjustments (e.g. pressure, travel speed, air settings) to reflect environmental conditions, the product’s mode of action and the nature of the target. Would you apply an insecticide to semi-dwarf pears in high wind using the same sprayer settings to apply a fungicide to nursery whips in high humidity? I hope not.
The process is more intensive at the beginning of the spray season and again around mid-season (e.g. petal fall or whenever the crop changes sufficiently to require a reassessment). It’s described step-by-step in many articles on this website as well as in Airblast101.
Yes, it requires an investment of time and effort, but the feedback makes subsequent adjustments faster, easier and more intuitive. There are strategies to reduce the number of adjustments required. Large operations can assign sprayers to blocks with similar crop architecture (e.g. one sprayer works large orchards, another sprayer works young or high-density orchards). Smaller operations can change the order in which crops are sprayed.
Validating sprayer output
This accounting activity ensures the sprayer is applying the intended rate at the intended speed. “Sprayer math” is really only theoretical; It helps the operator plan for how much pesticide and water must go in the tank and how long the job will require. How the sprayer actually performs may be a different story.
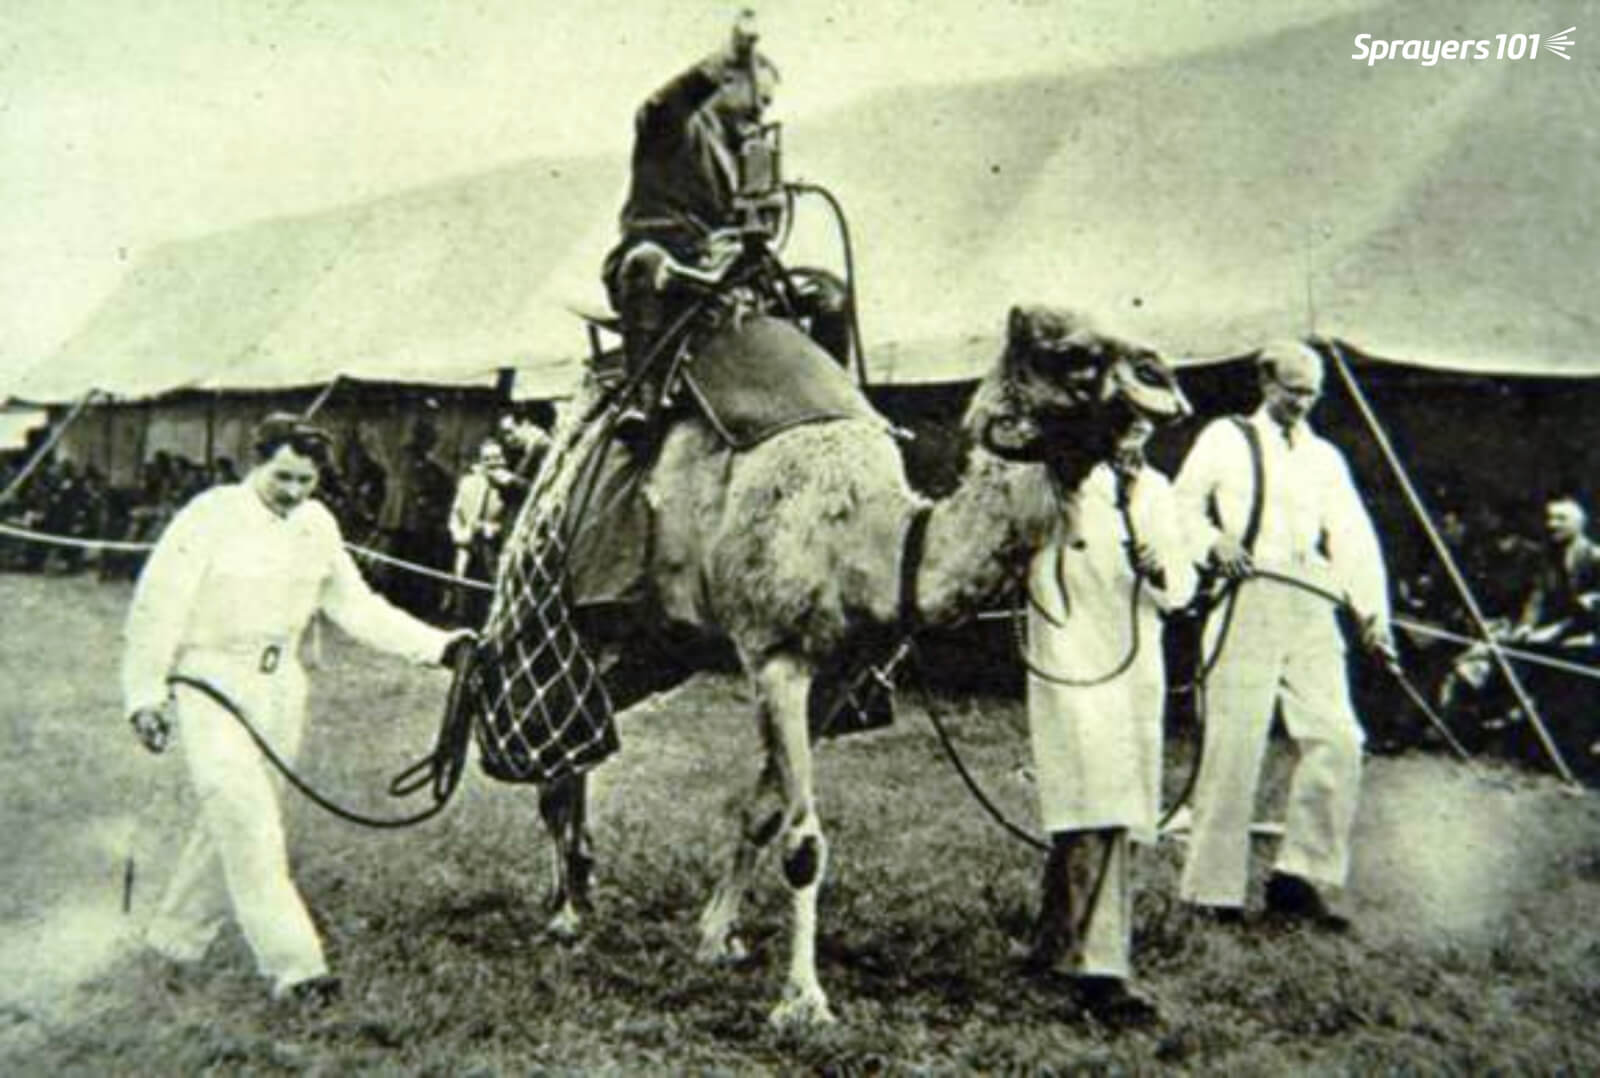
According to 1992’s “Tools for Agriculture” a horse can deliver 500 watts of power over 10 hours, but the camel can deliver 650 watts over six. And you thought establishing tractor speed was difficult. Photo Credit – R. Derksen, Ohio. Date and location of photograph is unknown.
Validating output, or calibrating, confirms that each nozzle delivers the desired rate and that the sprayer travels at the desired speed, so the crop receives the correct dose with no unexpected left-overs or shortages.
The operator should perform these activities at the beginning of the season and after any significant change to the sprayer set-up. Examples include new nozzles, new tractor tires, using a different tractor or after replacing a pump or any lines/hoses.
The validation (i.e. calibration) process is explained in our articles on testing airblast sprayer sprayer output and travel speed.
Conclusion
Be sure to perform all three calibration-related activities as required. This will keep records up-to-date, improve your spray coverage, and save you from unexpected sprayer malfunctions – almost all of which are preventable.
Greenhouse application equipment spans from the humble squirt bottle, to gas-powered foggers, to robots equipped with hydraulic vertical booms. The variety of spray equipment available reflects a variety of needs, just as a carpenter’s toolbox contains different tools designed to do different things. In order to get the most out of foggers and misters, it’s important to understand how they differ from “conventional” hydraulic spraying.
A greenhouse robotic vertical boom or “tree” sprayer
Mechanical and Chemical Spread
For many greenhouses, water is the carrier that dilutes and delivers the chemistry to the target. Water has a high surface tension and tends to bead on target surfaces. Dr. Heping Zhu (USDA, Ohio) created some amazing videos using controlled water droplets and both waxy and hairy leaves. In first video we see how water beads up on a waxy leaf, and as it evaporates, the area touching the leaf surface remains small. In the second, we see the droplet get hung up on a trichome (leaf hair) and evaporate while suspended above the leaf surface.
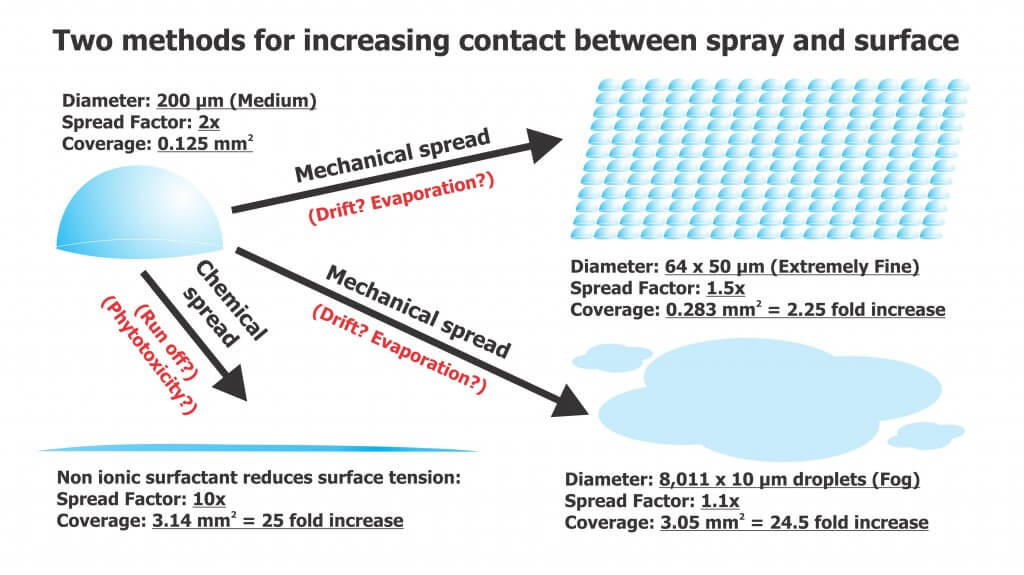
Neither situation is desirable since the goal of spraying is to maximize the level of contact between droplet and target. Contact can be increased via mechanical spread or chemical spread (see figure below).
The degree of chemical spread can be increased by adding adjuvants such as non-ionic surfactants to reduce surface tension. In the videos below we see the same controlled droplets with the same volume of liquid, but they now include a non-ionic surfactant. In the first video we see a greater degree of contact with the waxy target surface as the droplet spreads. In the second, the droplet does not get caught by the trichome, but splashes down onto the surface. Some product labels advise the inclusion of adjuvants and others are already formulated with them. In the case of surfactants, be aware of the potential for run-off and phytotoxicity.
Mechanical spread requires us to break a single, larger droplet into several smaller volumes to increase the degree of contact. This approach usually comes with a caveat about evaporation, but this is rarely a concern in a humid greenhouse. As for the risk of drift, once again, in greenhouses it is a different story than conventional spraying. Spray drift is desirable! Lateral air movement is very important to encourage plant canopy penetration and prevent droplets from merely settling on upward-facing plant surfaces. While some equipment generates its own air, the air currents in the greenhouse are often the primary means for suspended droplets to circulate throughout the space. In either case, air could be considered the carrier instead of water. Too little air flow, or gaps in circulation, will reduce coverage. Too much air flow (specifically, greenhouse air circulation) may cause plants to exhibit stunting.
Spray Quality (ISO)
Here’s how ISO/DIS (5681:2019 Equipment for crop protection — Vocabulary 3.2.1) defines the spray quality produced by misters and foggers:
(3.2.1.13) MIST: “Spray with volume median diameter between 50 µm and 100 µm.”
(3.2.1.14) FOG: “Aerosol spray with volume median diameter under 50 µm where the droplets are effectively suspended in air with little or no settling by gravity.”
These droplets do not behave like coarser droplets. For more information on droplet movement, survivability, and transfer efficiency, download Purdue Extension’s “Adjuvants and the Power of the Spray Droplet”.
Water sensitive paper has limited utility when diagnosing coverage from foggers. Sophisticated optical scanners may be able to detect deposits as small as 25 µm, but this is open to debate. Manufacturers do not support the use of papers when quantifying deposits less than 50 µm , and some draw the line at 100 µm.
In the following image, papers were used to diagnose coverage (from clean water) in a poinsettia greenhouse. The two papers on the right were located in the canopy and sprayed using a thermal pulse fogger and a hardware store style hand pump. The paper on the left was held directly in the path of the fogger while using the smallest nozzle provided with the unit. The spray enveloped the paper (and the person holding it). Close inspection showed tiny deposits, and the SnapCard app detected 4.5% coverage, but this greatly underestimates the actual deposition and does not account for the droplet count.
UV dyes are the preferred method for analyzing coverage from foggers.
Fogging and Misting Equipment
Greenhouse spray equipment can be classified by droplet size, but also by the spray volume they employ.
High Volume (HV)
These applications are performed at pressures ranging from 500 to 4,285 kPa (75 to 700 psi) employing flow rates of 3.9 to 5.7 L/min (1 to 1.5 US g/min). They use standard label rates to accomplish a dilute application by broadcasting droplets larger than 100 microns. The goal is to cover all surfaces without incurring run-off. Examples of HV application equipment include backpack sprayers, trailed sprayers and boom sprayers. Practice and self-calibration are necessary to achieve the desired results when using manual HV sprayers.
Targeted Low Volume (LV)
These applications are performed at high pressures around 20,685 kPa (3,000 psi) employing flow rates approaching 1 L/min (0.26 US g/min), covering 93 m2 (1,000 ft2). They apply reduced rates over a given area and create droplets between 25 and 100 µm. These are concentrated sprays that do not result in wet foliage. LV applications are particularly good in high-humidity environments, when it is desirable to minimize the moisture on leaves. Examples of LV application equipment include aerosol cans.
Ultra-Low Volume (ULV)
These applications employ flow rates approaching 2 L/min (0.52 US g/min), covering 930 m2 (10,000 ft2). They require concentrated solutions, but apply reduced rates per area using droplets less than 25 µm. ULV applications will not raise greenhouse humidity and are a good choice when days are short and nights are long. They are also an excellent way to apply disinfectants for complete space sanitation before starting a new crop. It is important to ensure vents are closed and fans are off during sanitation. Examples of ULV application equipment include total release cans, auto foggers and thermal pulse foggers.
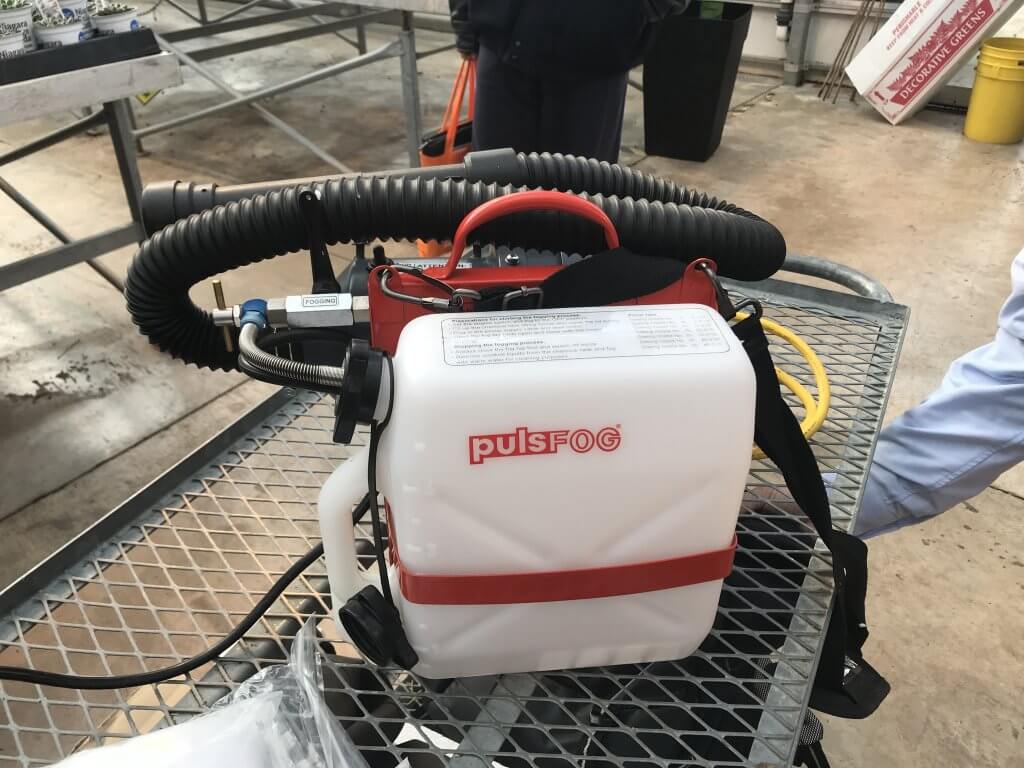
PulsFOG hand-held ULV cold fogger
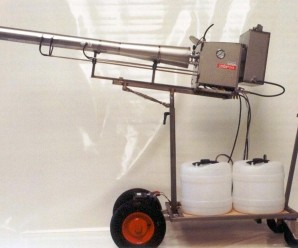
Thermal pulse foggers are unlike other ULV equipment and warrant special consideration. The design of the pulse fogger has remained virtually unchanged since the 1940’s. Smaller, 24 hp machines are used in smaller operations but range up to large 175 hp machines. Tank size ranges from 10 to 50 L, where 10 L should be enough to cover 4,645 m2 (50,000 ft2) in about 10 minutes, depending on crop density. Their range is about 35 m (115 ft) from the point of release.
Thermal Pulse foggers do not create aerosol using air shear – they use combustion (80 to 100 explosions per second) to shatter spray into a fog and propel it via positive pressure. Heat is a by-product of the engine, making it an unsuitable method for applying biological products.
However, water-cooled foggers such as Dramm’s Bio Pulse Fogger reduce the exhaust temperature below 100 °C to make the application bio-rational. This has the added advantage of making droplet sizes more consistent and preventing spray from evaporating too quickly before it diffuses to the target.
Dramm Bio Pulse Fogger
Using a Fogger
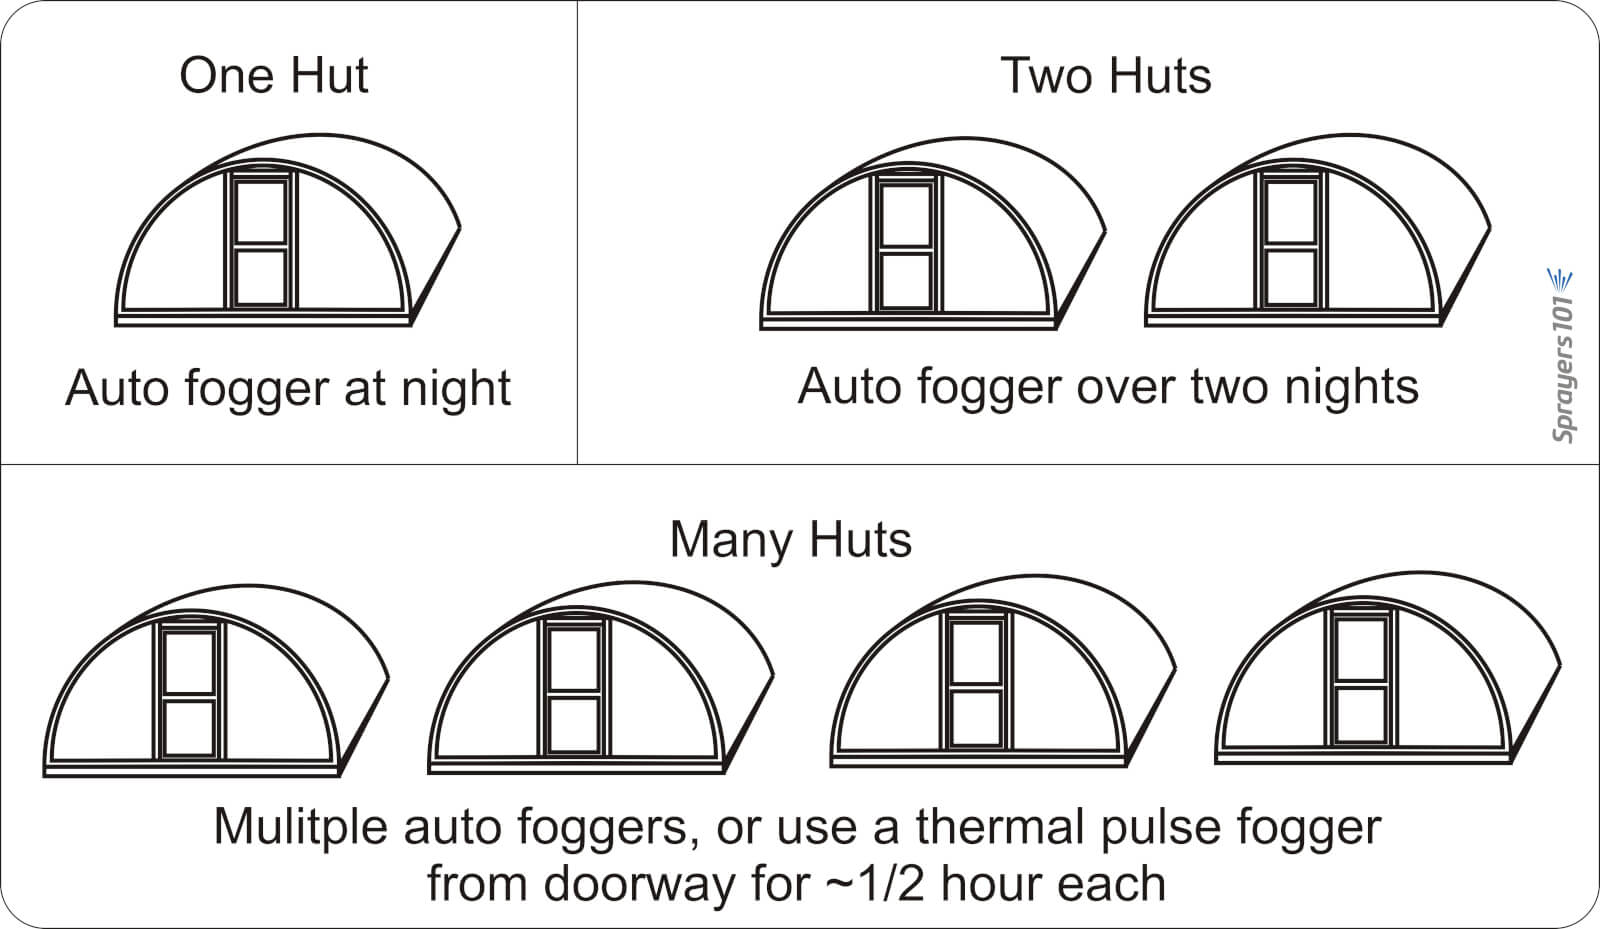
Dramm recommends that operators use approximately 1 L of carrier in 5 L of spray mix, but a higher proportion of carrier would be required for more viscous products. Start with a full tank of clean, high grade gasoline and once the fogger has been started, run it continuously until the application is complete. Leave it running even when moving between Quonset huts (see below).
Know when to use a pulse fogger versus an auto fogger. Auto foggers are convenient because the operator can set them and leave. However, in the case of multiple huts, it is more efficient and timely to use a thermal pulse fogger.
Do not leave the manual fogger running unsupervised as an auto fogger: If they stay stationary, or aim directly at the canopy (as in hydraulic spraying), they could drench and potentially damage nearby plants.
When fogging, aim between the plants, such as the alleys and between hanging plants. This allows the fog to expand and permeate canopies for the best coverage. When spraying is done, be sure to release the pressure created in the spray tank to prevent accidental back flow into the gasoline tank.
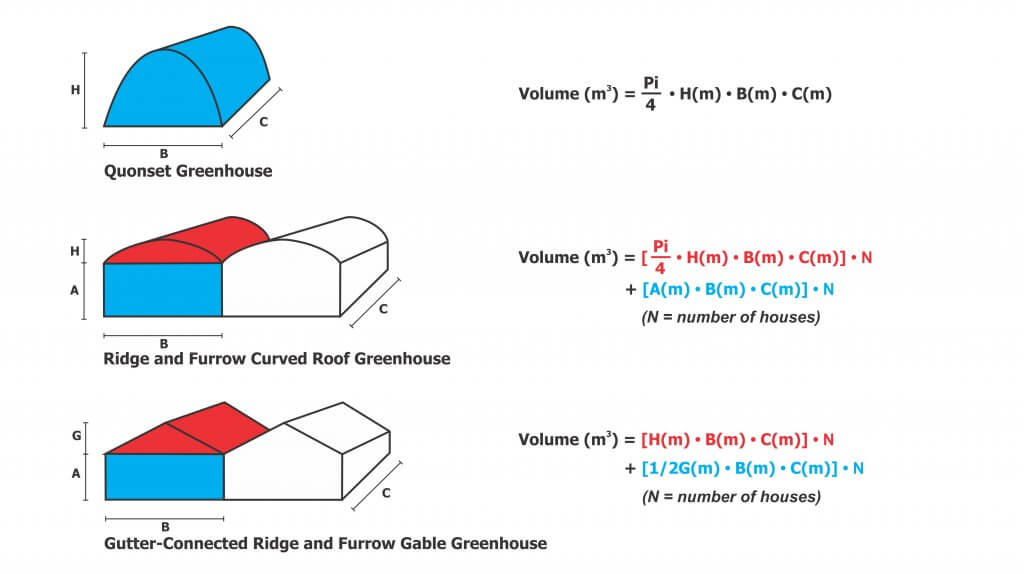
And, because it’s convenient to include the math in this article, here are the formulae for calculating greenhouse volume to help you determine rates.
Care and Maintenance
HV, LV and ULV equipment requires model-specific cleaning and maintenance, according to manufacturer’s instructions. Even when sprayers are kept in prime condition, they are only as good as the operator’s understanding. When the wrong product is applied by the wrong machine using the wrong method, operators risk poor control, crop damage and increased potential for pesticide resistance. For more information, read the instructions that came with your sprayer, or contact the manufacturer.
Thanks to Louis Damm and Dr. Heping Zhu for their contributions to this article.
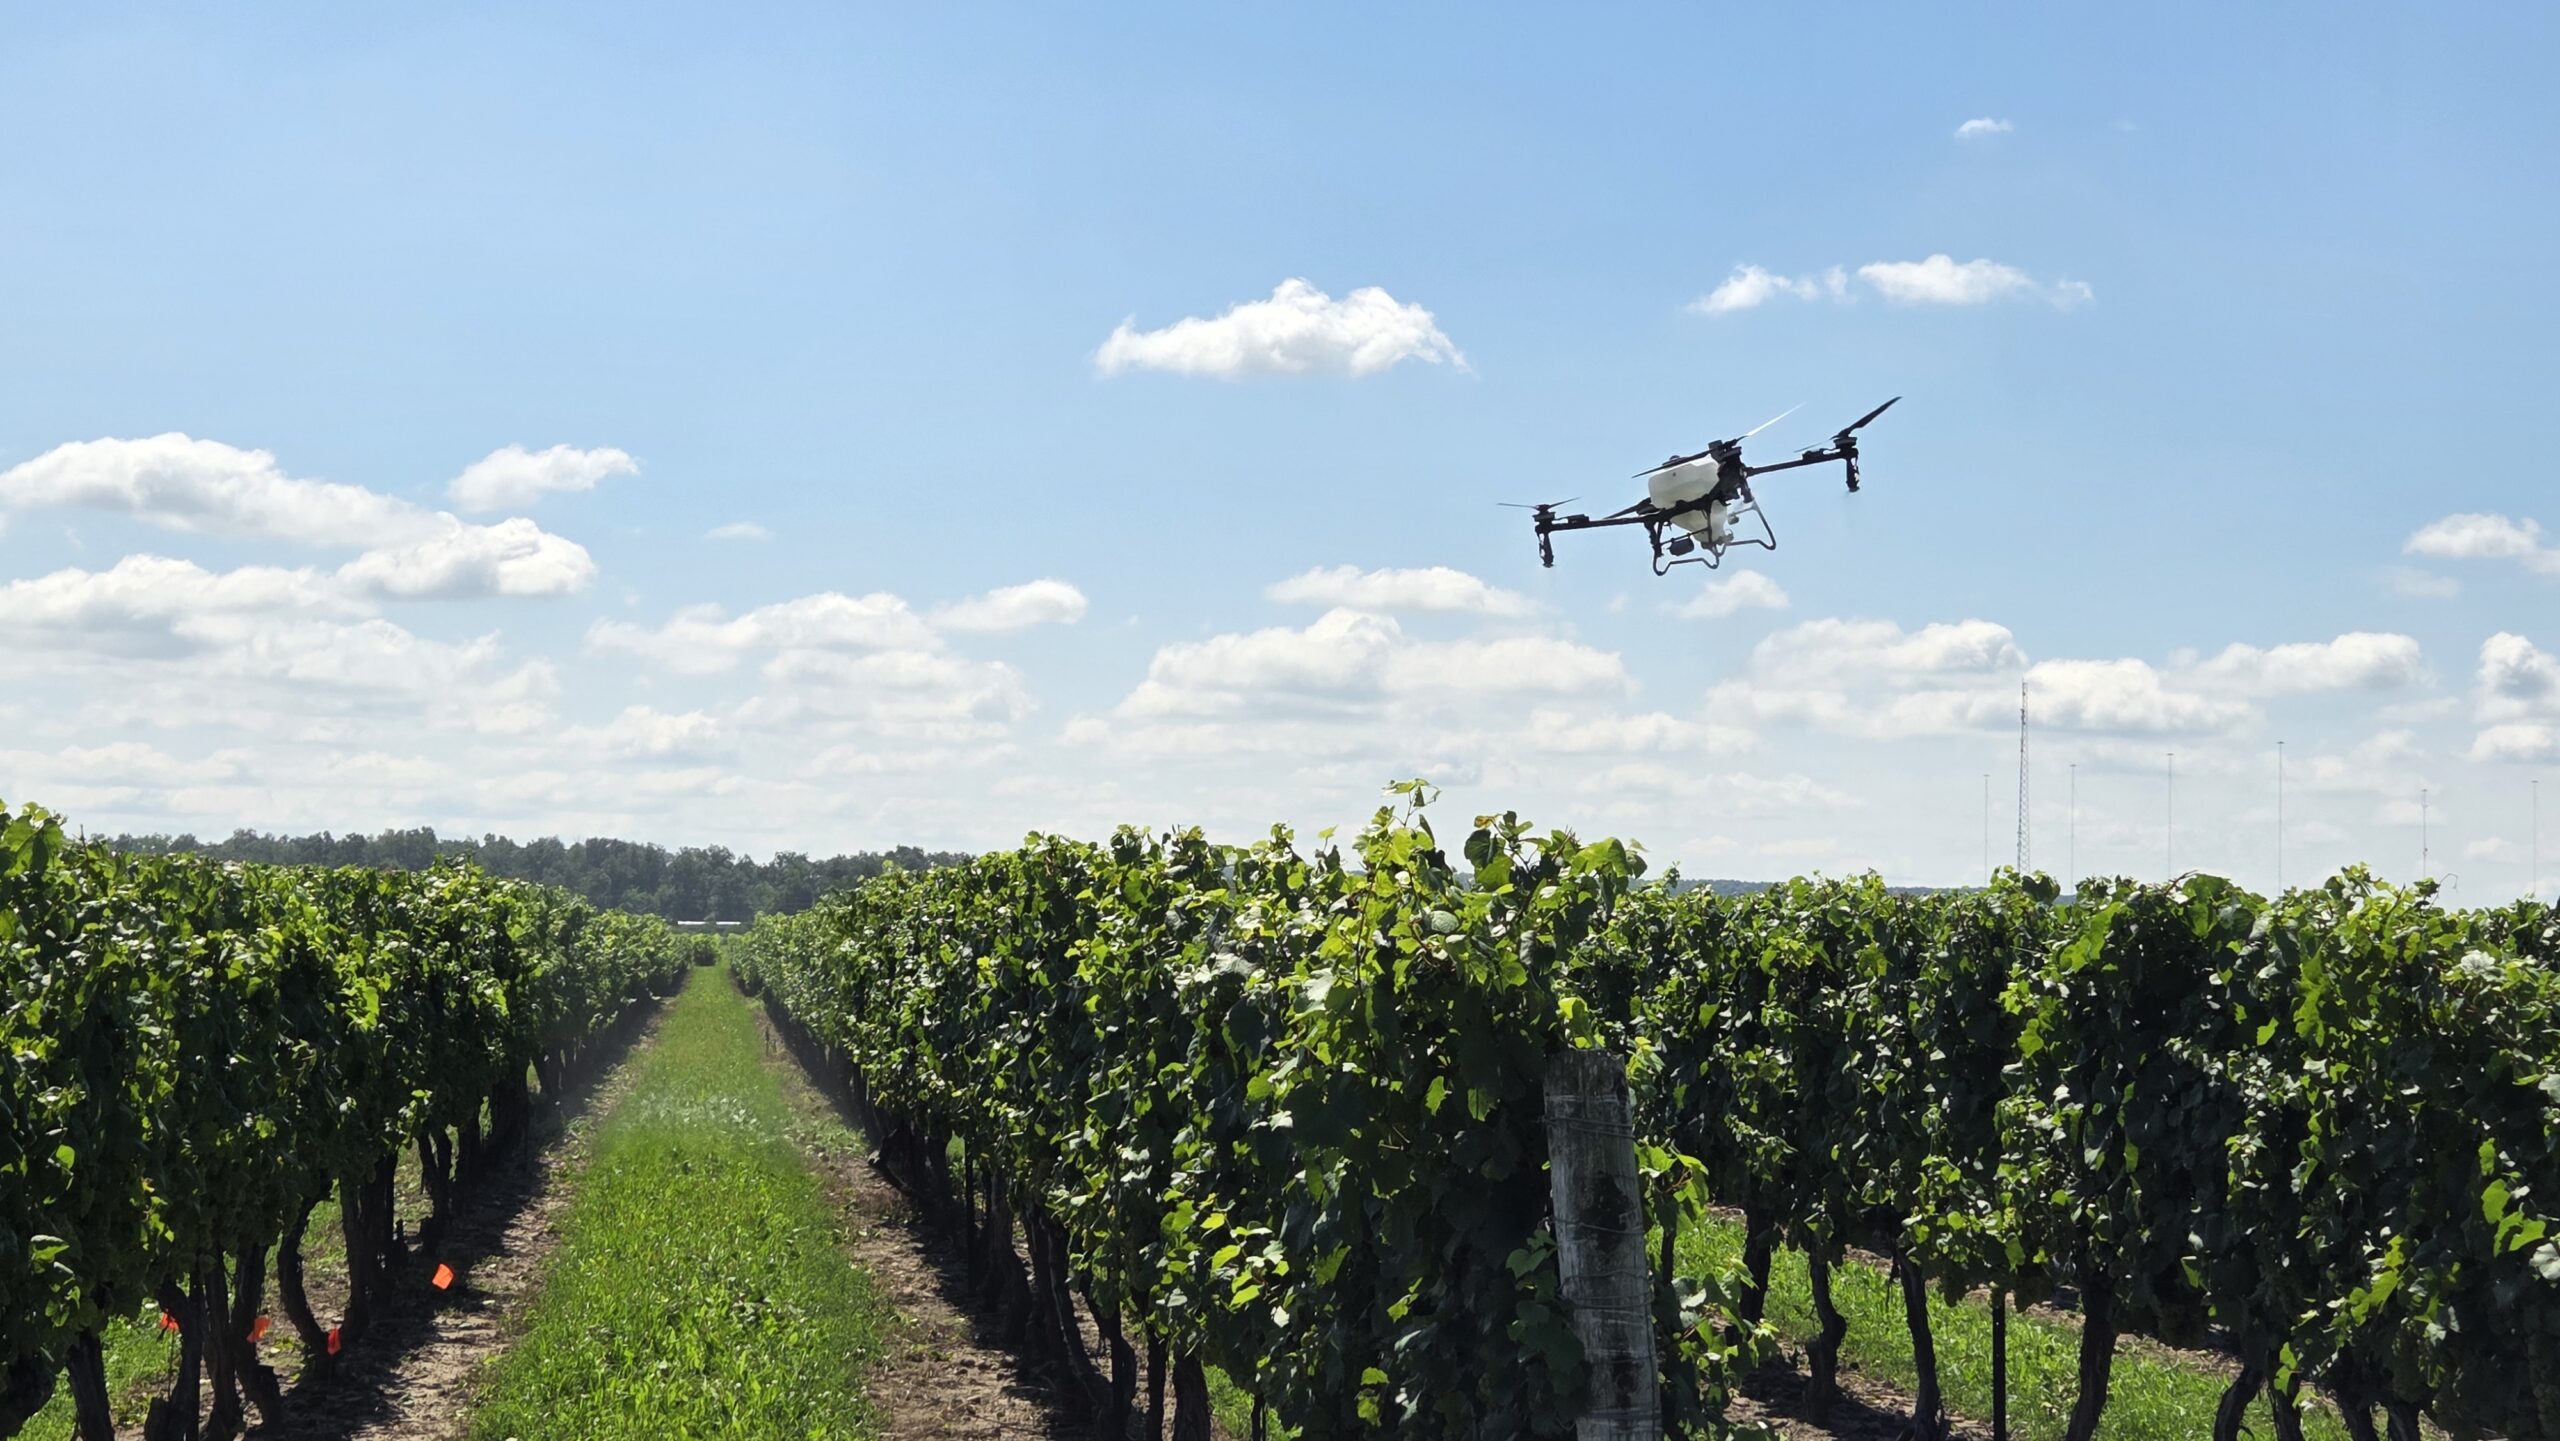
Drone operational settings such as capacity, speed, and swath width are useful figures for calculating productivity, but they only describe the airborne portion of the job. A commercial application business must also transport water, mix product, charge batteries, and establish an efficient staging area that is both safe for operators and maintains drone connectivity. If any of these functions fall behind, productivity suffers.
We consulted several mission records to develop a productivity calculator that can model a range of scenarios. We assumed a shuttle (back-and-forth) flight pattern to apply successive spray swaths for uniform coverage of a treatment area.
How to use
In this, version 4.0 of our drone productivity calculator, we’ve expanded the functionality to include several tendering options. If you are uncertain what the variables mean, consult this handy instruction manual to walk you through the process.
Use it as a planning tool, or simply as a way to explore the impact of different operational settings on mission productivity. We propose adjusting variables one at a time to determine their effect. You can then compound the effect by changing another, or return to the base value and choose another variable to manipulate. In this way you can explore the relative influence of each variable on the overall job.
Which factors matter most?
The relative impact of each operational setting (or the geometry of the target area) on productivity is situation-specific. Nevertheless, here are some generic observations:
While swath width and flight speed play a role, both are limited by the agronomic realities of the job. So, while you can change them in the calculator, it does not follow that the results of the application will be successful.
Water rate (e.g. L/ha) has an impact on productivity, but once again there are agronomic considerations. Too low a volume can compromise product efficacy and contribute to off target drift, and quite often the minimum volume is stipulated on the product label.
The drone’s tank capacity depends on the model, but maxing it out may not be the best option. Some large drones suffer reduced battery life and slower acceleration when filled completely. Note that when the user forces a refill/battery swap, there will be spray mix left in the drone. It is prudent to minimize this residual by not overfilling the drone in the first place.
The ferrying distance between where the drone empties and the staging area a critical productivity factor, so minimizing it is a reasonable objective. Doing so can mean additional sorties, which require additional refills and battery swaps. Small improvements here compound into big impacts, but pay close attention to see if the additional sorties are worth the time savings.
The number of operators have a significant effect on productivity. If a solo operator has to retrieve additional water, or move the tender truck to a new location, the drone isn’t spraying.
Batteries – A potentially limiting factor
The calculator assumes that a sufficiently charged battery is ready whenever the drone returns to the tender, so battery charging does not extend the entered refill and battery-swap time.
In practice, flight endurance can change dramatically with payload. For example, a heavily loaded aircraft may fly for only a few minutes, while the same aircraft may remain airborne much longer with an empty tank. Repeated short, high-load sorties may therefore consume charged batteries faster than they can be recharged.
If the battery inventory, chargers, generator capacity or electrical supply cannot keep pace, the crew may eventually have to wait for batteries, reducing actual productivity below the calculator’s estimate. Additional batteries, higher-capacity charging equipment or improved generator capacity may be required to sustain the projected workflow.
Thanks to Mike Verhoog (Drone Spray Canada) and Dr. Michael Reinke (Michigan State) for discussions contributing to the design of this model.
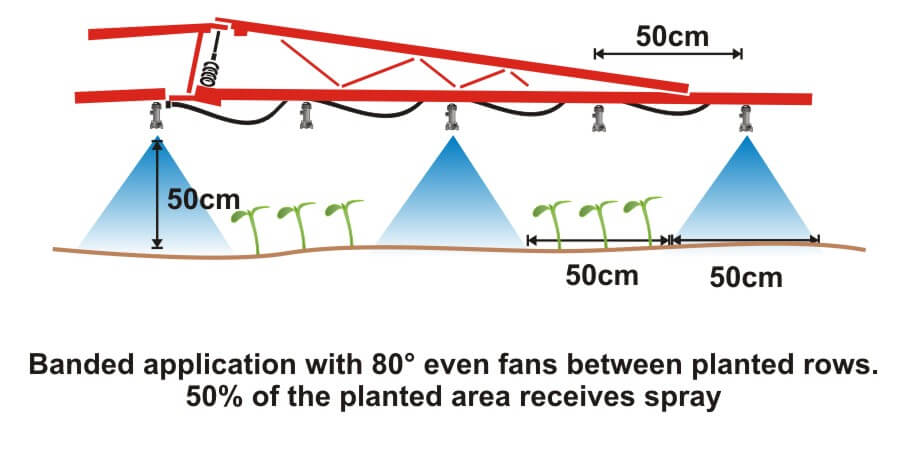
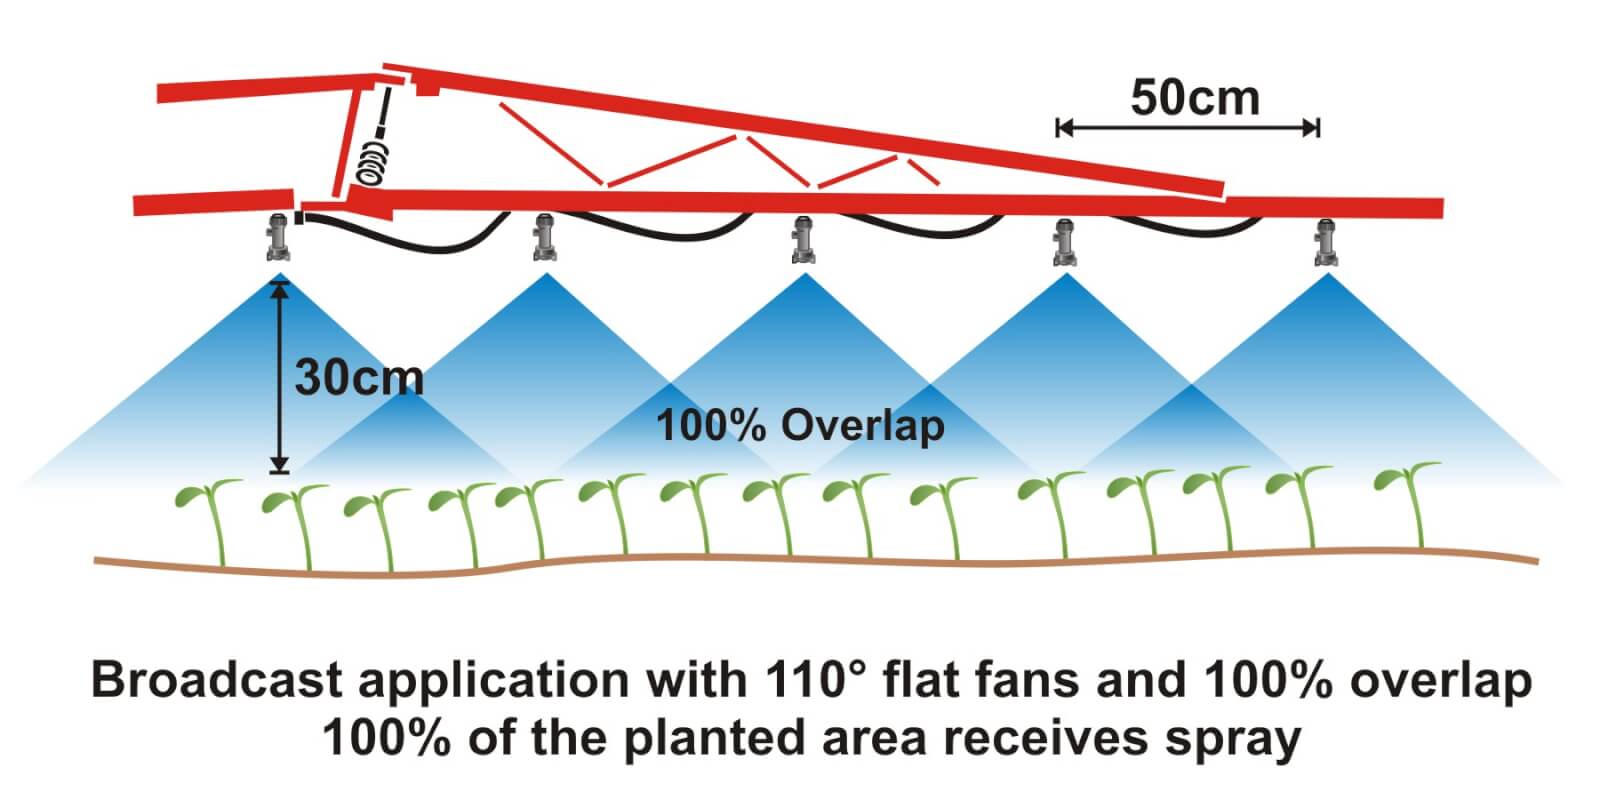
Where crops are planted in rows, growers can save on chemical costs and reduce potentially wasted spray by performing banded applications. A banded application is treating parallel bands (Figure one), unlike a broadcast application where the entire area is treated (Figure two). This means only a portion of the field or orchard/vineyard floor receives spray, so the total amount of product applied per hectare (or per acre) should be less for banded than for broadcast.
Figure 1Figure 2
Banded applications are used in many situations, including:
Applying herbicides right over a crop during planting, both for pre-emergent or post-emergent crops.
Applying insecticides/fungicides by “directed spraying” using drop hoses or row kits; the latter is pictured in Figure three.
Carefully spraying herbicide between the rows to control weeds in the alleys of an established crop (Figure one).
Applying herbicide under fruit trees or grape vines to control weeds (Figure four).
Figure 3Figure 4
It’s easy to make mistakes when calculating product rates for banded applications and these can be costly errors: too little means poor control and too much means wasted product and possible crop injury. This article describes how to calculate sprayer output and product rate for common banded applications.
Step One: Determine broadcast volume
Pesticide labels typically list broadcast product rates (e.g. amount of formulated product per hectare or acre). In this example, let’s say the label recommends a broadcast product rate of 500 ml of formulated herbicide applied using 100 litres of spray mix per hectare (i.e. added to 99.5 L water).
Step Two: Establish sprayer settings
Select a travel speed that is safe, gives decent efficiency and doesn’t compromise coverage. For this example, we’ll say the sprayer moving is at 8.0 km/h.
Select a band width that completely covers the target row and some of the adjacent area where control is desired. Band width should be measured along the ground for soil-applied products or along the top of plants for post-emergence products. We’ll use Figure one for our settings: bands are 50 cm wide on 100 cm centres. We’ll say that a single nozzle swath can treat the band, and that we’re spraying 2 hectares of planted area.
Step Three: Calculate the banded sprayer output
We can calculate how much of the planted area actually receives spray using this formula:
[band width (cm) ÷ row width (cm)] x total planted area (ha) = actual sprayed area (ha) [50 cm ÷ 100 cm] x 2 ha = 1 ha
For completeness, here’s the US formula: [band width (in) ÷ row width (in)] x total planted area (ac) = actual sprayed area (ac)
From this we now know that we should be able to go twice as far on a tank spraying a banded application as we would a broadcast, because we’re only spraying half the planted area.
Step four: Calculate the nozzle output
Use the following formula to convert the broadcast output into the banded output:
[broadcast output (L/ha) x travel speed (km/h) x (swath width (cm) ÷ number of nozzles per swath)] ÷ 60,000 = nozzle output (L/min) [100 L/ha x 8 km/h x (50 ÷ 1)] ÷ 60,000 = 0.67 L/min
For completeness, here’s the US formula: [broadcast output (gal/ac) x travel speed (mph) x (swath width (in) ÷ number of nozzles per swath)] ÷ 5,940 = nozzle output (gal/min)
If multiple nozzles were contributing to the swath, such as in figure three or figure four, this formula will account for it. You still mix the labelled product rate at a ratio of 500 ml of herbicide to 99.5 L water, but as we determined in step three, we should be able to spray twice the planted area using a banded application as we would a broadcast application.
Warning! Watch your units. You may be familiar with other formulae for calculating your output. Do not mix and match formulae or parts of formulae. For example, here is another Metric option for determining L/min. It employs different units so it requires a different constant:
[broadcast output (L/ha) x travel speed (m/min) x (swath width (m)) ÷ number of nozzles per swath)] ÷ 10,000 (m2/ha) = nozzle output (L/min)
Step Five: Use the nozzle catalogue to find the right nozzle
Using a nozzle manufacturer’s catalogue, select a nozzle that gives the desired spray quality (usually coarser for herbicides) and will produce the 50 cm swath we’re looking for (which can be adjusted a little using boom height). Always choose to operate a nozzle in the middle of its pressure range.
Step Six: Calibrate the sprayer (i.e. double-check)
Follow your typical calibration process and make minor adjustments until the nozzle discharge per minute results in the desired banded output. A rate controller will handle this on larger sprayers, but if you don’t have one you can make small adjustments to speed and pressure until the desired output is achieved. Ideally, if your math was right, these changes won’t be needed.
When performed correctly, banded applications are a great way to focus your efforts on the target, saving time and money.
Other Resources
Download this booklet on spraying potatoes using banded rows. Or try our calculator:
OrchardMAX won the 2016 Canadian Agri-Marketing Association’s “Certificate of Merit” in the Mobile Apps Category.
OrchardMAX is a free decision-support tool that helps apple growers match airblast sprayer output to the size, shape, and density of an orchard canopy.
Rather than applying the same volume and pesticide dose to every block throughout the season, OrchardMAX uses the principles of Crop-Adapted Spraying to estimate settings appropriate for each orchard block. The objective is more consistent spray coverage with less avoidable waste. Ontario and Nova Scotia orchard trials demonstrated seasonal spray-volume savings of approximately 20 to 35%, without significant differences in pest activity and reported or fruit quality.
What OrchardMAX does
Using information supplied by the operator, OrchardMAX can:
Account for changes in canopy size, shape, and density
Estimate an appropriate carrier volume and pesticide dose
Suggest nozzle flow rates and sprayer settings
Calculate the amount of formulated product required per tank
Estimate work rate, tank requirements, and potential savings
What OrchardMAX does not do
OrchardMAX is a decision-support tool, not a substitute for calibration, operator judgement, or the pesticide label. It will not:
Recommend a rate above the pesticide label
Calibrate the sprayer
Confirm that adequate spray coverage was achieved
Account fully for wind, temperature, or relative humidity
Recommend less than 400 L/ha, approximately 42.5 US gal/ac
Recommend less than half the labelled pesticide rate
The results are only as reliable as the information entered. Operators must still maintain and calibrate the sprayer, match air settings to the canopy, work in reasonable weather conditions and confirm coverage using water-sensitive paper.
How to use it
For each spray scenario:
Select or enter the sprayer and orchard block.
Describe the current canopy size, shape, and density.
Enter the labelled pesticide rate and planned spray mixture.
Review the proposed carrier volume, pesticide dose, nozzle rates, and number of tanks.
Configure and calibrate the sprayer.
Confirm the resulting coverage in the orchard and adjust where necessary.
Start with a few representative blocks. Compare OrchardMAX recommendations with your current program, evaluate coverage, and make incremental changes as you gain confidence.
History
The original app was an excel-based tool created in 2010 and later developed into an app for iOS and Android systems by AgNition Inc. with funding from Growing Forward 2 in 2016. Compatibility with iOS and Android ended in 2020. We have now rebuilt the same functionality into this online version of the app.