Category: Tables & Apps

Calculators, tables and applications

  • Evaluating the return on investment of optical sprayers for horticulture

    Evaluating the return on investment of optical sprayers for horticulture

    Investing in an optical sprayer for horticulture is not a straightforward financial decision. Compared with a conventional boom sprayer, the upfront capital cost is substantially higher, often by an order of magnitude, and most commercial systems require an annual software or service subscription to operate. Despite these barriers, adoption is accelerating, and many growers who have made the investment report very positive outcomes.

    To help clarify when and where this technology makes financial sense, I developed a calculator to estimate the return on investment (ROI) of optical sprayers under a range of production scenarios. The goal of this tool is not to promote the technology, but to provide growers and advisors with a structured way to evaluate whether it fits their specific operation.

    Note: This calculator was designed for onion and carrot production in Ontario, Canada. Model parameters can easily be adjusted reflect other production systems. However, if you need assistance making these changes you can contact me by email.

    How to use the calculator

    At first glance, the calculator may appear overwhelming. It contains many data points and requires a fair amount of information to be entered. This level of detail is intentional: the objective was to strike a balance between simplicity and realism, avoiding oversimplification that could lead to misleading conclusions.

    The calculator runs directly in your web browser, and nothing needs to be downloaded or installed. Results update automatically as you type. The values you enter are saved only in your own browser, so they will still be there the next time you open the calculator on the same device. They are not sent to or collected by Sprayers101.

    Every input field and every result has a short explanation. Hover over it, or tap it on a phone or tablet, to see what it represents. Labels with a dotted underline have an explanation. Each section also has a ? button beside its title, which opens a more detailed description of what the section does and how its inputs affect the results.

    Inputs

    Enter your information in five panels:

    • Report details (optional): name, company and date for the downloaded report.
    • Sprayers cost and capacity: purchase prices, subscription, tractor cost, maintenance and field capacity.
    • Your crops: area, yield, expected yield increase, sale price, harvest cost and hand weeding hours.
    • Herbicide programs: price, weed cover, applications and rates for each product. Products can be added or removed.
    • Financing (optional): needed only for NPV, IRR and loan payments.

    A switch at the top converts all inputs between metric and Imperial (US) units.

    Results

    The results panel shows the net annual benefit of the optical sprayer, where it comes from, and the payback period and return on investment.

    Three tables follow:

    • Financial metrics: payback, ROI, NPV, IRR and loan payments in one place.
    • Sensitivity analysis: how the results change with different areas of the two crops. The colour bands are for reference only and do not represent any standard.
    • Conventional vs. optical: both sprayers side by side, per year.

    Download results creates a printable report, and Reset restores the example values.

    Default Values

    The calculator is pre-filled with generic values from grower discussions and informal benchmarks. They are placeholders for general reference only and are not accurate enough to support financial decisions. The output is only as good as the inputs, so replace the defaults with your own operation’s data.

    Insights from scenario testing

    Even using rough approximations, several consistent patterns emerge from adjusting the calculator inputs:

    Herbicide savings alone rarely justify the investment

    In high-value horticultural crops, herbicide costs are often a relatively small portion of total production costs compared with labor, equipment, and the overall value of the crop. In many cases, any reduction in herbicide expenditure is largely offset by increased tractor hours resulting from slower operating speeds and narrower effective spray widths typical of optical sprayers.

    Labor savings can be decisive

    When the technology results in meaningful reductions in hand-weeding, the financial impact can be substantial. This is especially true in crops such as onions, where hand-weeding is both costly and difficult to source reliably. In these situations, labour savings alone can drive a favorable ROI.

    Yield protection may outweigh cost savings

    Several growers report stand losses and weakening associated with herbicide phytotoxicity as a major production risk. By limiting spray exposure to crop plants, optical sprayers can significantly reduce or even eliminate this issue. In high-value systems, relatively small yield gains resulting from improved crop safety can translate into revenue increases large enough to justify the technology, even if other savings are modest.

    Scale matters

    When evaluating advanced sprayer technologies, scale becomes a decisive factor. The high capital investment and ongoing service fees may be difficult to justify for small, and in some cases, even medium-sized operations.

    What about herbicide resistance?

    The long-term implications of optical sprayers for herbicide resistance management are still uncertain. Recent research from the University of Arkansas has raised concerns in field crop systems, suggesting that poorly optimized optical spraying can result in short term gains, but these can be outweighed over time by higher weed escape rates compared with broadcast applications. If these escapes are allowed to grow and set seed, rapid seedbank replenishment and accelerated resistance development may occur.

    This highlights an important limitation of short-term ROI calculations. A single-year economic benefit may look attractive, but if the system allows even a small number of weeds to consistently escape and reproduce, the long-term consequences can be severe.

    On the other hand, optical sprayers may eventually enable new resistance-management strategies. It is possible that new active ingredients, higher labelled rates, or novel use patterns could be registered specifically for targeted spraying in horticultural crops that would not be feasible with broadcast applications. Such developments could significantly improve resistance management tools. As always, it is essential to remember that the label is the law: only registered products and rates may be used, regardless of perceived crop safety.

    ROI implications beyond herbicide spraying

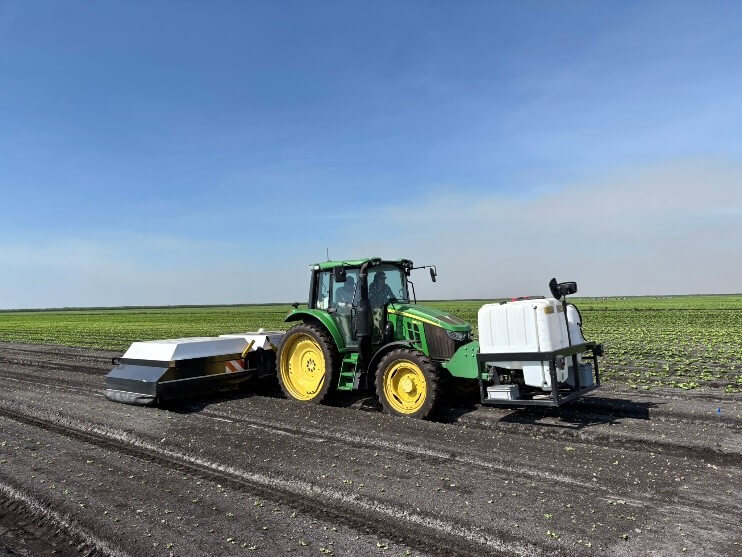
    Optical sprayers can deliver value beyond herbicide applications, even though weed control is their primary use. These additional uses may improve overall ROI. However, because their economic impact is still difficult to quantify, they have not been included in the calculator.

    Depending on the model, additional value-generating capabilities can include:

    • Creation of weed maps: Some systems can generate weed maps automatically while spraying, at no additional operational cost. These maps can support future management decisions.
    • Application of fertilizers and other pesticides: Although optimized for herbicides, optical sprayers may also be used to apply other inputs, such as fertilizers or non-herbicide pesticides.
    • Crop thinning: Certain manufacturers have developed algorithms for automated crop thinning, particularly in crops like lettuce.

    Conclusion

    Even using approximate inputs, it is clear why optical sprayer adoption is expanding rapidly in Canada.

    • For medium to large-scale operations, the ROI can be highly attractive, and the range of potential benefits continues to grow.
    • As the technology matures, more equipment options are emerging to serve a wider diversity of crops and farm sizes.
    • Manufacturers are introducing wider and more flexible platforms, and Ontario-based companies are actively developing alternative machines and service-based business models that may better suit smaller operations.

    It is difficult to argue that optical spraying is a passing trend. While it’s not a universal solution and must be implemented carefully, the technology is clearly here to stay. It will reshape weed management and production economics over the long term.
  • Mode of Action and Spray Quality

    Mode of Action and Spray Quality

    The decision on which application method is best for herbicides boils down to two main factors: (a) target type and (b) mode of action. In general, it’s easier for sprays to stick to broadleaf plants on account of their comparatively larger leaf size and better wettability compared to grassy plants. There are exceptions, of course – at the cotyledon stage, broadleaf plants can be very small and a finer spray with tighter droplet spacing may be needed. Water sensitive paper is a very useful tool to make that assessment. Imagine if a tiny cotyledon could fit between deposits – that could be a miss!

    Some weeds are also more difficult to wet, and those may also need a finer spray or a better surfactant for proper leaf contact. An easy test is to apply plain water to the leaf with a spray bottle. If the water beads off or the droplets remain perched on top in discrete spheres, the surface is considered hard to wet. Most grassy weeds are hard to wet, while most broadleaf weeds are easy to wet.

    Grassy weeds are an especially difficult target because they have smaller, more vertically oriented leaves, and almost without exception are more difficult to wet than broadleaf species. All these factors call for finer sprays for effective targeting and spray retention.

    Broadleaf weeds usually have more horizontally oriented leaves which also happen to be larger. As a result, they can intercept larger droplets quite efficiently.

    There are about thirty mode of action (MOA) groups among the herbicides with about ten accounting for the majority in Canadian prairie agriculture. It’s probably an over-simplification to categorize them into just two groups – systemic and contact.  But that grouping goes a long way to making an application decision.

    Contact products (MOA Group 5, 6, 10, 14, 22, 27) must form a deposit that provides good coverage. Good coverage is an ambiguous term that basically means that droplets need to be closely spaced and cover a significant proportion of the surface area because their physiological effects occur under the droplet, and don’t spread far from there. One way to generate more droplets is to reduce droplet diameter, another is to add more water. A reasonable combination of both is ideal because simply making droplets smaller creates issues with evaporation and drift.

    Systemic products (MOA Group 1, 2, 4, 9) will translocate within the plant to their site of action after uptake. As a result, coverage is less important as long as sufficient dose is presented to the plant. In practice, this means coarser sprays and/or less water may be acceptable.

    When two factors are combined, either in a tank mix or a weed spectrum, the more limiting factor rules. Application of a tank mix or product that is active on both broadleaf and grass plants will be governed by the limitation placed on grass targets. A tank mix comprised of both systemic and contact products is governed by the limitations placed on contact products.

    A factor we should also consider is soil activity and the presence of residue. Studies have shown that soil-active products are relatively insensitive to droplet size. But if they have to travel through a layer of trash to get to the soil surface, more application volume is the best tool.

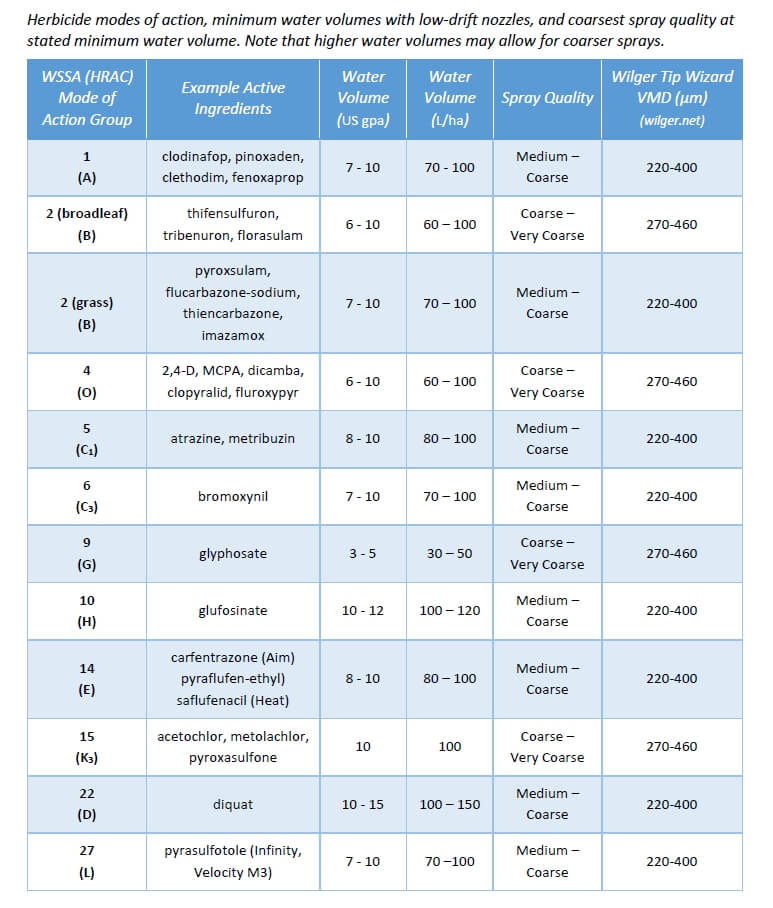
    Below are some recommended spray qualities and water volumes for use in Canada. The spray qualities listed in the table can be matched to a specific nozzle by referring to nozzle manufacturer catalogues, websites, or apps. Note that Wilger also offers traditional VMD measurements on their site, allowing users to be a bit more specific if necessary.

    Click here to download PDF

  • Simple Statistics for Growers

    Simple Statistics for Growers

    In North America, winter is agriculture conference and lecture season. Growers are inundated with graphs and charts and left to make sense of what they’re seeing. It might be an agrichemical rep promoting a new pesticide or a seed dealer comparing yields. Maybe an equipment dealer is illustrating return on investment. Even university researchers and government extension specialists have been known to flash the occasional graph from time to time.

    Without a basic understanding of how data can be abused, we are at the mercy of those presenting the data. So, in 2012, I was asked to develop a talk that would give growers a basic grounding in descriptive statistics. More to the point, it would empower a grower to raise their hand and ask questions if they felt a presenter was talking out of their… *ahem*.

    • Did the researcher do their stats correctly?
    • Is the data clear and easy to understand?
    • Is the presenter skewing something to make us see what they want?

    Since writing it, I’ve been asked to deliver this talk to several grower groups, which is surprising because very few people love statistics. Now that we’re all webinar-savvy, I took the opportunity to update the presentation and record it.

    The video is only 15 minutes. When you’re done I hope you’ll appreciate that it’s OK to be skeptical of data. Ask questions and dig deeper.

  • Reading Airblast Nozzle Tables

    Reading Airblast Nozzle Tables

    Airblast operators should know how to read a nozzle table. They are found on dealer and manufacturer websites as well as in their catalogs. Table layout varies with brand, but they all relate a nozzle’s flow rate to operating pressure. The better tables also provide the spray angle and the median droplet size (i.e. spray quality).

    Operators need this information to complete calibration calculations (aka sprayer math) and when deciding how to distribute nozzle rates, angles and spray quality along a boom relative to the target canopy.

    This article focusses on hollow and full cone nozzles, which are commonly found on airblast sprayers. For more information on flat fan nozzle tables (e.g. for banded under-canopy or, vertical booms or broadcast applications from horizontal booms), refer to this article.

    Reading the table

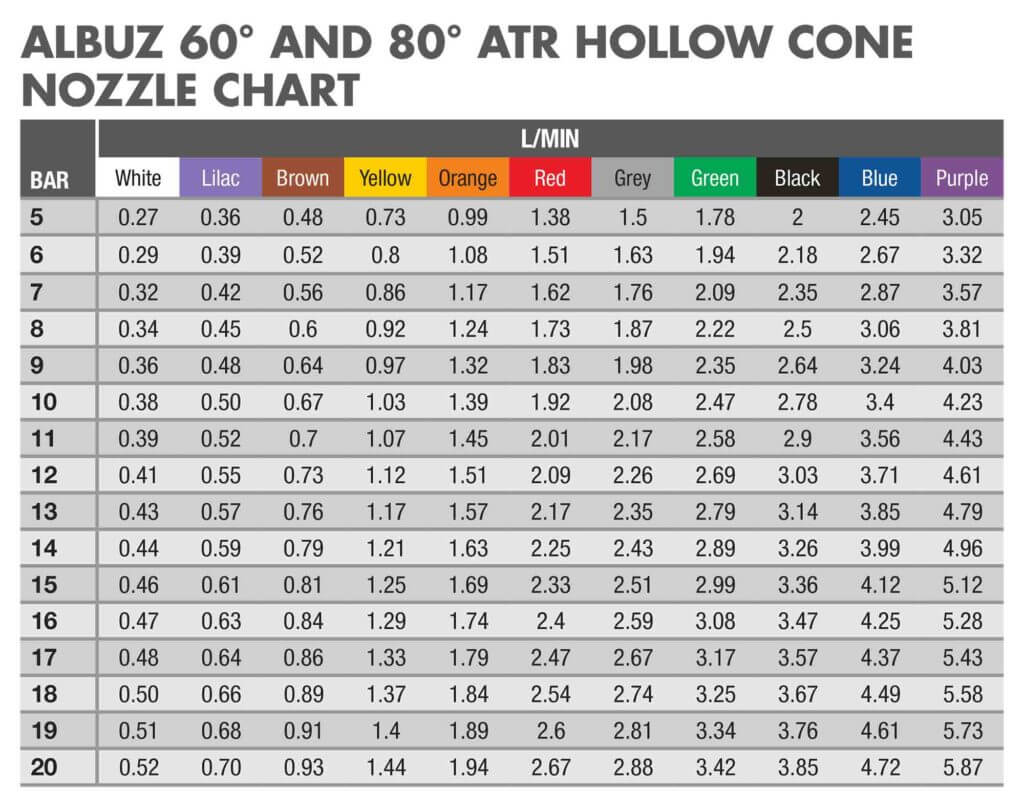
    Let’s use the table below to determine a nozzle’s flow rate for a given pressure. First, find the nozzle colour in the top row. Second, find the operating pressure in the left-most column. Finally, the flow rate is indicated in the cell at the intersection between the row and column. For example, a red ATR hollow cone nozzle operated at 9 bar will emit a flow rate of 1.83 L/min.

    Perhaps you want to determine which nozzle will give a specific flow rate. Find the rate in the body of the table and trace the column and row to determine which nozzle/pressure combination will achieve it. For example, if we want a flow rate of ~1.00 L/min, we can use a Yellow at 10 bar or an Orange at 5 bar. Yellow is the better choice since the Orange would have to be operated at the bottom of its pressure range (more on that later).

    This Albuz nozzle table for 60 and 80 degree molded hollow cones gives flow rates in litres per minute.

    Note: Do not to confuse TeeJet’s ISO-standardized TXA or TXB nozzles with TXVK or ConeJet nozzles. They may be the same colour, but their outputs are very different.

    Higher flow rates or full cone patterns can be achieved using combination disc and core (or disc and whirl) nozzles. Depending on the manufacturer, the disc plate is defined by it’s diameter in 64th’s of an inch. The core or whirl plate might be described by the number of holes (e.g. 2-hole, 3-hole, etc.), or some other manufacturer-specific nomenclature (e.g. 45’s, 25’s etc.).

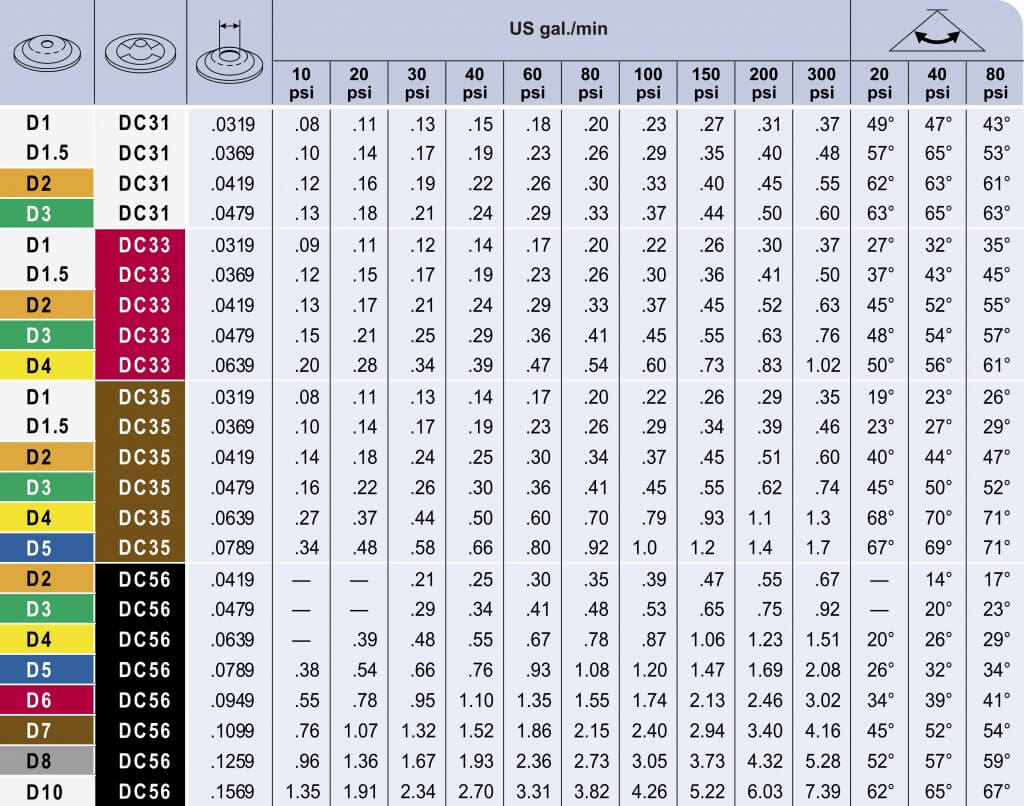
    Using the table below, we see that a D2 disc and a DC35 core will emit 0.34 gpm at 80 psi. By continuing along the row, we see that the spray angle for this combination will be 47 degrees at that pressure.

    This nozzle Table for TeeJet disc & cores is fairly typical of any manufacturer’s nozzle table. Find the disc & core combination in the two left-hand columns, and follow the row until it intersects your operating pressure to determine the rate in US gallons per minute. Or, if you know your ideal rate already, you can find the best disc & core combination for a given pressure to achieve that rate.
    This TeeJet nozzle table gives the flow rate for a disc (D#) and core (DC#) full cone combination nozzles in US gallons per minute.

    Pressure problems

    Do not choose a nozzle at the extreme of their flow or pressure range. A trailed PTO sprayer will experience pressure changes from driving on hills, or rate controllers will create pressure changes in response to changes in travel speed. In either situation, coverage will be compromised if the nozzle is pushed outside its optimal range.

    Note: Use pressure to achieve small changes in flow, but for more extreme changes, switch nozzles. Remember, it takes 4x the pressure to get 2x the flow. Stated differently, it takes 1/4 the pressure to get 1/2 the flow.

    You may not find a nozzle/pressure combination that emits the rate you are looking for. When your desired rate or pressure falls between the figures listed in the table, you can take the average. When nozzling an entire boom with different nozzle rates, get each position as close as you can to achieve the overall boom rate for a given pressure. It’s always a compromise – don’t stress over it.

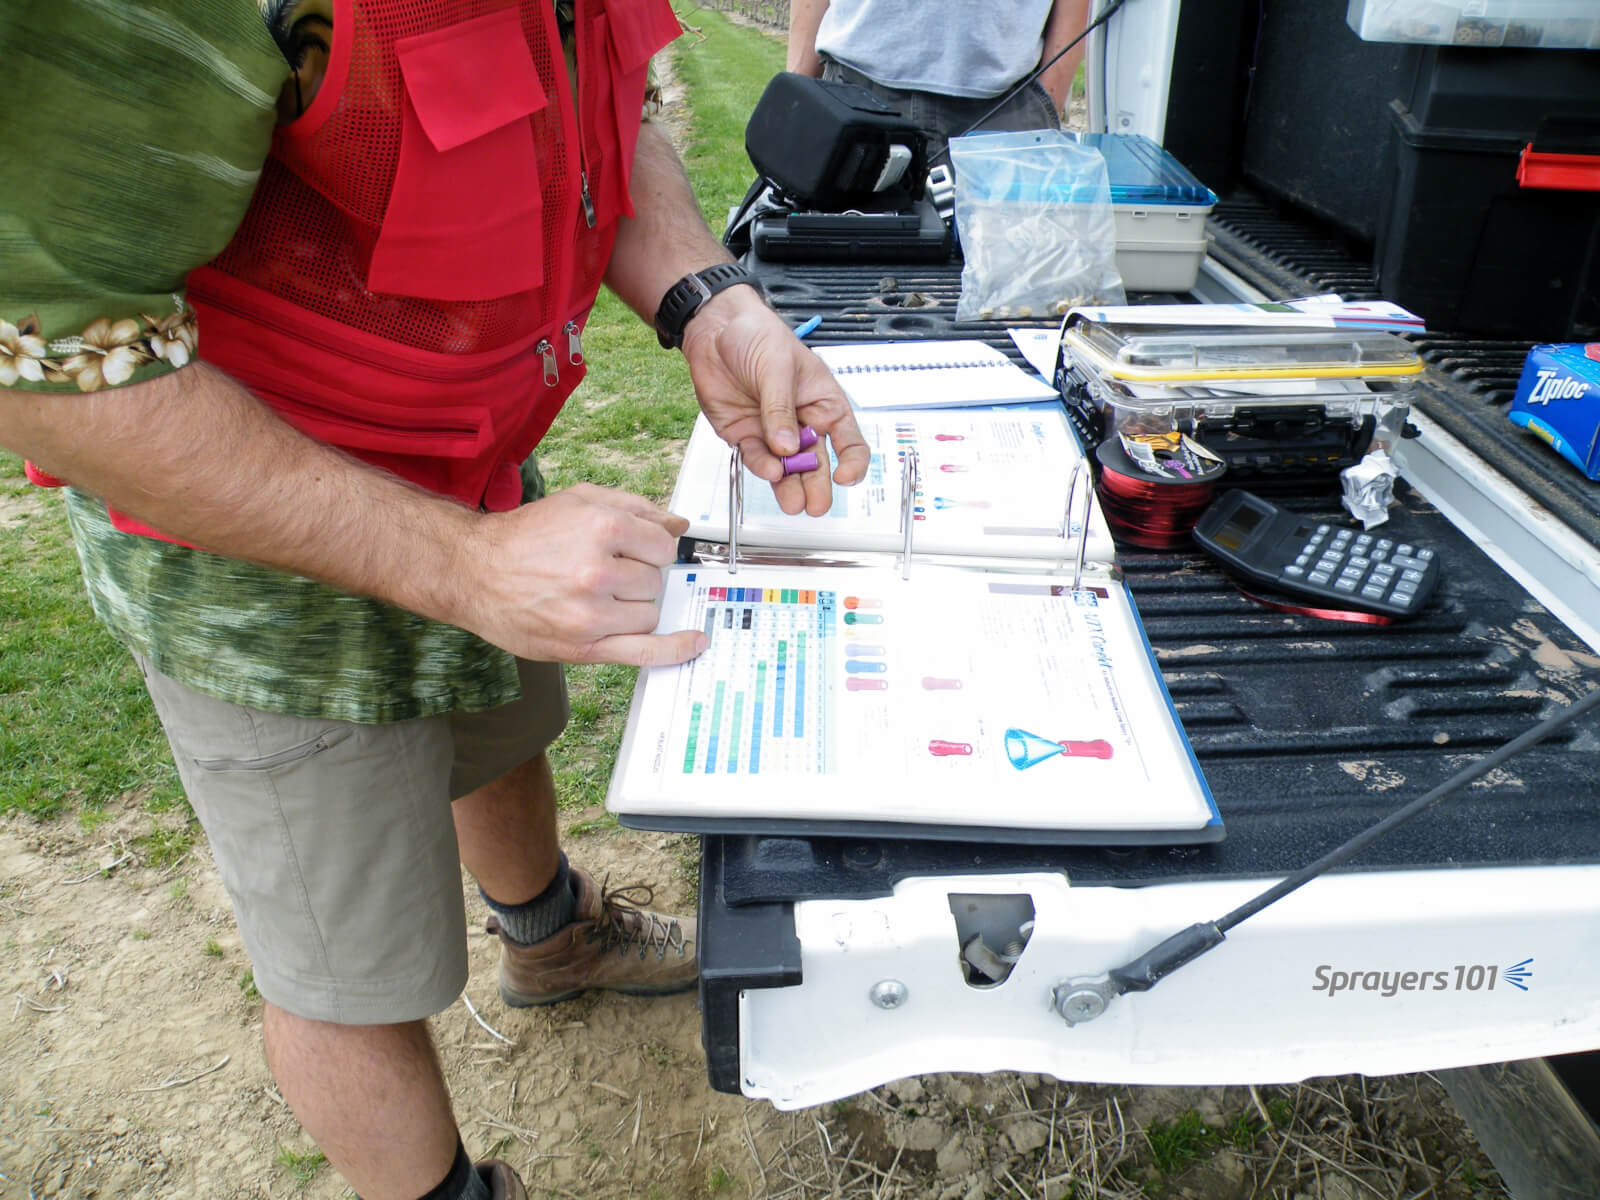
    The author looking up nozzle rates during a spring calibration. The operator was running at 190 psi, but the catalogue only listed 180 psi and 200 psi. When span is only 20 psi, it’s fairly safe to approximate the output. When the table only lists in 50 psi increments, it is more difficult to determine the rate without testing the output. This issue usually occurs at pressures above 200 psi, and that’s very high for most horticultural operations. Consider using a lower operating pressure, if possible.
    Looking up nozzle rates during a spring calibration. The operator was running at 190 psi, but the catalogue only listed 180 psi and 200 psi. When the increment is only 20 psi, it’s reasonable to approximate the output. When the span is 50 psi increments, it is more difficult to determine the rate without testing the output (it’s not a linear relationship). This issue usually occurs at pressures above 200 psi, and that’s far too high for cane, bush, vine and high-density orchards. In these situations, consider using a lower operating pressure.

    Different nozzles, same rate

    Different disc core combinations, or molded nozzles at different pressures, can produce similar flow rates. However, their spray quality and spray cone angles can be very different (see last three columns in the TeeJet table above).

    The angle of the spray cone can have a big impact on spray coverage. When the target is far away from the corresponding nozzle (e.g. the tops of nut trees), or the canopy is very, very dense (e.g. citrus canopies), consider tight-angled full cones under high pressure. This is inefficient and can give variable coverage, but it is sometimes the only option in extreme situations.

    Two hollow cone nozzles on top and five full cone nozzles below. Note the lack of spray overlap with the full cones for the first few meters. This would be a concern if the target were closer to the sprayer, such as grape or berry. Also note that the top two nozzles should not be on; their spray will likely not reach the intended target.
    Oops! Two hollow cone nozzles on top and five full cone nozzles below is the exact opposite of how things should be. Note the lack of spray overlap with the full cones for the first few meters. Spray from the top two positions will likely not reach the intended target.

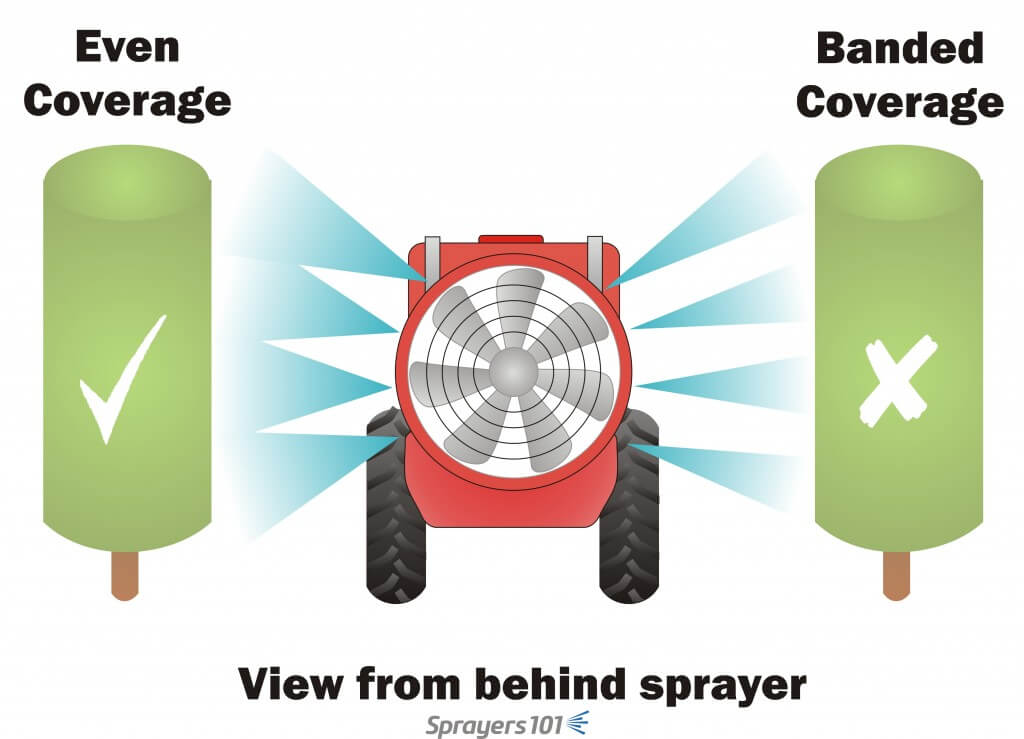
    When the target is very close to the sprayer, full cones do not overlap and create undesirable striping or banded coverage. Creating a full, overlapping spray swath that spans the entire canopy is a function of nozzle spacing, distance-to-target, and sprayer air-settings. It can also be affected by humidity, wind speed and wind direction at the time of spraying.

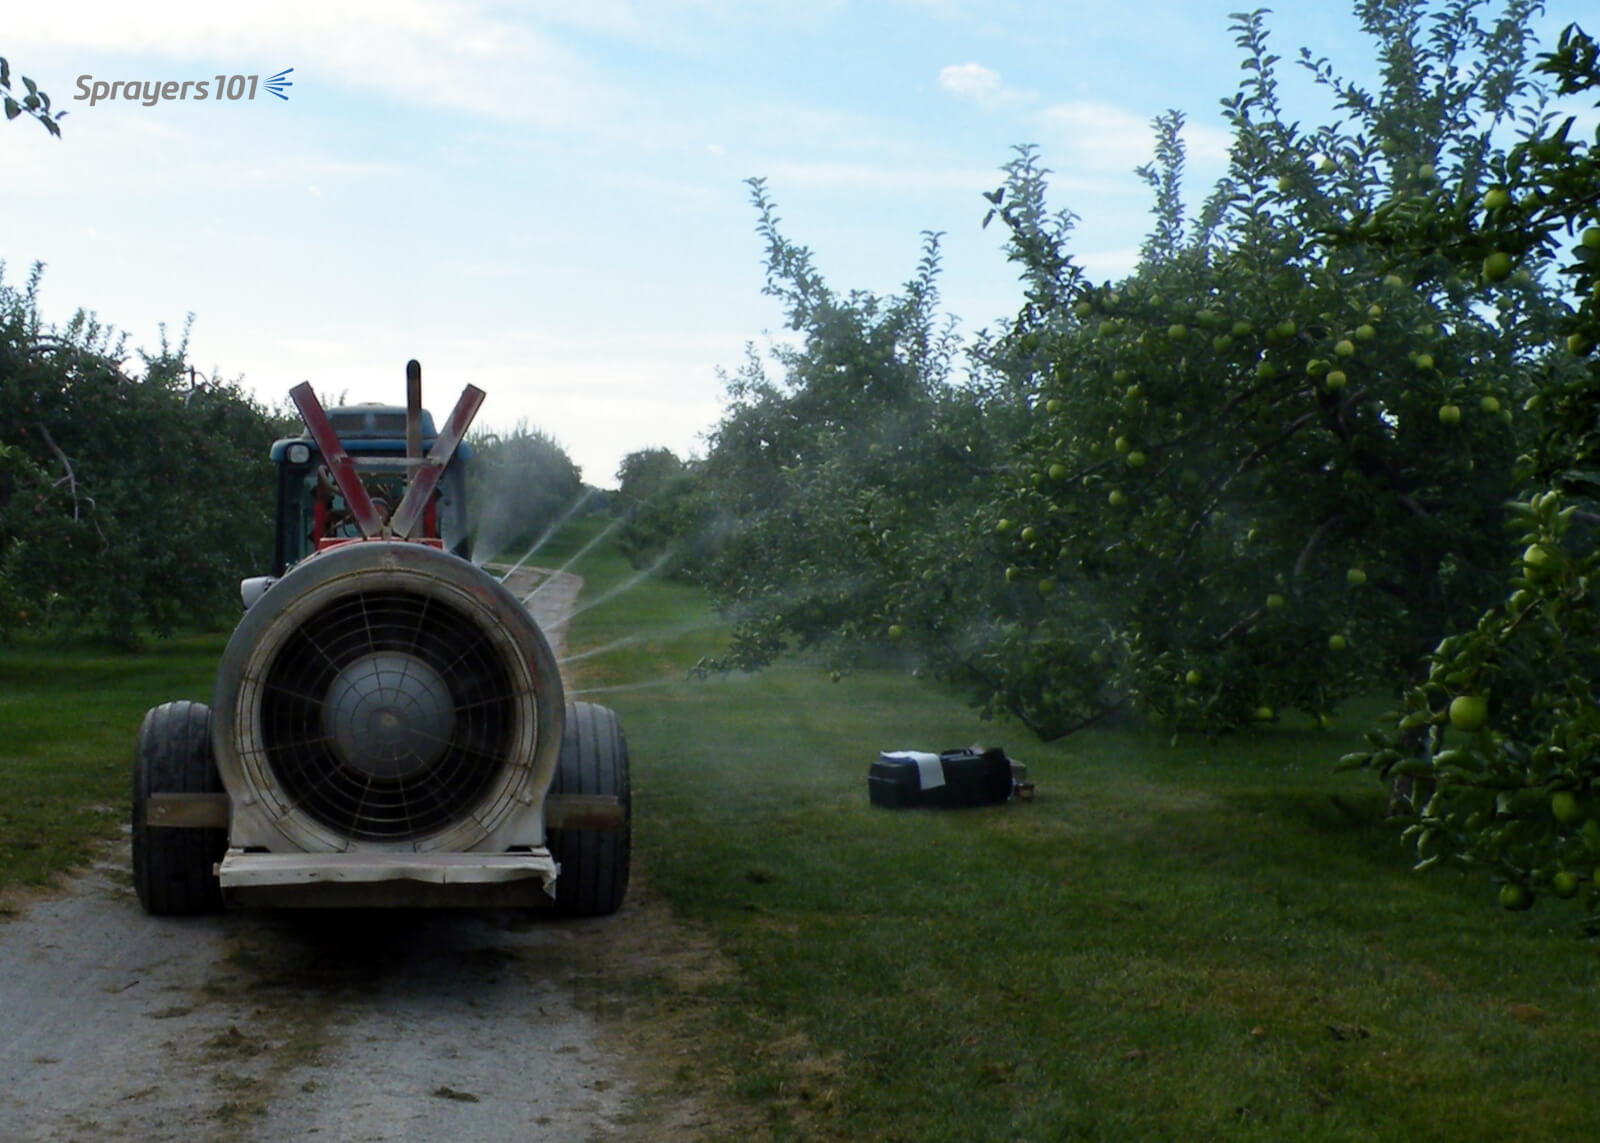
    Confirm your settings by parking the sprayer in the alley between crops. With the air on, spray clean water while a partner stands a safe distance behind the sprayer to look for gaps in the swath. The partner will see things the operator’s shoulder check will not reveal.

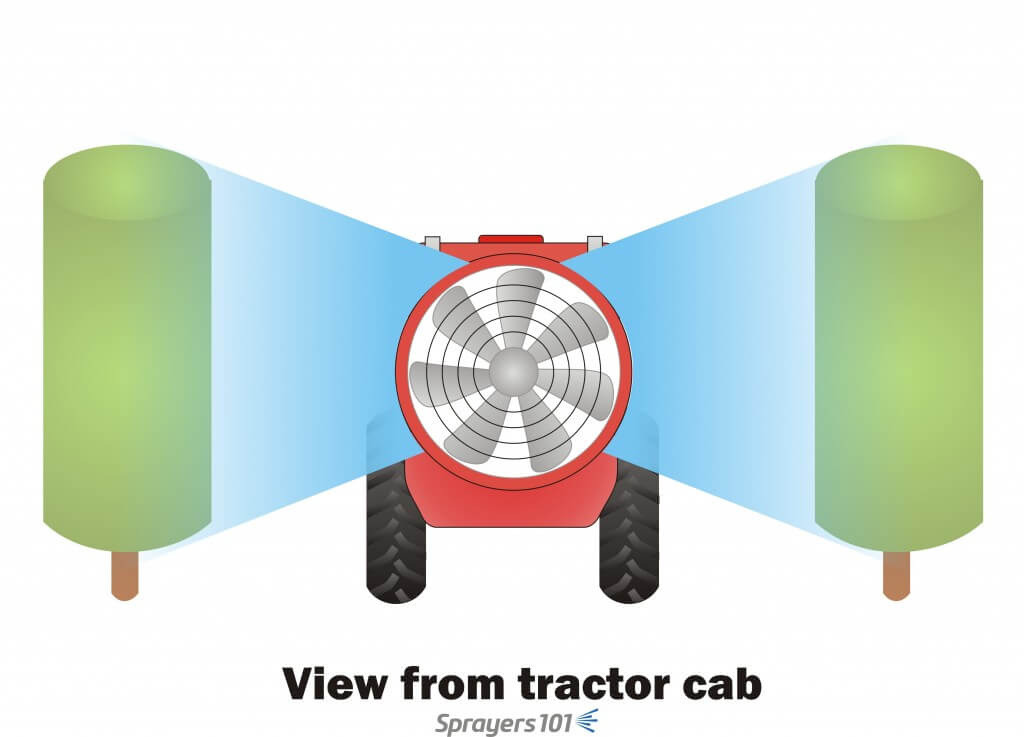
    Shoulder checks may not show you what’s really happening. Have someone stand behind the sprayer while spraying clean water to see the nozzle spray overlaps sufficiently to span the entire canopy.
    Here’s what the operator sees. But, shoulder checks may not show you what’s really happening. Have someone stand a safe distance behind the sprayer while spraying clean water to see the nozzle spray overlaps sufficiently to span the entire canopy.
    Shoulder checks may not show you what’s really happening. Have someone stand behind the sprayer while spraying clean water to see the nozzle spray overlaps sufficiently to span the entire canopy.
    Here’s what the partner standing behind the sprayer sees. Take a picture with a smartphone to show the operator.

    Nozzle tables can be wrong

    Sometimes nozzles do not perform per the nozzle table. We have discovered errors in published tables, worldwide. Here are the big three:

    • Conversion errors. Manufacturers publish catalogs in Metric and in US Imperial, but we have found many errors in the conversions.
    • Spray angle errors. When nozzles are operated at the extremes of their pressure ranges, spray angles deviate from those listed in the tables.
    • Flow rate errors. When tables are not updated to reflect changes in nozzle design, or the manufacturing process, actual flow rates deviate from those listed in the tables.

    Perhaps it’s not the table, but the nozzle itself. Most nozzle manufacturers accept a flow variability up to +/- 2.5% for new nozzles, but we have seen higher. It depends how they are made (machined, stamped, printed) and the material they are made of.

    Validate flow rate and pattern

    When errors are discovered and reported, the manufacturers can be slow to issue corrections and the errors will persist in old tables. Yes, even apps (which are often based on tables) can be wrong. So, predicted flow rates can prove unreliable. This is why it is important to double check by observing nozzle overlap and validating flow rate when you replace nozzles – even when they are brand new.

    Thanks to Dr. David Manktelow (Applied Research and Technologies, Ltd., NZ) for input into this article.

  • Productivity Calculator

    Productivity Calculator

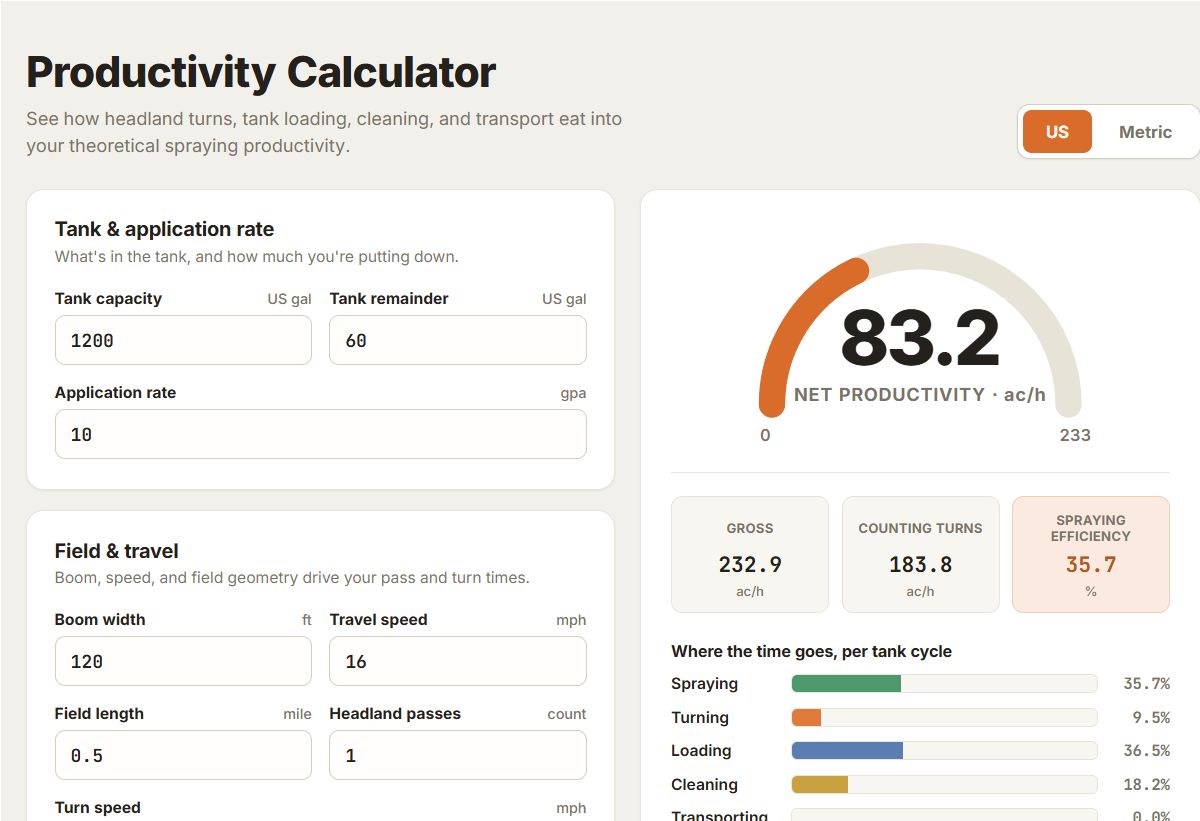
    Want to figure out how your sprayer configuration affects your productivity?  Try out that tells you acres per hour, the amount of productivity lost to turning, cleaning, filling, and transporting. You can test the benefit of faster tendering, bigger tanks, wider booms, /or changing the application volume.

    You might be surprised how productive you can be without driving faster.

    Download the app to your phone or laptop where it will run natively. On a phone, use the “Save to Homescreen” feature to create an icon there.