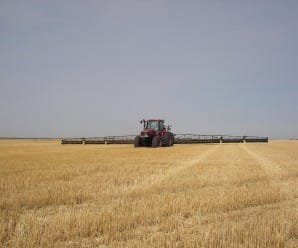
Canada, like most of the world, is officially Metric. America operates using the US Imperial system. It sounds very cut and dried, doesn’t it?
However, anyone that’s tried to calibrate a sprayer in Canada quickly discovers that we’re really an amalgam of the two systems. We like to call it “Mock-tric“. By way of evidence, some operators still adhere to the dreaded L/ac. You know who you are. To be fair, some of our sprayers and nozzles originate from the states, meaning nozzle tables and rarely, sprayer indicators, can be in US Imperial.
This leads to mind-bending questions such as:
I drive 12 mph, spraying 150 L/ha and my pressure is about 40 psi. How many ml/min should my 72 nozzles emit for a product that wants a 6 oz/acre acid equivalent?
Cue the quiet sobbing…
Frustrated back in 2017, we created a set of conversion tables to help operators with almost any Imperial/Metric emergency. Admittedly, they were in 4-point font and therefore too cumbersome for practical use. We’ll keep one here for posterity.
The good old days of “look-up tables”. RIP.
Happily time has marched on and we now have a better way. Explore our new Unit Conversion Tool, below. It allows you to convert between common (and some uncommon) agriculturally-relevant units.
There are many factors that affect the work rate of an airblast application. If an operator can improve their work rate, without compromising spray efficacy or safety, they improve operational efficiency and save money.
But how does each variable factor in? Is it worth the cost of a tender truck and operator to fill more efficiently? Should you upgrade to a multi-row sprayer? Should your next planting have longer rows? We have a simple calculator that can help you make these decisions. You can build and compare multiple scenarios to explore the relative impact of small changes to your typical spray program. We recommend making only one change for each scenario so you can better understand the results. Print the comparison page for your records.
Whether you’re a sprayer operator, or a manager of sprayer operators, this exercise will help you see your spray program in a whole new light. Try our productivity calculator at the end of the article and explore your productivity.
Spoiler: It’s amazing how changes to travel speed have only a marginal impact on work rate. Often less than 60% of the total spray job is spent actually spraying!
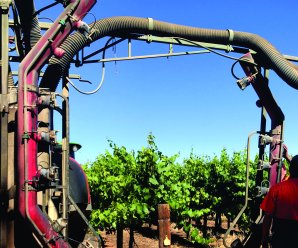
If you’d like to see just how productive you can be, check out this rare (possibly unique) sprayer from Ed Oxley Farms in Michigan. Built on an OXBO 7550, this sprayer is the fourth iteration of a concept developed over the last 20 years by Ed Oxley Farms and ag engineers from Michigan State University.
Capable of spraying five rows at a time, this self-propelled beast is a hybrid wrap-around and targeting-tower system that uses CurTec spray heads equipped with tangential fans and wire-mesh basket rotary atomizers.
That’s not dribbling – that’s purging the boom prior to spraying.
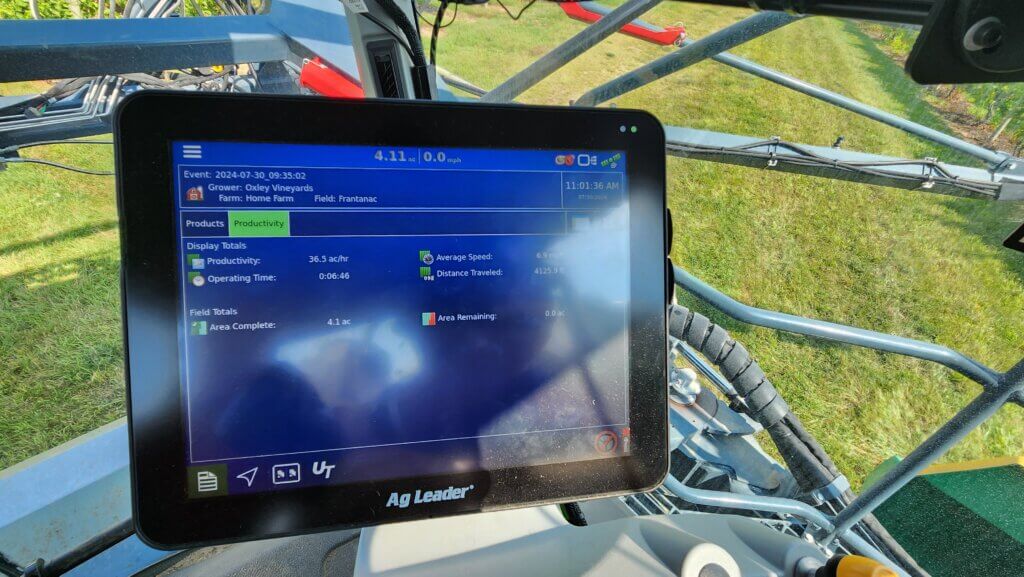
It sprays a mere 150 L/ha (~ 15 gallons/acre) at a ripping 13 km/h (~8 mph), as seen on the Ag Leader monitor below.
When row spacing and turn time are accounted for, that means it’s capable of covering almost 15 hectares (~40 acres) per hour.
And, when not spraying grapes, the boom can be swapped to make it a high-clearance corn sprayer. It doesn’t get much more efficient than this.
The following videos will show the view from inside and outside the cab. Note that the row that’s straddled is sprayed from an overhead spray head mounted to the centre rack behind the sprayer. The two adjacent rows are covered from one side from vertical spray heads mounted on the chassis. Finally, the boom holds two more overhead spray heads for the outer-most rows.
Ideally, the boom-mounted spray heads would be suspended vertically inside the row, but it makes for such a wide turn radius that it would take too long to turn… assuming there was enough headland to allow it. They’re also swept-back to minimize the turn radius and reduce the amount of airborne spray that deposits on the sprayer itself.
A clever design that makes a few compromises to ideal coverage in order to improve productivity. The balance works for them and this sprayer might be a sign of things to come in horticultural crop production systems. Want to see how your sprayer stacks up? Download the calculator and see where you might be able to make improvements.
OrchardMAX won the 2016 Canadian Agri-Marketing Association’s “Certificate of Merit” in the Mobile Apps Category.
OrchardMAX is a free decision-support tool that helps apple growers match airblast sprayer output to the size, shape, and density of an orchard canopy.
Rather than applying the same volume and pesticide dose to every block throughout the season, OrchardMAX uses the principles of Crop-Adapted Spraying to estimate settings appropriate for each orchard block. The objective is more consistent spray coverage with less avoidable waste. Ontario and Nova Scotia orchard trials demonstrated seasonal spray-volume savings of approximately 20 to 35%, without significant differences in pest activity and reported or fruit quality.
What OrchardMAX does
Using information supplied by the operator, OrchardMAX can:
Account for changes in canopy size, shape, and density
Estimate an appropriate carrier volume and pesticide dose
Suggest nozzle flow rates and sprayer settings
Calculate the amount of formulated product required per tank
Estimate work rate, tank requirements, and potential savings
What OrchardMAX does not do
OrchardMAX is a decision-support tool, not a substitute for calibration, operator judgement, or the pesticide label. It will not:
Recommend a rate above the pesticide label
Calibrate the sprayer
Confirm that adequate spray coverage was achieved
Account fully for wind, temperature, or relative humidity
Recommend less than 400 L/ha, approximately 42.5 US gal/ac
Recommend less than half the labelled pesticide rate
The results are only as reliable as the information entered. Operators must still maintain and calibrate the sprayer, match air settings to the canopy, work in reasonable weather conditions and confirm coverage using water-sensitive paper.
How to use it
For each spray scenario:
Select or enter the sprayer and orchard block.
Describe the current canopy size, shape, and density.
Enter the labelled pesticide rate and planned spray mixture.
Review the proposed carrier volume, pesticide dose, nozzle rates, and number of tanks.
Configure and calibrate the sprayer.
Confirm the resulting coverage in the orchard and adjust where necessary.
Start with a few representative blocks. Compare OrchardMAX recommendations with your current program, evaluate coverage, and make incremental changes as you gain confidence.
History
The original app was an excel-based tool created in 2010 and later developed into an app for iOS and Android systems by AgNition Inc. with funding from Growing Forward 2 in 2016. Compatibility with iOS and Android ended in 2020. We have now rebuilt the same functionality into this online version of the app.
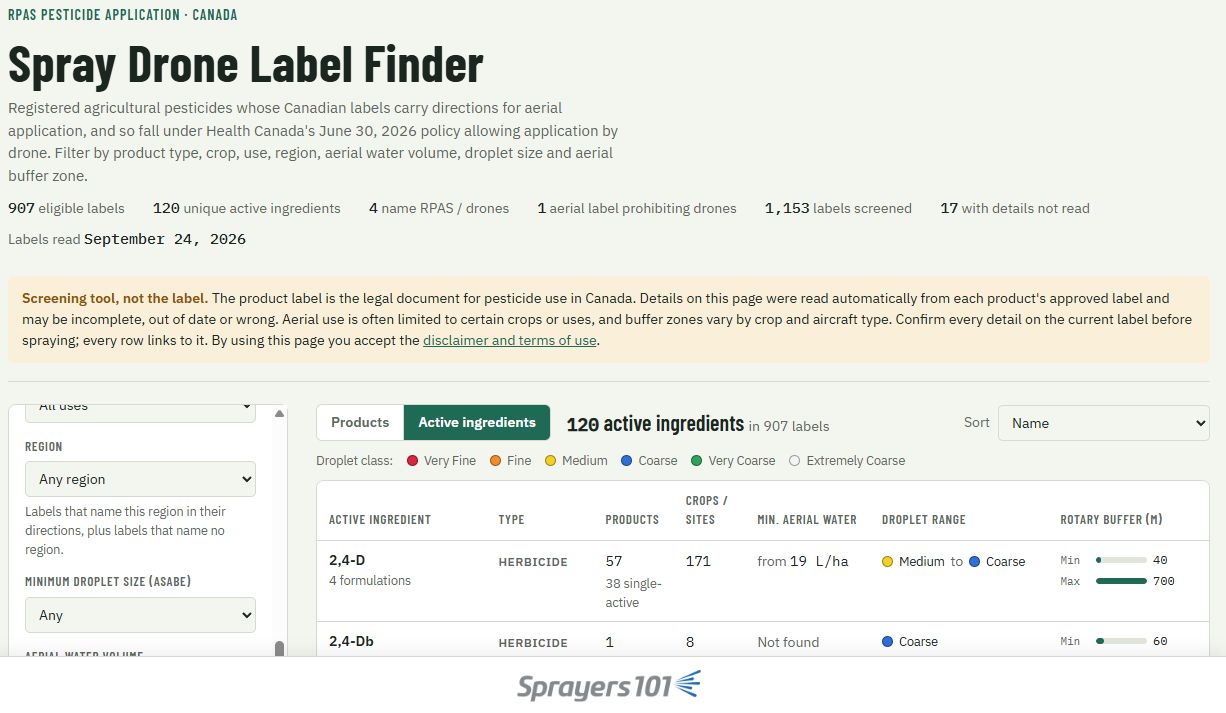
On June 10, 2026 the Pesticides Regulatory Directorate (PRD, formerly PMRA) permitted the use of drones for pesticides registered to be applied by air in Canada. Since then, a common question has been which those pesticides are, and what the volume, droplet size, and buffer zone restrictions were.
We’ve built a database that contains all products registered in Canada for aerial application. This database can be searched by product name, or by active ingredient name. The important paramaters are identified in columns. The database can be further filtered by pesticide type, crop, or region, and can also look for specific droplet size or water volume restrictions.
The database is not perfect, and will be updated over time. It is important that the original label be read to confirm the summarized information. To that end, there is a link to the label beside each product.
We’ve tested the database, but not comprehensively. Please let us know what errors you find, or how the database might be improved in the future.
There must be a separation of duties of mixer/loaders and pilots. In other words, two people will be required to spray by RPAS, someone who pilots but does not touch pesticide, and another who takes care of the mixing and filling.
Drones can only be operated within Visual Line of Sight (VLOS). A Visual Observer must assist the pilot if they are unable to maintain VLOS.
All label product rates, water volumes, droplet size requirements, and buffer zones, as well as PPE required, must be followed.
Buffer zones for rotary-winged aircraft are to be used for RPAS
There will be no new label language required. No specific RPAS instructions on flying parameters, calibration requirements, etc.
Registrants wishing to opt out of an RPAS label would need to file for an exemption with PMRA, and those labels would be revised to state “DO NOT apply by Remotely Piloted Aircraft Systems (RPAS)”
Registrants may opt to create RPAS specific labels for their products.
There are no federal RPAS-specific training or certification requirements. Those are at the discretion of the provinces.
Timing trumps most things in crop protection. A great spray applied at the wrong time isn’t nearly as valuable as a mediocre spray at the right time. So how do we improve our ability to get things done at the right time?
Often, we try to win races by driving faster. In our last article, we looked at driving speed and concluded that faster speeds can lead to more drift and less uniform deposition. Driving slower can be viewed as a sort of insurance policy: You may not notice the benefits right away, but on days when that extra bit of performance is required, you’re covered.
So how do you get the job done quickly if you can’t drive faster? To answer, we have to look to other opportunities for boosting productivity.
Recently, we used our and tried to capture all the elements of a normal spray operation that affect timeliness. These were:
travel speed
boom width
tank size
water volume
field length
number of headlands
turning speed
fill time
First, we identified a reasonable base condition. For the sprayer, that was a travel speed of 14 mph, a 90’ boom, an 800 gal tank, a 10 gpa water volume, and a 20 minute fill time. Then, we set up a typical field situation, which was spraying a half-mile run on a quarter with two sprayed headlands and a turning speed of 8 mph. Finally, we changed one factor at a time to determine its relative importance.
Before we discuss the results, let’s make it clear that just because changing some of these factors improves productivity doesn’t mean we’re recommending them! For example, adequate water volume remains an important input that improves coverage and permits the use of low-drift sprays. Larger tanks increase compaction and take more power, and so forth.
Here’s what we found:
All productivity values were expressed as acres per engine hour. For this reason, our numbers will be lower than what a typical sprayer monitor reports, most of which calculate acres per spraying hour.
For the base condition, the sprayer spent 15% of its driving time turning, and 37% of its on-field time stationary (i.e. filling or cleaning). For every hour spent on the field, less than half the time (48%) was spent spraying. This resulted in an average productivity of 82 acres/h.
Increasing the spray speed to 18 mph increased average productivity to 93 acres/h, but it also increased the proportion of time spent turning and loading, resulting in just 40% of the field time spent spraying.
Decreasing the loading time from 20 to 10 minutes reduced the proportion of field time spent stationary to 23%, covering 100 acres/h at 14 mph. Surprisingly, this was the productivity-winner, resuling in 62% of on-field time spraying.
We discovered other powerful productivity factors, and chief among them was boom width. A 33% increase in boom width from 90’ to 120’ gave a productivity boost to 94 acres/h, close to the same result as increasing the travel speed to 18 mph earlier. Similar side effects occurred: more time turning, and a greater proportion of time filling, as we saw with faster travel speeds.
Boom width seems to have some room for growth. Many smaller European counties use wider booms than we do in North America, for example. With gps guidance and large fields, we have excellent conditions for their implementation.
Two other factors that had similar effects to fill time were water volume and tank size. Less water and larger tanks increased productivity by decreasing the fill frequency, with effects similar in magnitude to speeding up the fill time. Decreasing the water volume from 10 to 5 gpa increased productivity to 100 acres/h by decreasing the proportion of time the sprayer was stopped from 37% to 23%. Increasing from an 800 to a 1,200 gallon tank increased productivity to 94 acres/h, again by decreasing the proportion of time spent filling to 28%.
Taken together, a sprayer with a 120’ boom, a 1,200 gal tank, applying 10 gpa and filling in 10 min had an average productivity of 132 acres/h. And this was achieved without driving faster than 14 mph. If you can string two quarters together and drive a whole mile before turning, that number rises to 145 acres/h, a surprisingly large 13 acres/h gain.
The perspective of minimizing downtime extends to other tasks, too:
Be more prepared for the job by reviewing the product label in advance, noting the correct mixing order.
Keep extra nozzles, clamps, and nozzle bodies in the cab.
Don’t clean plugged nozzles, replace them.
Use low-drift nozzles so a small increase in wind doesn’t shut you down.
Ensure all the products needed are on the tender truck (e.g. pesticide, adjuvant, tank cleaner, anti-foamer, etc.).
Consider switching to 3” plumbing (pump rates of 300 – 400 gpm are possible).
Make sure your inductor won’t be the limiting factor. For example, product pumps can be awfully slow when the product is cold. It might be worthwhile to explore a venturi system.
Speeding up the fill process is a good idea, but be careful with certain products. Dry materials such as the sulfonyl ureas (e.g. Refine, Express SG, etc.) and some fungicides (e.g. Astound, etc.) require time to hydrate in water so they mix properly. Some operators pre-hydrate these in a smaller tank, while others get an extra tank to pre-mix whole loads and simply transfer them over.
Also think about the time spent cleaning the sprayer. Thoroughness is important, but perhaps there are efficiencies to be gained there as well, like never letting a sprayer sit after spraying. We’ve written about continuous rinsing, for example, to improve cleaning speed and effectiveness.
So, the quicker we can spray, while ensuring a quality job, the more effective our crop protection practices will be. We encourage you to use our to determine your best configuration.
Got a productivity tips to share? Let us know! And remember: In spraying, the race is won in the pits.
Factor
Base
Drive Faster
Fill Faster
Spray Wider
Less Water
Bigger Tank
New Sprayer
Travel Speed
14 mph
18 mph
14 mph
14 mph
14 mph
14 mph
14 mph
Fill time
20 min
20 min
10 min
20 min
20 min
20 min
10 min
Boom Width
90 ft
90 ft
90 ft
120 ft
90 ft
90 ft
120 ft
Water Volume
10 gpa
10 gpa
10 gpa
10 gpa
5 gpa
10 gpa
10 gpa
Tank Size
800 gal
800 gal
800 gal
800 gal
800 gal
1200 gal
1200 gal
Field Length
0.5 mile
0.5 mile
0.5 mile
0.5 mile
0.5 mile
0.5 mile
0.5 mile
Time Turning
15%
19%
15%
20%
15%
15%
20%
Time Loading
37%
42%
23%
42%
23%
28%
19%
Time Spraying
48%
39%
62%
38%
62%
57%
61%
Acres/h
82
93
100
94
100
94
132
To work with the productivity calculator, click here.