Category: Coverage

All hort articles about achieving, confirming or correcting for spray coverage.

  • Crop-Adapted Spraying in Highbush Blueberry: Ten years of pesticide savings

    Crop-Adapted Spraying in Highbush Blueberry: Ten years of pesticide savings

    A 15-acre highbush blueberry operation in southern Ontario reduced annual spray volume by an average of 70.5% and pesticide costs by 63% without compromising commercially acceptable pest or disease control.

    The results were not achieved by changing sprayer settings alone. They followed three complementary changes:

    1. Improving canopy and harvest management
    2. Replacing an inefficient sprayer
    3. Using Crop-Adapted Spraying to match spray volume and pesticide rate to the canopy

    Together, these changes reduced average spray volume from approximately 1,000 to 400 L/ha and saved an estimated $5,850 CAD in pesticide costs each year.

    Why Falcon Blueberries changed their approach

    In 2016, serious spotted-wing drosophila (SWD) pressure prompted the growers to reconsider their crop protection program.

    The project tracked pesticide use, water use, yield, and operational outcomes against historical values. SWD activity was also monitored for three years, both within the planting and in wild hosts along its border. Results were compared with monitoring data from nearby berry and tender fruit operations using conventional spray programs.

    1. Improving canopy and harvest management

    The first step was to make the crop easier to protect.

    Beginning in 2016, the growers:

    • Conducted their first heavy pruning
    • Aimed to remove approximately 30% of the plant material annually
    • Picked more frequently and more thoroughly
    • Collected and buried dropped and culled berries

    Heavy pruning initially raised concerns about lower yield and the possible need for trellising. Instead, the growers observed improved berry quality and spent fewer hours removing damaged fruit on the packing line. They concluded that the improvement in marketable fruit offset the effects of removing plant material.

    Pruning also produced a more open and uniform spray target. This was an important prerequisite for reducing spray volume because dense, irregular canopies are more difficult to penetrate consistently.
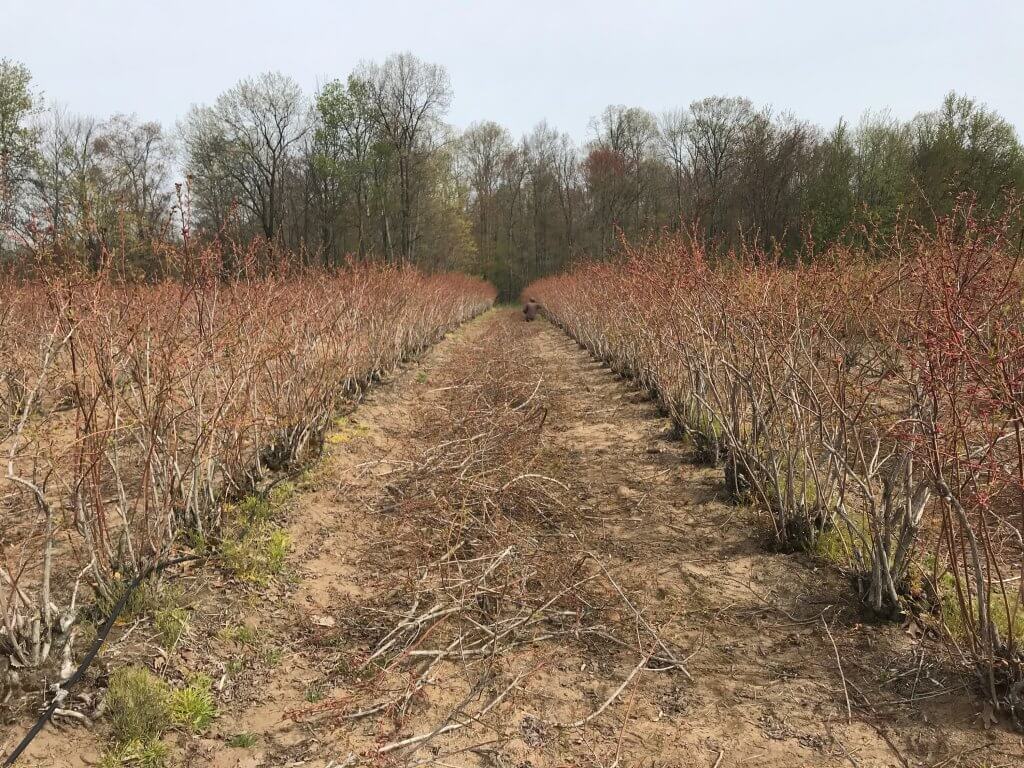
    Heavy pruning in 2016.
    Most years, bushes were pruned ~30% to maintain an ideal size and shape.
    Pickers were educated in how to pick cleanly and dropped / culled fruit was collected and buried.

    2. Selecting a sprayer suited to blueberries

    In 2018, the operation replaced its aging KWH air-shear sprayer with a low-profile axial-fan sprayer equipped with conventional hydraulic nozzles.

    The KWH sprayer had been designed for standard fruit-tree canopies. It generated air speeds greater than 100 mph and produced an Extremely Fine spray quality. These characteristics were poorly matched to the shorter, denser architecture of highbush blueberries.

    The growers considered a cannon-style sprayer that could treat several rows in one pass. However, their priorities were improved coverage and reduced off-target loss. They therefore selected a low-profile sprayer and continued to travel every row.

    The new sprayer provided several immediate benefits:

    • Better control over droplet size and liquid distribution
    • Air direction and volume better suited to the canopy
    • Greater reliability
    • Lower fuel use
    • Less noise
    • Elimination of leaks
    • Positive nozzle shutoff at row ends
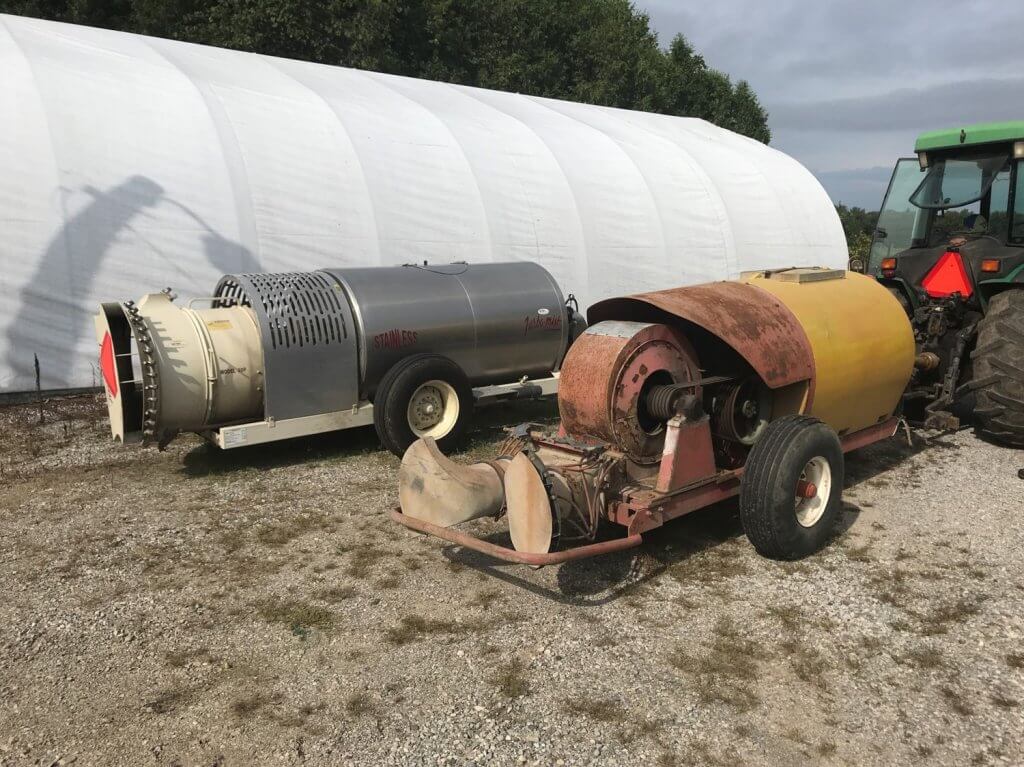
    Fore: An old KWH air shear sprayer. Rear: Low profile axial sprayer with conventional hydraulic nozzles.

    Correcting leaks and eliminating continued discharge during turns reduced spray use by approximately 20% before any further rate adjustment was made.

    3. Matching the application to the canopy

    Crop-Adapted Spraying, or CAS, provides a structured way to adjust an airblast application to the size, density, and shape of a three-dimensional crop canopy.

    Several established dose-expression systems perform a similar function, including Tree-Row Volume, PACE+, and DOSAVIÑA. Although each has value, adoption can be limited by crop-specific requirements or complicated calculations.

    CAS formalizes adjustments that experienced applicators often make informally, such as:

    • Turning individual nozzles on or off according to canopy height
    • Redistributing flow among nozzle positions
    • Adjusting travel speed for canopy density
    • Changing air output and direction to improve penetration and reduce loss

    The blueberry sprayer was calibrated by adjusting air energy and direction, travel speed, nozzle selection, and liquid distribution. Water-sensitive paper was placed throughout the canopy to confirm that the revised settings provided acceptable coverage.

    The working coverage targets were:

    • At least 85 deposits/cm²
    • Approximately 10% to 15% surface coverage
    • Achievement of these targets in at least 80% of the sampled canopy
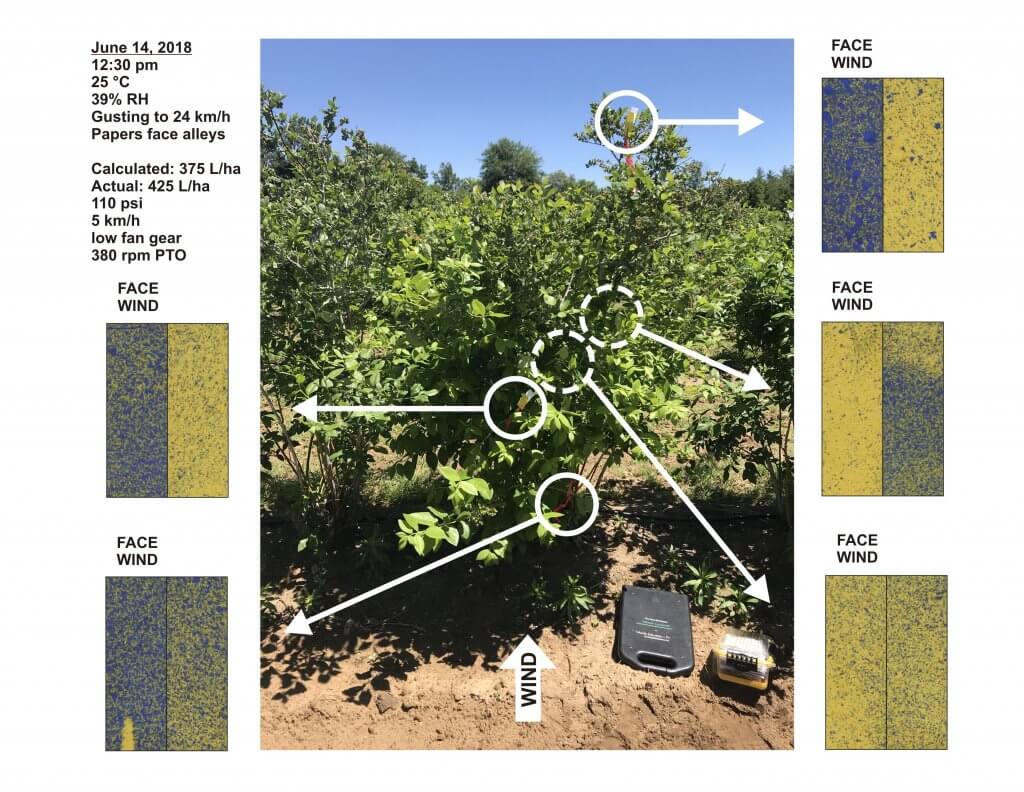
    Example of water sensitive paper coverage on a windy day (worst case scenario) in June, 2018.

    During the first season, coverage was reassessed every few weeks from April through June as the canopy developed.

    Spray volume / Pesticide

    Once the new sprayer was calibrated to the managed canopy, spray volume declined from approximately 1,000 to 400 L/ha. The concentration of formulated product in the spray mixture remained unchanged. Instead, the calibrated sprayer allowed each tank to treat a larger area while maintaining the required canopy coverage.

    Before the sprayer replacement and adoption of CAS, the operation applied approximately 78,260 L of spray mixture annually. Average annual water savings were approximately 55,173 L, equivalent to a 70.5% reduction. That’s almost 1/2 a million liters in 10 years.

    The lower spray volume also saved an estimated 15 hours of filling and spraying each year. This reduced labour and equipment time while potentially reducing operator fatigue and exposure associated with mixing and loading

    Pesticide costs were compared annually with the farm’s 2017 program using updated product prices. On that basis, the average savings were approximately:

    • $5,850 CAD per year
    • 63% of the equivalent pesticide cost

    Pest and Disease Monitoring

    The growers retained responsibility for product selection and application timing. Products were rotated, and treatment decisions were made according to integrated pest management principles.

    Air-induction hollow-cone nozzles were installed in the uppermost nozzle positions. The larger droplets produced at the top of the spray plume were more likely to settle if they passed over the canopy, reducing the potential for off-target movement

    SWD monitoring

    Spotted-wing drosophila traps were monitored weekly from 2018 through 2020. Three traps were placed within the blueberry crop and one was placed in an unmanaged wild host along an adjacent treeline.
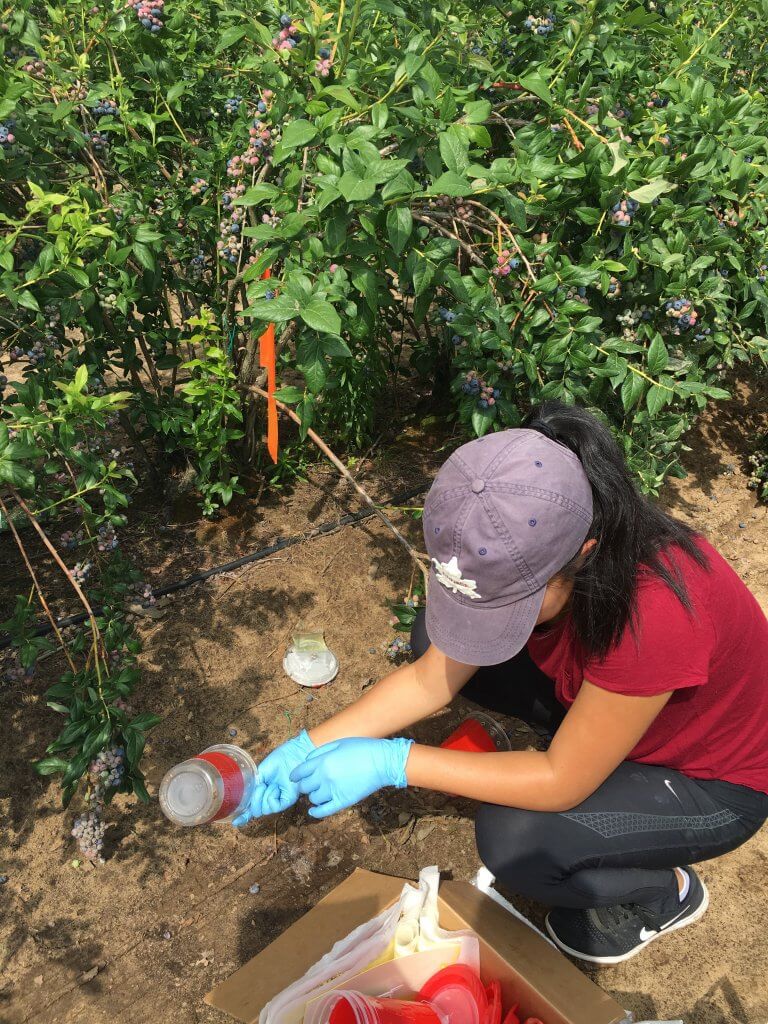
    Regional monitoring provided comparisons with other horticultural operations:

    • Up to 16 berry and tender fruit sites in 2018
    • Approximately 10 to 12 sites in 2019
    • Four blueberry, raspberry, and cherry sites in 2020

    Average SWD captures were higher at surrounding conventionally managed sites in 2018 and 2020. Captures were higher in the CAS planting in 2019. Across the three monitoring years, the overall difference was negligible.

    Trap capture does not necessarily predict the amount of fruit damage. The growers therefore also tested harvested berries regularly. SWD damage remained within commercially acceptable limits, and the growers reported satisfactory disease control.

    Because the monitoring was not replicated or subjected to statistical analysis, it cannot establish that CAS provided equivalent control under all conditions. It does indicate that, on this farm, lower spray volumes and pesticide use were compatible with acceptable commercial control.

    Yield and seasonal conditions

    Yield varied for reasons unrelated to sprayer calibration, including pruning intensity, labour availability, harvest timing, market conditions, and weather.

    • 2016: The baseline before any management changes. The farm harvested 12,076 flats, each containing approximately 9 lb of fruit.
    • 2017: Following the initial canopy-management changes, harvest increased to 18,335 flats; an increase of approximately 50%.
    • 2018: Yield remained essentially unchanged in the first year of CAS.
    • 2019: Harvest began about one month late. Low blueberry prices also prompted the farm to stop harvesting approximately one month early. Allowing for the shortened harvest period, production appeared comparable with previous years.
    • 2020: Anticipated shortages of seasonal labour during the COVID-19 pandemic led the growers to prune heavily and deliberately reduce the crop.
    • 2021: Little pruning was needed following the previous year’s heavy pruning. The resulting denser canopy, combined with unusually high precipitation, contributed to serious anthracnose pressure. More fungicide applications were made than in any other study year, although CAS-calibrated rates and settings were maintained.
    • 2022 and 2023: Spotted-wing drosophila pressure was low, anthracnose pressure was moderate, and production conditions were relatively typical.
    • 2024: Heavy rainfall contributed to an early start and finish to the season, but yield remained near normal.
    • 2025 and 2026: The seasons were generally typical, with no major production disruptions.

    These annual differences demonstrate why pesticide use, pest pressure, yield, and weather should be interpreted together. A low-use year may reflect either improved application efficiency or low pest pressure. Likewise, a high-use year may reflect exceptional disease pressure rather than a failure of the calibration method.

    Additional benefits reported by Falcon Blueberries

    The operation identified several benefits beyond direct pesticide and water savings:

    • Reduced pesticide use provided a positive response to questions from U-pick customers.
    • Lower environmental pesticide loading aligned with the growers’ production philosophy.
    • During a regional fungicide shortage in 2018, the farm had enough unused product to return some to the distributor.
    • Reduced early-season disease damage decreased the amount of fruit removed on the packing line.
    • Fewer tank fills reduced labour, machinery time, and interruptions during spraying.

    Practical implications for all highbush blueberry growers

    The results from this farm should not be interpreted as a recommendation to reduce pesticide rates by a fixed percentage. The important principle is to match the application to the canopy and confirm performance. Growers considering a similar approach should:

    1. Manage the canopy. Maintain a reasonably open and consistent target through regular pruning.
    2. Correct obvious sources of waste. Repair leaks, confirm positive nozzle shutoff, and prevent discharge during turns.
    3. Match the sprayer to the crop. Adjust fan output, air direction, nozzle positions, droplet size, travel speed, and liquid distribution.
    4. Measure coverage. Use water-sensitive paper or another suitable method at representative locations and depths.
    5. Reassess as the canopy changes. Settings that work before bloom may not be appropriate after the canopy fills.
    6. Respect the label. Do not reduce application volume or pesticide use below label requirements.
    7. Document the results. Record settings, weather, water volume, products, pest pressure, coverage, and crop response.
    8. Make changes incrementally. Confirm coverage and control before adopting larger reductions.

    The achievable reduction will vary with canopy size and density, sprayer design, product requirements, pest pressure, weather, and the applicator’s ability to verify coverage.

    Conclusion

    Over ten years, this southern Ontario blueberry operation substantially reduced spray volume and pesticide costs while maintaining commercially acceptable pest and disease control. These outcomes resulted from a coordinated production-system change rather than from a single calibration adjustment. Canopy management created a more accessible target, the new sprayer provided better control of air and liquid, and Crop-Adapted Spraying supplied a repeatable method for confirming coverage.

    The case study demonstrates that meaningful pesticide savings are possible when rate adjustment is based on crop structure, appropriate application technology, and measured coverage. It also reinforces an important limitation: results from one farm should guide further evaluation, not replace on-farm calibration, label compliance, or local validation.

    Here’s a narrated PowerPoint presentation of this study (includes data up to 2020):

    The monitoring portion of this project was funded by Niagara Peninsula Fruit and Vegetable Growers Association, Ontario Grape and Wine Research and Ontario Tender Fruit Growers in collaboration with private consultants.

  • OrchardMAX 2.0

    OrchardMAX 2.0

    2016_Orchard_Max_Logo

    OrchardMAX won the 2016 Canadian Agri-Marketing Association’s “Certificate of Merit” in the Mobile Apps Category.

    OrchardMAX is a free decision-support tool that helps apple growers match airblast sprayer output to the size, shape, and density of an orchard canopy.

    Rather than applying the same volume and pesticide dose to every block throughout the season, OrchardMAX uses the principles of Crop-Adapted Spraying to estimate settings appropriate for each orchard block. The objective is more consistent spray coverage with less avoidable waste. Ontario and Nova Scotia orchard trials demonstrated seasonal spray-volume savings of approximately 20 to 35%, without significant differences in pest activity and reported or fruit quality.

    What OrchardMAX does

    Using information supplied by the operator, OrchardMAX can:

    • Account for changes in canopy size, shape, and density
    • Estimate an appropriate carrier volume and pesticide dose
    • Suggest nozzle flow rates and sprayer settings
    • Calculate the amount of formulated product required per tank
    • Estimate work rate, tank requirements, and potential savings

    What OrchardMAX does not do

    OrchardMAX is a decision-support tool, not a substitute for calibration, operator judgement, or the pesticide label. It will not:

    • Recommend a rate above the pesticide label
    • Calibrate the sprayer
    • Confirm that adequate spray coverage was achieved
    • Account fully for wind, temperature, or relative humidity
    • Recommend less than 400 L/ha, approximately 42.5 US gal/ac
    • Recommend less than half the labelled pesticide rate

    The results are only as reliable as the information entered. Operators must still maintain and calibrate the sprayer, match air settings to the canopy, work in reasonable weather conditions and confirm coverage using water-sensitive paper.

    How to use it

    For each spray scenario:

    • Select or enter the sprayer and orchard block.
    • Describe the current canopy size, shape, and density.
    • Enter the labelled pesticide rate and planned spray mixture.
    • Review the proposed carrier volume, pesticide dose, nozzle rates, and number of tanks.
    • Configure and calibrate the sprayer.
    • Confirm the resulting coverage in the orchard and adjust where necessary.

    Start with a few representative blocks. Compare OrchardMAX recommendations with your current program, evaluate coverage, and make incremental changes as you gain confidence.

    History

    The original app was an excel-based tool created in 2010 and later developed into an app for iOS and Android systems by AgNition Inc. with funding from Growing Forward 2 in 2016. Compatibility with iOS and Android ended in 2020. We have now rebuilt the same functionality into this online version of the app.

  • Comparing Water Sensitive Paper Brands

    Comparing Water Sensitive Paper Brands

    Introduction

    Spray coverage describes the degree of contact between spray droplets and the target surface area. This metric can be used to predict the success of an application. One of the easiest methods for visualizing coverage is to use water sensitive paper (WSP), which is a passive, artificial collector that turns from yellow to blue when contacted by water.

    WSP is often used to evaluate iterative changes to a spray program. Placed strategically throughout a target canopy, or directly on the ground, achieving uniform, threshold coverage translates into improved efficacy, reduced waste, reduced off-target contamination and reduced risk of pesticide resistance development. WSP were also used to develop a system that measures the area covered by the effective radial distance in an attempt to relate the area covered by a stain to a larger area where sufficient pesticide activity is taking place.

    WSP tends to underestimate the spreading effect that can occur on plant surfaces (especially when surfactants are used), but they are effective as a relative index.

    A brief history of WSP

    In 1970, a journal article described a new method for sampling and assessing spray droplets. Photographic paper treated with bromoethyl blue created a yellow surface that changed colour when it encountered moisture. The pH-based reaction was fast and irreversible, leaving a distinct blue stain to mark the deposition.

    Ciba-Geigy Ltd. made water sensitive paper commercially available in 1985 (later as Novartis in 1996 and as Syngenta since 2000). It is produced in several formats, but aluminum foil packages of 50, 76 x 22 mm (1 x 3 in.) papers are the most popular. Odds are if you’ve ever used water sensitive paper, it originated from Syngenta in Switzerland. In 2023 I noticed that the papers now say “made in Germany.”

    Change of manufacturing location?

    In recent years, two new options have been made commercially available: Innoquest’s SpotOn Paper (United States) and WSPaper (Brazil). At the time of writing, there has been no impartial comparative evaluation of these three products.

    Once dry, the blue stains on WSP are irreversible and papers can be stored for long periods of time. However unstained portions will continue to react to moisture from humidity, dew, or fingerprints, so care must be taken in their handling and storage.

    Comparing WSP brands

    The three commercially-available brands of WSP were subjected to a series of comparisons. The intention was not to rank these products, but to determine if they performed in a similar fashion and to alert users to any significant differences.

    Packaging and Appearance

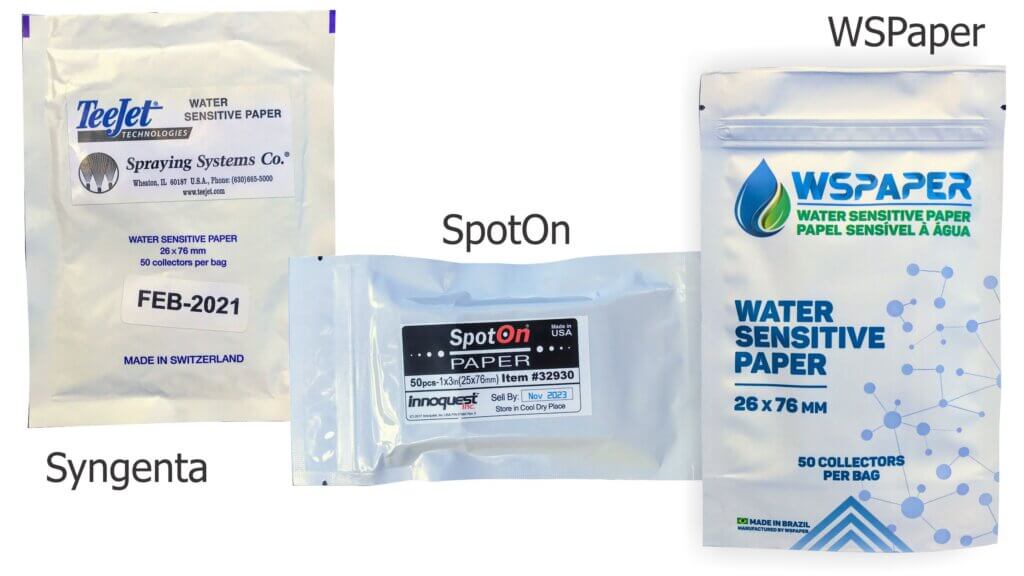
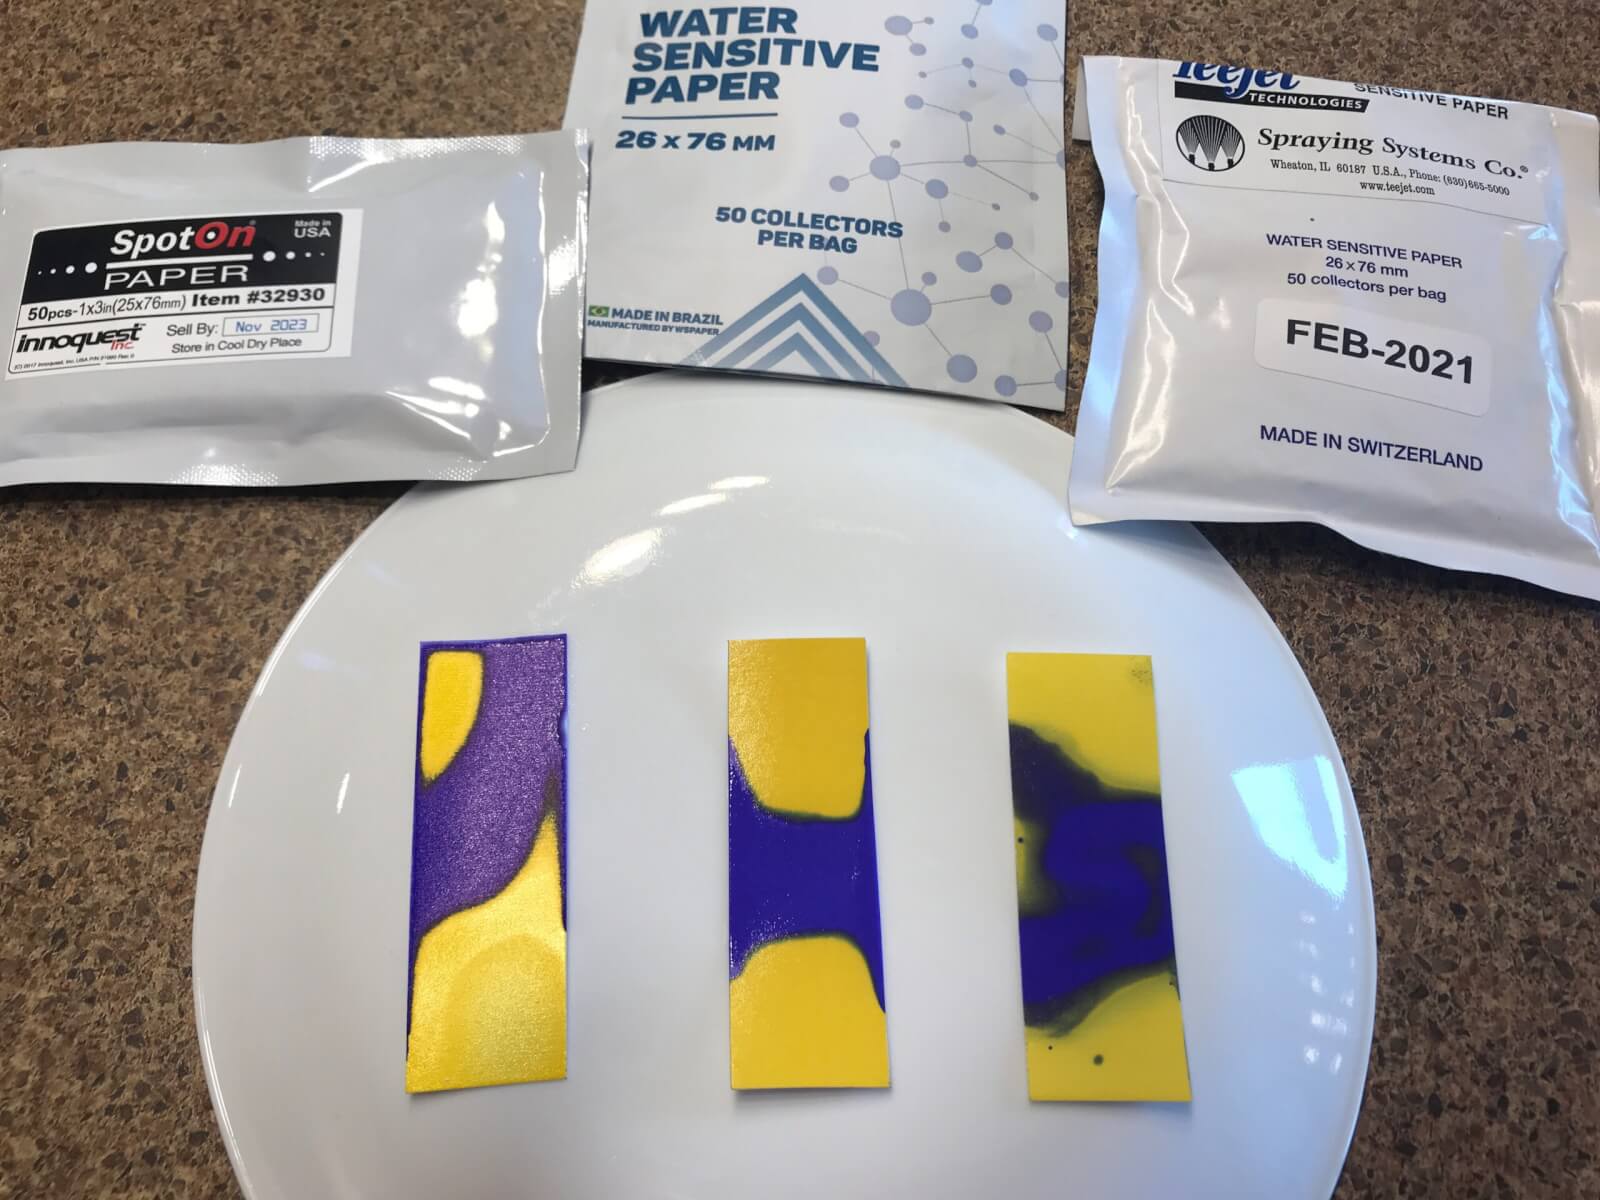
    Each package was donated for the study. The SpotOn (SO) papers had a “sell-by” date of November 2023, the Syngenta (SY) papers (provided via Spraying Systems Co.) were dated February 2021 and the WSPaper (WS) was their newest formulation (white package, not silver), received June 2021. The comparison was performed on July 5, 2021.

    WSP packages.

    Each product was a foil or plasticized bag of 50, 26 x 76 mm papers. SO and WS had a re-sealing feature similar to that of a sandwich bag. SO also included a package of silica gel desiccant to capture moisture and a pair of plastic forceps to facilitate handling.

    Users are encouraged to label papers to ensure they know their relative position and sprayer pass for later analysis. It was possible to write in ink on the faces of the SY and SO papers, but not WS. It was possible to write on the back of all brands.

    The three papers were different shades of yellow. Further, in the author’s experience, the colour can be visibly different between batches of the same brand. In the case of larger experiments where more than 50 papers are required, it would be prudent to ensure papers are not only from the same manufacturer, but the same production batch. This would not be an issue when subjectively comparing papers, but when using software that employs colour thresholding to identify deposits, it could create artifacts. Presently, only Syngenta has a batch number (found on a sticker on the back of the bag).

    Bleed-through

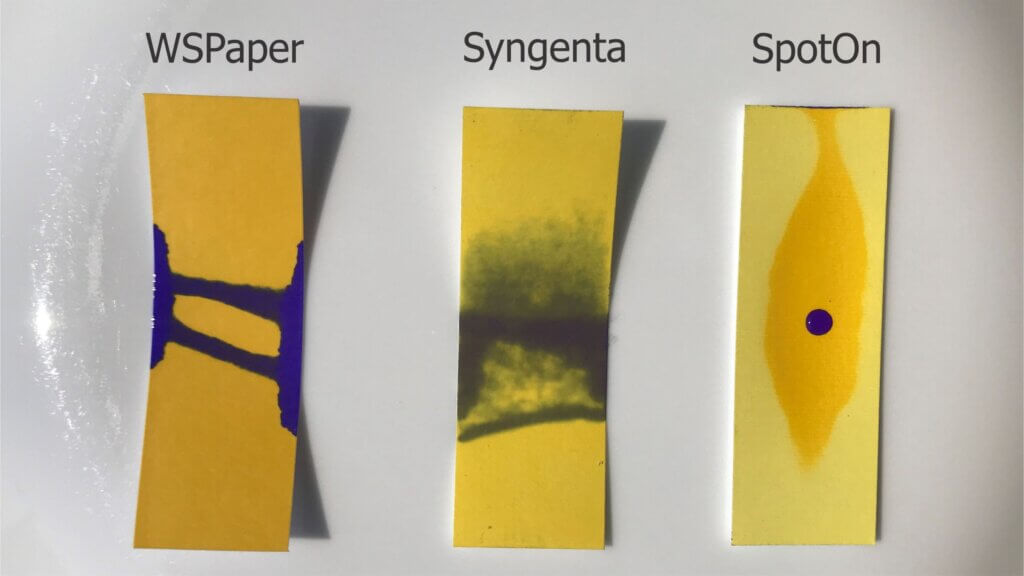
    WSP is often placed in foliar canopies which are subject to dew and transpiration that can cause the papers to react prematurely. This can be particularly limiting when moisture soaks through the backs of papers. Each brand of paper was placed face-up on a drop of water to see if the water would bleed through.

    Three brands were placed on a single drop of water. Within five minutes, WSPaper and Syngenta brands wicked the water through, causing a colour reaction. SpotOn did not, although the yellow surface darkened. When a drop of water was applied to the face, the SpotOn paper still produced a blue stain.

    WS quickly curled as the water wicked in from the edges. Within five minutes the water soaked through from the back as well. Within five minutes SY also curled, but the colour reaction was entirely due to water soaking through and not wicking along the edges of the paper. SO did not curl and there was no colour reaction save a minor wicking reaction at one edge. It did however produce a dark yellow patch. In order to see if a colour reaction was still possible, a single drop of water was placed on the face and the colour reaction was distinct and instantaneous.

    Note: Others have since replicated this experiment and reported that the response depends on the amount of water used and how long you leave it. We repeated our experiment with higher volumes and longer wait times (see image below). Ultimately, no brand of WSP is water proof from the back. Nevertheless, with small volumes of water (such as from dew) the original assessment of each brand is still valid.

    A replication of the bleed-through experiment with the same batch of papers was performed with higher water volumes and a longer duration. Eventually, all three brands bled through. (SpotOn left, WSPaper middle, Syngenta right).

    Deformation and drying time

    Users of water sensitive paper may be familiar with its occasional tendency to curl when one side is sprayed. In extreme cases, this movement could create smears if the paper contacted other wetted surfaces in dense foliage. The degree of curling was significantly different by brand, with SY becoming convex when wet and then flexing back into a concave form once dry. WS deformed as well, but only to a minor degree. SO did not appear to deform at all. Syngenta has noted that the degree to which their papers curl depends on the batch. Their manufacturing process has changed over the years in response to regulatory requirements and minor adjustments are still occasionally made.

    Once dry, each brand of WSP tended to curl to different degrees. Syngenta curled the most and SpotOn the least if at all.

    There was no appreciable difference in the time it took for any brand to dry. This is based on attempts to smear papers every 30 seconds. All were dry in under five minutes.

    Experimental design

    While there is considerable variability inherent to spraying, every effort was made to maintain consistent conditions. Papers were sprayed in a closed room with no appreciable air currents (21.5 °C and 64% RH). Papers were paired randomly, side-by-side on a plastic sled. The sled was pulled at 2.5 kmh (~1.5 mph) through the centre of a spray swath produced by a TeeJet XR80015 positioned 50 cm (20 in.) above the targets. The nozzle operated at 2.75 bar (40 psi) to produce ~270 L/ha (~29 gpa) with Fine spray quality. Six passes were made, producing four sprayed papers for each brand.

    All papers were dry to the touch after two minutes. They were removed to a cooler, low humidity space and were digitized and analyzed using the SprayX DropScope (v.2.3.0) within an hour of spraying. We noted that while WS and SO fit easily into the DropScope port, the SY papers were sometimes slightly wider and had to be forced. Learn more about how to digitize and analyze WSP in this series of articles.

    Screen capture from DropScope’s smartphone app.

    The “ground” option was selected, and each brand of paper was processed using its specific spread factor. DropScope has a detection threshold of 35 µm. This is appropriate as the smallest droplet diameter that can be resolved by any brand of WSP is ~30 µm (Syngenta, Innoquest, SprayX – Personal Communication).

    Percent surface covered

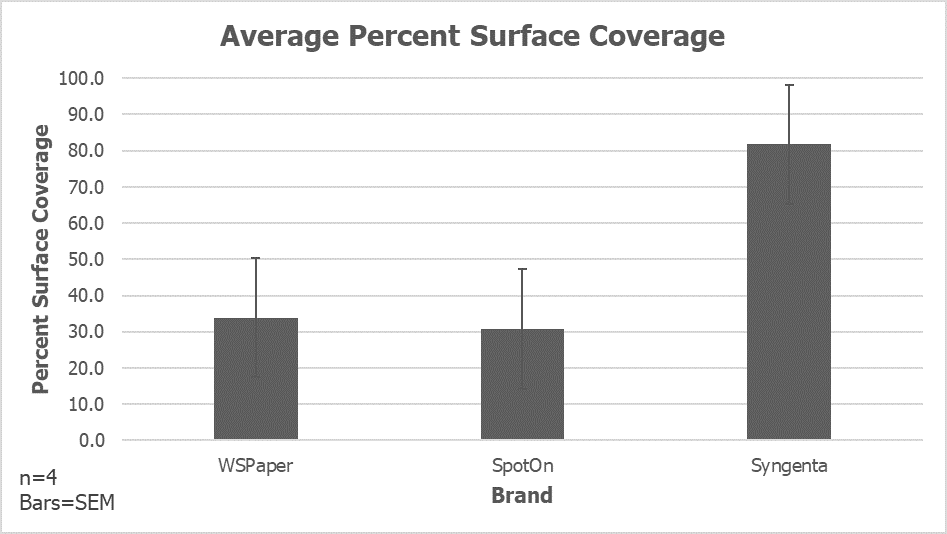
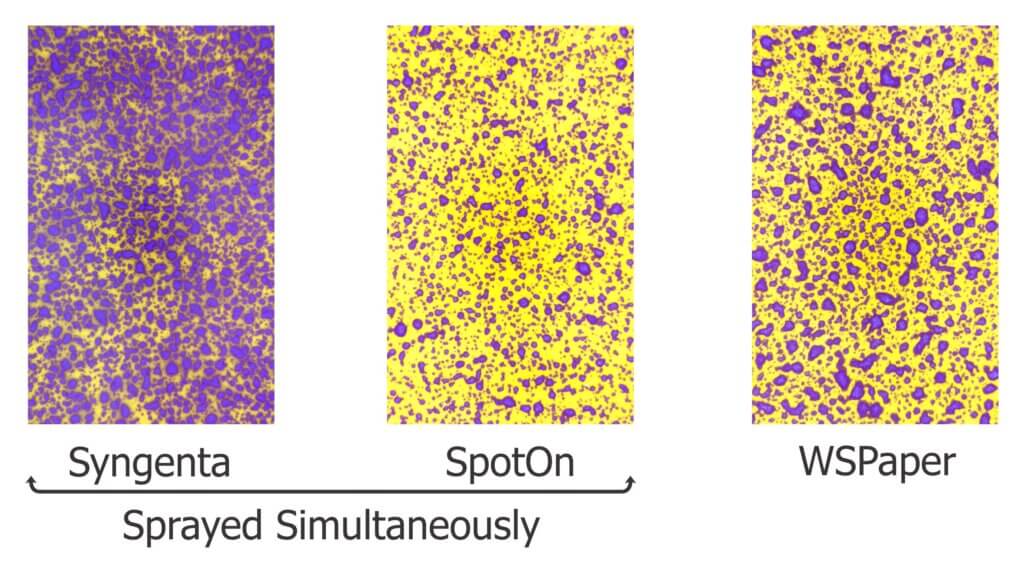
    The average percent surface covered was calculated with standard error of the mean for each paper. WS and SO produced similar values between 30 and 35%. While all three brands exhibited similar variability, SY approached saturation at approximately 80% coverage. Therefore, WSPaper exhibited a slightly higher degree of spread than SpotOn, while the Syngenta paper exhibited a significantly higher degree of spread.

    For reference, it can be difficult to determine if a stain represents a single deposit or is the result of multiple overlapping deposits. This becomes a problem when the surface of the WSP exceeds 20% total coverage. Further, it becomes increasingly difficult to distinguish a stain from the background, unstained surface when papers exceed 50% total coverage.

    Average percent surface coverage by brand.
    DropScope-digitized images of three brands of WSP. The Syngenta and SpotOn papers were sprayed simultaneously while the WSPaper was sprayed in a subsequent pass. WSPaper exhibited a slightly higher degree of spread than SpotOn, while the Syngenta paper exhibited a significantly higher degree of spread.

    Deposit density

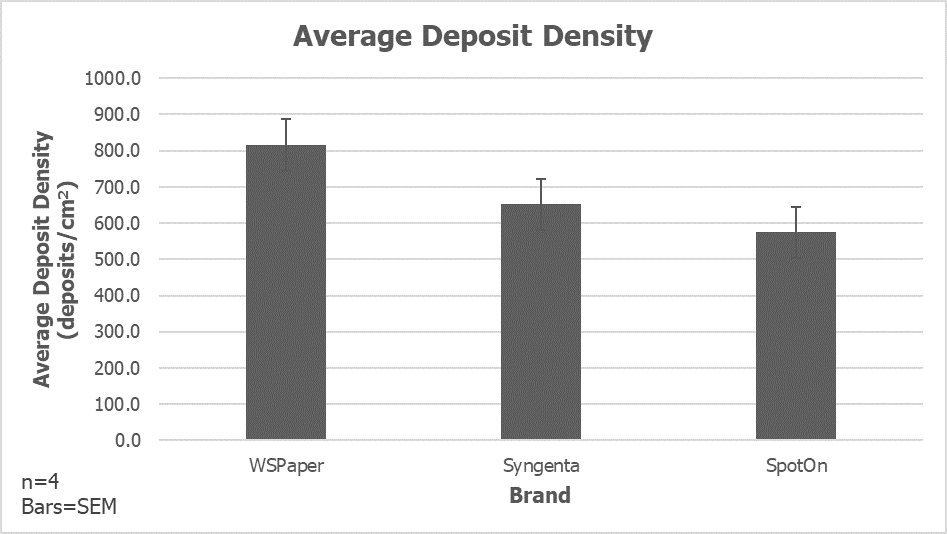
    The average deposit density is a count of discrete objects (i.e. stains) per cm2. WS appeared to resolve the highest count, followed by SY and then SO. The process for determining what is a discrete object, and not the result of anomalies such as overlapping deposits, elliptical deposits or imperfections in the paper itself is complicated and computationally heavy. The algorithms employed by DropScope treated each paper consistently. So, while some differences are attributed to variations in spraying, they also reflect the paper’s innate ability to resolve individual deposits.

    Average deposit density was highest for WSPaper, then Syngenta, then SpotOn. Variability was similar in all cases.

    Droplet diameter

    It is not the intent of this article to determine if WSP should be used to extrapolate the original droplet size. The many assumptions and inconsistencies inherent to this process are well known. Nevertheless, some researchers do use WSP in this manner, so a comparison was warranted.

    DropScope bins deposit diameters by size to produce histograms of deposit size by count. These stain diameters are used to extrapolate DV0.1, DV0.5 (VMD), DV0.9 and NMD, which describe the population of droplets that produced the stains. DV0.5 is the Volume Median Diameter, or the droplet diameter where half the volume is composed of finer droplets and the other half by coarser droplets. Number Median Diameter (NMD) is the droplet diameter where half the total droplets are finer, and half the total droplets are coarser.

    Each brand of WSP will permit a certain degree of spread when a droplet of water contacts the surface. This spread factor is specific to the brand of paper. Further, the spread factor is not constant for all droplet sizes; Finer droplets will spread less than coarser droplets.

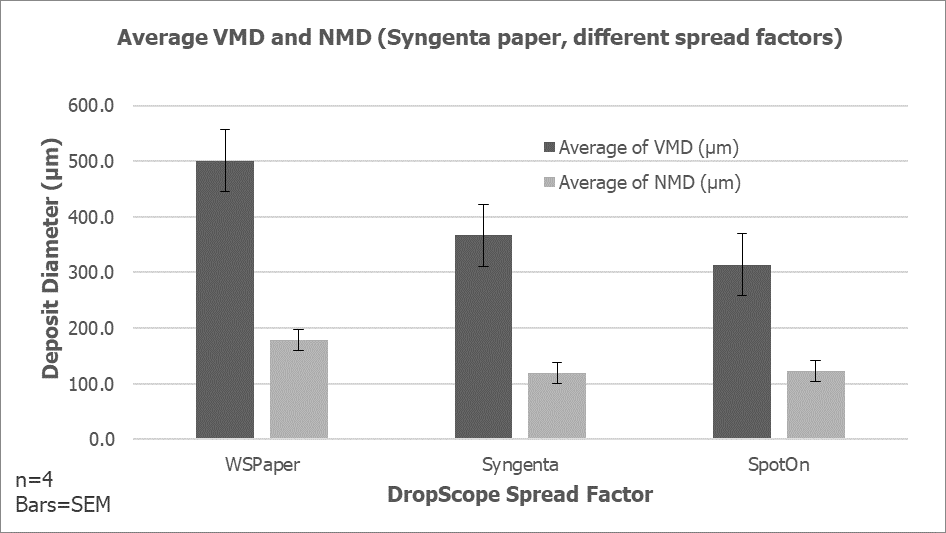
    When processing data using DropScope, selecting the appropriate spread factor makes a significant difference to the output. For example, here are the same four SY papers processed using the Syngenta-specific spread factor as well as the spread factors intended for SpotOn and WSPaper.

    The same four Syngenta papers were processed by DropScope using the Syngenta-specific spread factor as well as the SpotOn and WSPaper spread factors. The resulting VMD and NMD were very different.

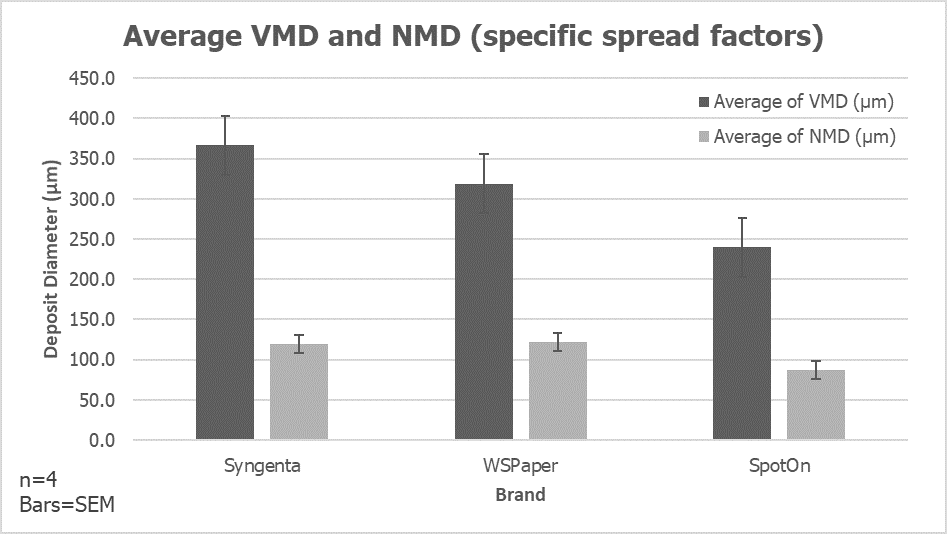
    Therefore, each brand of water sensitive paper was analyzed using its brand-specific spread factor (according to DropScope), to produce the following graph.

    Three brands of WSP processed by DropScope using their specific spread factors. VMD differed by as much as 30%.

    SY produced a VMD higher than that of WS, and both were higher than SO. There was less variability in the NMD, but this was expected given the high droplet count on the finer side of a hydraulic nozzle’s droplet size spectrum.

    Conclusion

    Water sensitive paper has immeasurable value in agricultural spraying. It is far more important to encourage its use than to quibble over brands. However, when these tools are used for more rigorous evaluations of spray coverage, brand-specific variability must be addressed.

    The differences in how each brand responds to moisture (i.e. discolouration and deformation) may factor into which brand is most appropriate for a given situation. Further, there appear to be significant differences in how each brand resolves coverage. Once again, this may be irrelevant for those spray operators who occasionally use WSP to inform their spraying practices, but for consultants and researchers it is suggested that they use a single brand for an experiment, with papers produced in the same batch run.

    Syngenta, Spraying Systems Co., SprayX, WSPaper and Innoquest are gratefully acknowledged for their contribution of materials and time informing this article.

    2026 Update

    If there’s one thing that stays the same, it’s that nothing stays the same. Formulations and manufacturing processes change. According to SprayX, manufacturers of the DropScope, all three of the papers described in this article (written in 2021) have changed in recent years. Some have improved and others can create potential errors in digitizing coverage. The following points may require a deeper understanding of how WSP is digitized and analyzed. Refer to this series of three articles.

    Be aware of the following best practices when using WSP:

    • Be aware of package expiration dates. Expired paper will work differently from new paper, creating an artifact in analysis.
    • Papers with bright, reflective surfaces can cause an underestimation of deposit counts (specifically the smallest deposits).
    • Best results are obtained when using water for testing. Adjuvants and pesticide co-formulants have minor impacts on spread, but can also change the how the paper changes colour, making thresholding difficult.
    • Beware papers that create stains with bright borders and faint (hollow) centres (see image below). This can lead to an underestimation of volume median diameter. If your camera or scanner permits, examine the coverage in binary (e.g. black and white) for more accurate results.
    • Do not sample the edge of the WSP (leave at least a mm) to avoid edge effects such as wicking and partial impacts. Some scanners have a setting, or you can select the area manually.
    • Note the physical shape of the paper itself. Inconsistencies in the length and width (cutting errors) can make papers difficult to use in certain scanners, and curled papers cause changes in perspective and focal distance that can lead to errors.
    • When not using a sealed camera or scanner (e.g. DropScope or flatbed), changes in the camera angle, shadows, lighting conditions, and make/model of cellphone camera will affect the results. Be consistent.
    Stains with faint centers may not register correctly with some software. This could be due to adjuvants in the liquid, or issues with the coating itself. Other issues might include inconsistent coatings that are either too thick or to thin affecting the reaction to water.
  • Establishing an Optimal Airblast Carrier Volume

    Establishing an Optimal Airblast Carrier Volume

    North American product labels may or may not include carrier volume recommendations. When they do, it could be based on a two-dimensional value like the planted area, or perhaps on row length which is more appropriate for trellised crops that form contiguous hedge-like canopy walls. Volume may also be tied to product concentration, which sets minimum and maximum volumes based on product rates. Or, more commonly, volume recommendations take the form of vague guidelines such as “Spray to drip” or “Use enough volume to achieve good coverage”.

    In all cases, spray efficacy and efficiency can be greatly improved by dialing-in the carrier volume to optimize coverage uniformity and reduce off-target spraying. This is easier said than done because the optimal spray volume is case-specific. It depends on a complicated relationship between:

    • Weather conditions (E.g. temperature, humidity, wind speed and direction)
    • Sprayer design (E.g. air handling, droplet size and flow distribution over the boom)
    • Traffic pattern (E.g. every row or alternate row)
    • Product chemistry (E.g. mode of action and formulation).
    • Target (E.g. Crop morphology, planting architecture)

    It is the final variable, the nature of the target, which is the focus of this article. To learn more about the other variables, grab a copy of Airblast101.

    The plant canopy and planting architecture dictate volume

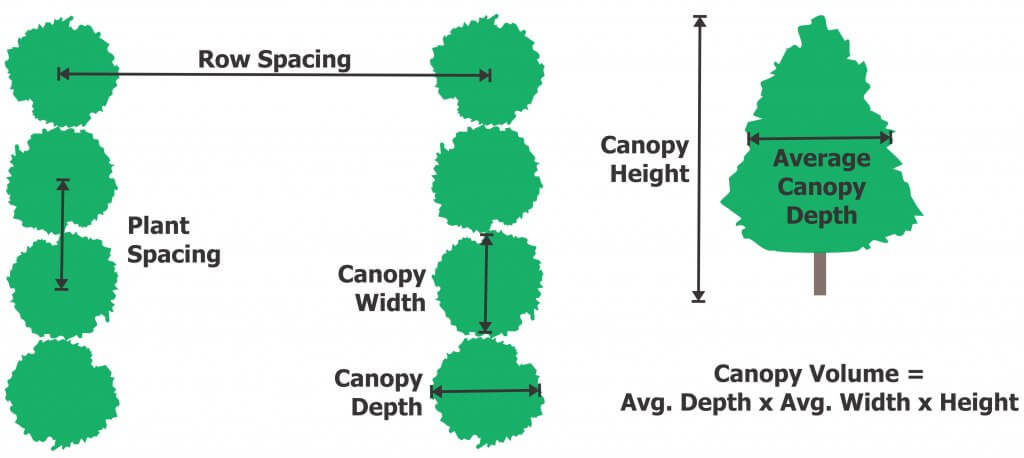
    Quite often, the target in airblast applications is the plant canopy. The plant canopy is the collective structure containing all plant surfaces. This could be the foliar portion of a single pecan tree, a panel of grapes, or a bay of container crops. The planting architecture describes how those canopies are arranged on the planted area. If we consider the canopy and architecture geometrically, we can make relative statements about the volume required when all other variables are equal.

    Six geometric characteristics of the plant canopy and planting architecture.
    Geometric CharacteristicRelationship to Carrier Volume (per unit planted area)
    Row SpacingThe greater the row spacing, the less volume needed.
    Plant SpacingThe greater the plant spacing, the less volume needed. This assumes gaps between the canopies (I.e. not a contiguous hedgerow).
    *Canopy DepthThe greater the canopy depth, the more volume needed.
    *Canopy WidthThe greater the canopy width, the more volume needed.
    *Canopy HeightThe higher the canopy, the more volume needed.
    Canopy DensityThe denser the canopy, the more volume needed.
    *The product of average canopy depth, width and height is the canopy volume. This value forms the basis for many dose expression models and historic carrier volume calculators such as Tree Row Volume.

    Canopy density

    Let’s focus on a single plant canopy. Research has demonstrated that with the possible exception of canopy height, canopy density has the greatest influence on optimal sprayer settings.

    Density describes the amount of matter inside a canopy relative to the volume of space it occupies. The denser the canopy, the more surface area there is to cover and the more difficult it is for spray to penetrate.

    While air handling plays a significant role in improving coverage, a denser canopy will almost always require a greater carrier volume.

    When two physiologically diverse blocks share an alley, use the sprayer settings suitable for the larger of the two. It’s more important to ensure good coverage on the big block than to save on the smaller.
    When two morphologically-diverse blocks share an alley, a two-sided, every-row sprayer should employ settings suitable for the larger of the two. It’s more important to ensure good coverage on the big block than to save on the smaller. Once the hybrid row is sprayed, settings should be modified to suit the block.

    For most perennial crops, canopy density changes over the growing season. The influence of age and staging on canopy size and density will depend on the crop variety, plant health and canopy management practices. The practical implication is that as the canopy grows and fills it typically warrants an increase in spray volume.

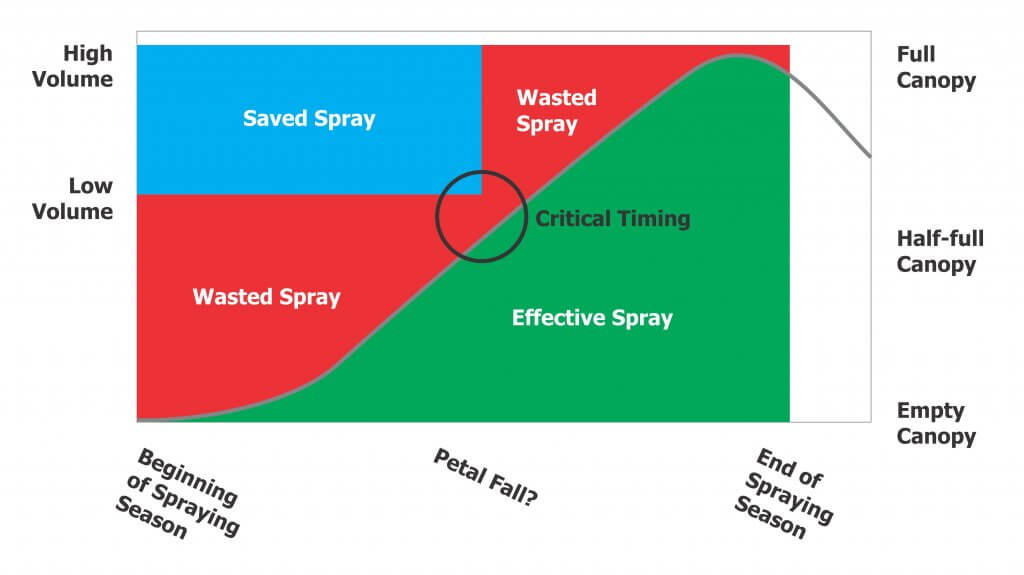
    As illustrated in the figure below, the volume used should reflect the current stage of canopy development. If a volume suitable for the densest and largest stage of development is used all season, it will create a great deal of waste early in the season. However, if volume is increased incrementally to reflect canopy growth, a better fit between coverage and volume will minimize waste.

    Note that volume is increased around petal fall, but the fit could be improved with more increments. Caution is advised to ensure the volume is raised (if required) prior to immediate need, particularly during key developmental stages like bud break or bloom where fungicide coverage is critical.

    The curved line represents the leaf area in a canopy (Y-axis, right) increasing over the growing season (X-axis). The volume of the spray (Y-axis, left) providing effective coverage is indicated in green. Spraying the same volume throughout the season means a lot of over-spray (red) early in the season. The target simply isn’t there yet. Using less volume early season and changing about midway through the season, or as required by canopy development, has the potential to save a lot of spray (blue) without compromising spray coverage. Note that the first volume should give sufficient coverage to reach mid-season, and the second volume should be sufficient to reach the end of the spraying season. Always err on the side of excessive coverage to buffer against the impact of unanticipated variables.

    There are exceptions to this rule. Many nursery crops and mature evergreens often do not require changes to volume. High density apple orchards may or may not require an increase in volume. Early in the season, sparse canopies have low profiles that result in very low catch efficiencies. In other words, a great deal of spray misses the target.

    The amount of waste is a function of the application equipment design and the weather conditions. Most low-profile axial airblast systems envelop the target in spray with limited means of reducing air energy sufficiently, or to turn off the spray between trees.

    Further, sparse canopies do not restrict wind, which means ambient wind speed tends to be higher early in the season compared to when the trees become wind breaks. This creates a drift-prone situation and higher volumes are often used to compensate for the loss. The collective result is that excess spray volume is inevitable early season.

    As the canopies fill, the wind is reduced and catch efficiency increases, so trees intercept more spray without having to raise volumes. This balance eventually tips, however, and an increase in volume may be advisable.

    Watch the following video to see the impact of using excessive spray volume (and poor air adjustment settings) in a young cherry orchard. The waste becomes particularly apparent at ~43 seconds when the sprayer passes in front of the woods and the plume can be seen with higher contrast.

    While some loss is inevitable in such a sparse canopy wall, this situation could be improved by using less carrier volume, larger droplets, the correct air settings, canopy-sensing optics and/or a tower or wrap-around sprayer design.

    Adjusting spray volume sprayer settings to reflect the canopy can save money and reduce environmental impact during early-season applications and in young plantings. Mix the tank as you normally would to maintain the pesticide concentration on the label, but adjust the sprayer output to match the plant size.

    Performed correctly, you will be able to go further on a tank without compromising efficacy. This crop-adapted spraying method and the relationship between spray volume, concentration and dose are described further in this article and this article.

    Estimating volume from canopy geometry

    It is challenging to decide on an appropriate spray volume. Many operators resort to historical or regional practices and do not make adjustments to reflect their specific situation. Others refer to models such as Tree Row Volume (a.k.a. Canopy Row Volume) which relates canopy volume per planted area to spray volume.

    In this case, catch efficacy is expressed as a coverage factor, which is determined through experimentation specific to the crop, environment and sprayer.

    Tree Row Volume = (Avg. Canopy Height × Avg. Canopy Spread × Planted Area) ÷ Row Spacing

    Spray Volume = Tree Row Volume × Coverage Factor

    In New Zealand, coverage factors for dilute applications to deciduous canopies range from 0.07 to 0.1 L/m3 (0.00052 to 0.00075 US gal/ft3) or 71 to 100 ml/m3 (0.067 to 0.096 US oz/ft3). The range captures variation in canopy density and any product-specific coverage requirements. Oil sprays, for example, require more surface coverage than most products. While closer to “the truth”, the Tree Row Volume method is still only an estimate.

    If the operator has no prior experience with the crop or the sprayer and wants a sanity-check on their estimated spray volume, we propose the following guidelines for full canopy dilute application to mature crops using every-row traffic patterns. The volumes may seem high, but recognize we have selected a very challenging scenario.

    • Small canopies (E.g. bush, vine, cane, high-density fruiting wall): 500 L/ha (55 US gal./ac.) to 1,000 L/ha (110 US gal./ac.).
    • Medium canopies (E.g. tender fruit, pome): 750 L/ha (80 US gal./ac.) to 1,250 L/ha (135 US gal./ac.).
    • Large canopies (E.g. tree nut, citrus): >2,000 L/ha (214 gal./ac.) and up tp 7,000 L/ha (748 US gal./ac.).
    • For sprayer operators that think in 100 m row lengths, consider 20 L volume per 100 m row length per 1 m canopy height.

    Further Resources

    No matter the approach to determining spray volume, it is imperative that coverage is assessed. It is amazing what we ask of airblast sprayers. Read this short article for some perspective on the coverage we hope to achieve from a given spray volume.

    We propose the use of water-sensitive paper to assess spray coverage. We describe its use and evaluation in detail in this article, this article and in this article.

    Dialing-in an optimal spray volume is an iterative process that requires careful observation and keeping records on what works and what doesn’t for your specific operation.

    Jon Clements (University of Massachusetts) has noted special considerations when it comes to establishing effective volumes for plant growth regulators that go beyond this article. You can explore the concepts in this 2021 factsheet (Spray Mixing Instructions – Considering Tree Row Volume) by Terence Robinson and Poliana Francescatto (Cornell University) and Win Cowgill (Professor Emeritus, Rutgers University).

    Finally, if you really want to get lost the weeds, check out this video recorded in 2021. I had an opportunity to learn from pros like Dr. Terence Bradshaw (University of Vermont) and participants from the Great Lakes region. They’ll tell you all you ever wanted to know about Tree Row Volume. Settle in!

    Thanks to Mark Ledebuhr of Application Insight LLC for his contributions to this article.

  • Wanted: A New Technology for Assessing Spray Coverage – The Spray Doctor

    Wanted: A New Technology for Assessing Spray Coverage – The Spray Doctor

    “If you can’t measure it, you can’t improve it”. While the source is nebulous (Peter Drucker, Lord Kelvin, or Antoine-Augustin Cournot), the sentiment is clear.

    The status quo

    In the world of crop protection, considerable resources are expended to distribute a pesticide over a target. And yet, sprayer operational settings and spray coverage are rarely assessed. As a result, too much time elapses between the application and observing the biological results to evaluate and correct equipment performance. The damage (be it waste or an inconsistent and sub-lethal dose) is done. All sprayer operators know this to be true, so why do precious few perform these assessments?

    Perhaps, dear reader, you have personal experience assessing coverage and already know the answer. Perhaps you’ve performed the iterative dance that is placing, spraying, retrieving, assessing and re-placing water sensitive paper (WSP). Perhaps you’ve sprayed fluorescent tracers and hunted for faint glows at twilight using UV lights. Perhaps you’ve looked for residue from diatomaceous earth or fungicides. Or, perhaps, you’ve trusted in the falsely-comforting “shoulder check” and assumed dripping must mean you’ve hit the target.

    Existing methods are complicated, subjective, messy and time-consuming. We need an alternative.

    The alternative

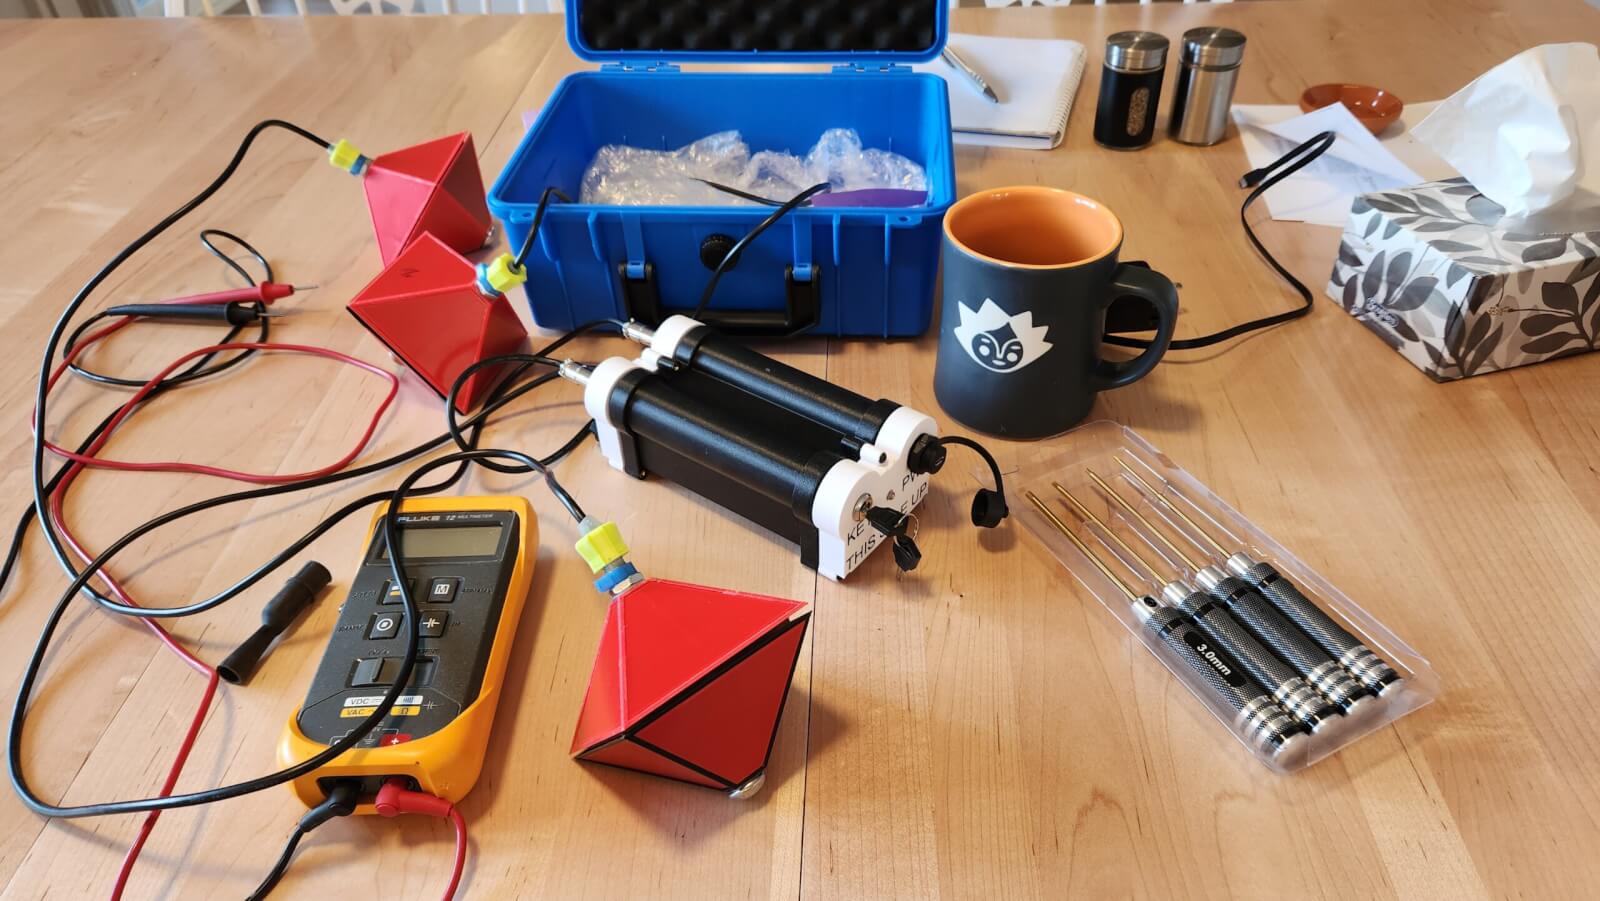
    Consider a permanent, solar-powered sensor that supplies real-time spray coverage data to your smartphone via a cellular connection. The output could be visualised in a simple and intuitive way, and immediately available to both sprayer operators and farm managers. If the sensor was relatively inexpensive, sufficiently hardy, and easy to deploy, its utility would only be limited by your imagination:

    • Stakeholders could confirm the correct functioning of their equipment before committing to the application. Decisions could be made to change operational settings, repair equipment, or delay until conditions improved.
    • The sensors would provide coverage data specific to their location and orientation. Units could be installed in difficult-to-spray regions such as treetops, or canopy-centres, or fruiting zones. Sensors could be placed where pest/disease pressure has been historically high, or where wind is a known issue.
    • Large operations could install them in a test-row, where sprayer operators would perform a gauntlet-style calibration run prior to a day of spraying.
    • Spray records could inform compliance audits, supplement insurance or CanadaGAP traceability requirements, or be used in agronomic assessments.

    In 2025 I was approached by an Australian developer who claimed he had a device that did all of this. And, if that weren’t enough, it could also monitor certain meteorological factors such as pre-spray moisture levels and temperature and report post-spray evaporation rates. I could barely contain my excitement. A prototype was in my hands a few weeks later.

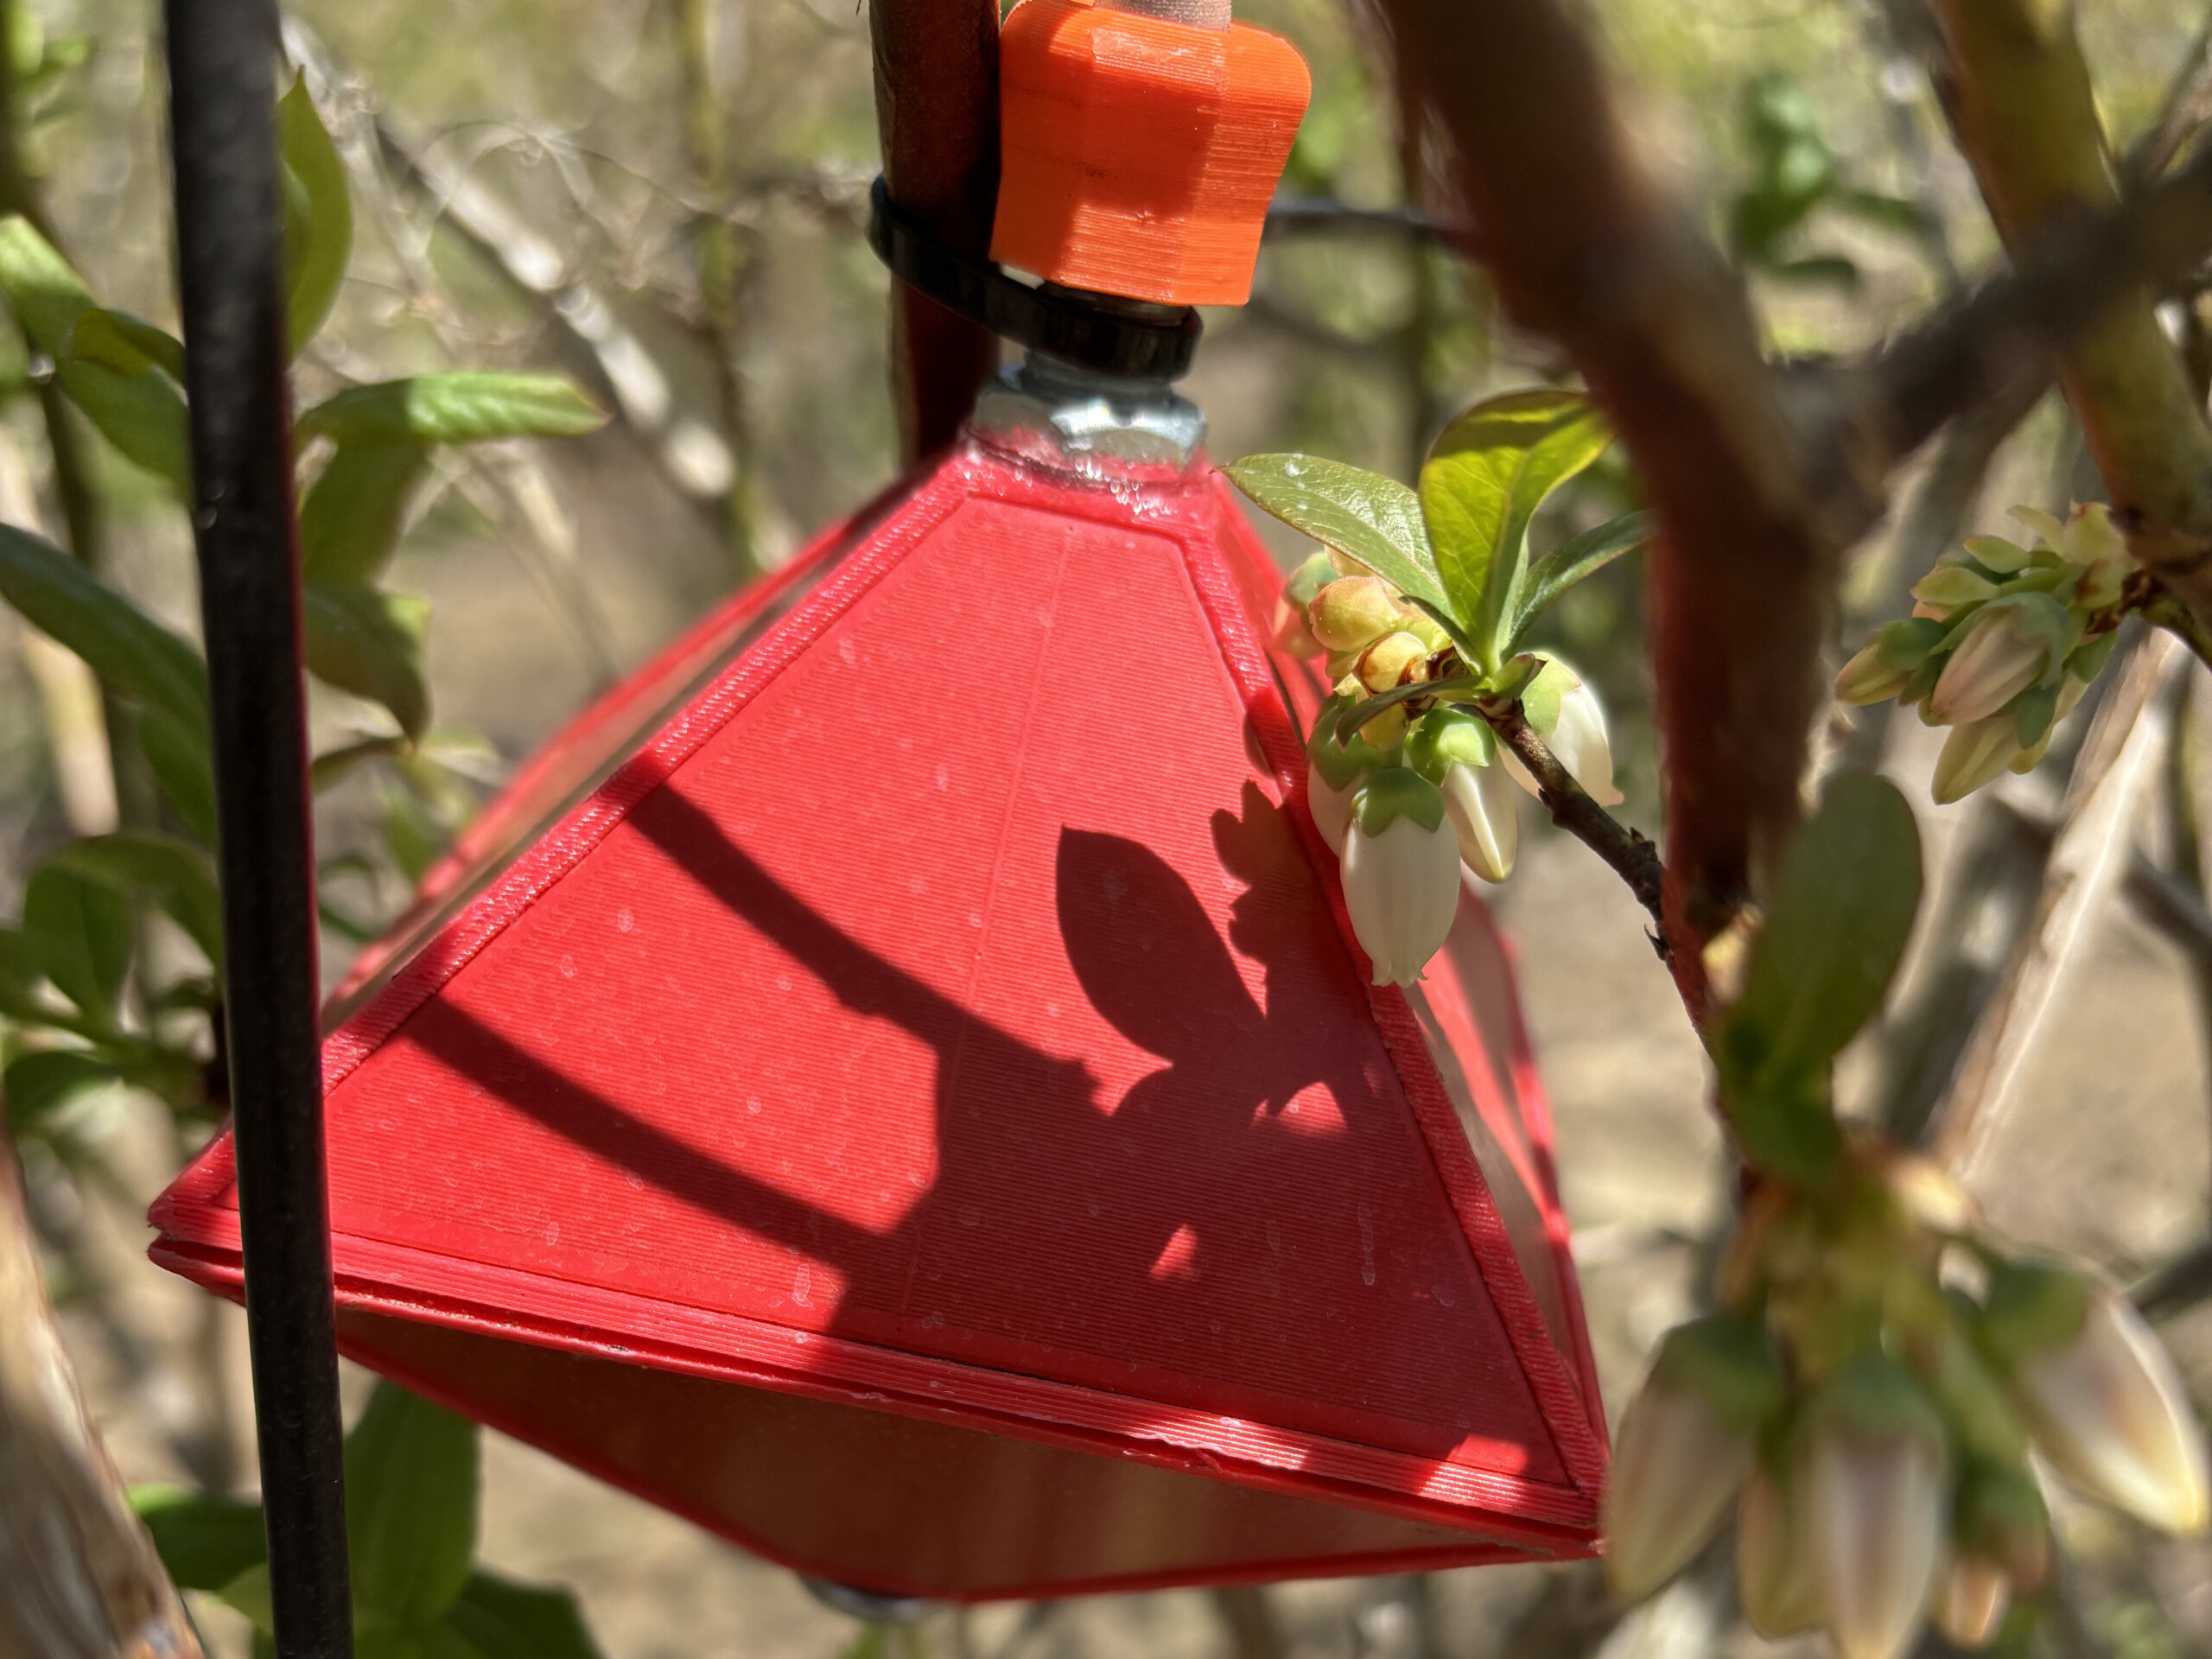
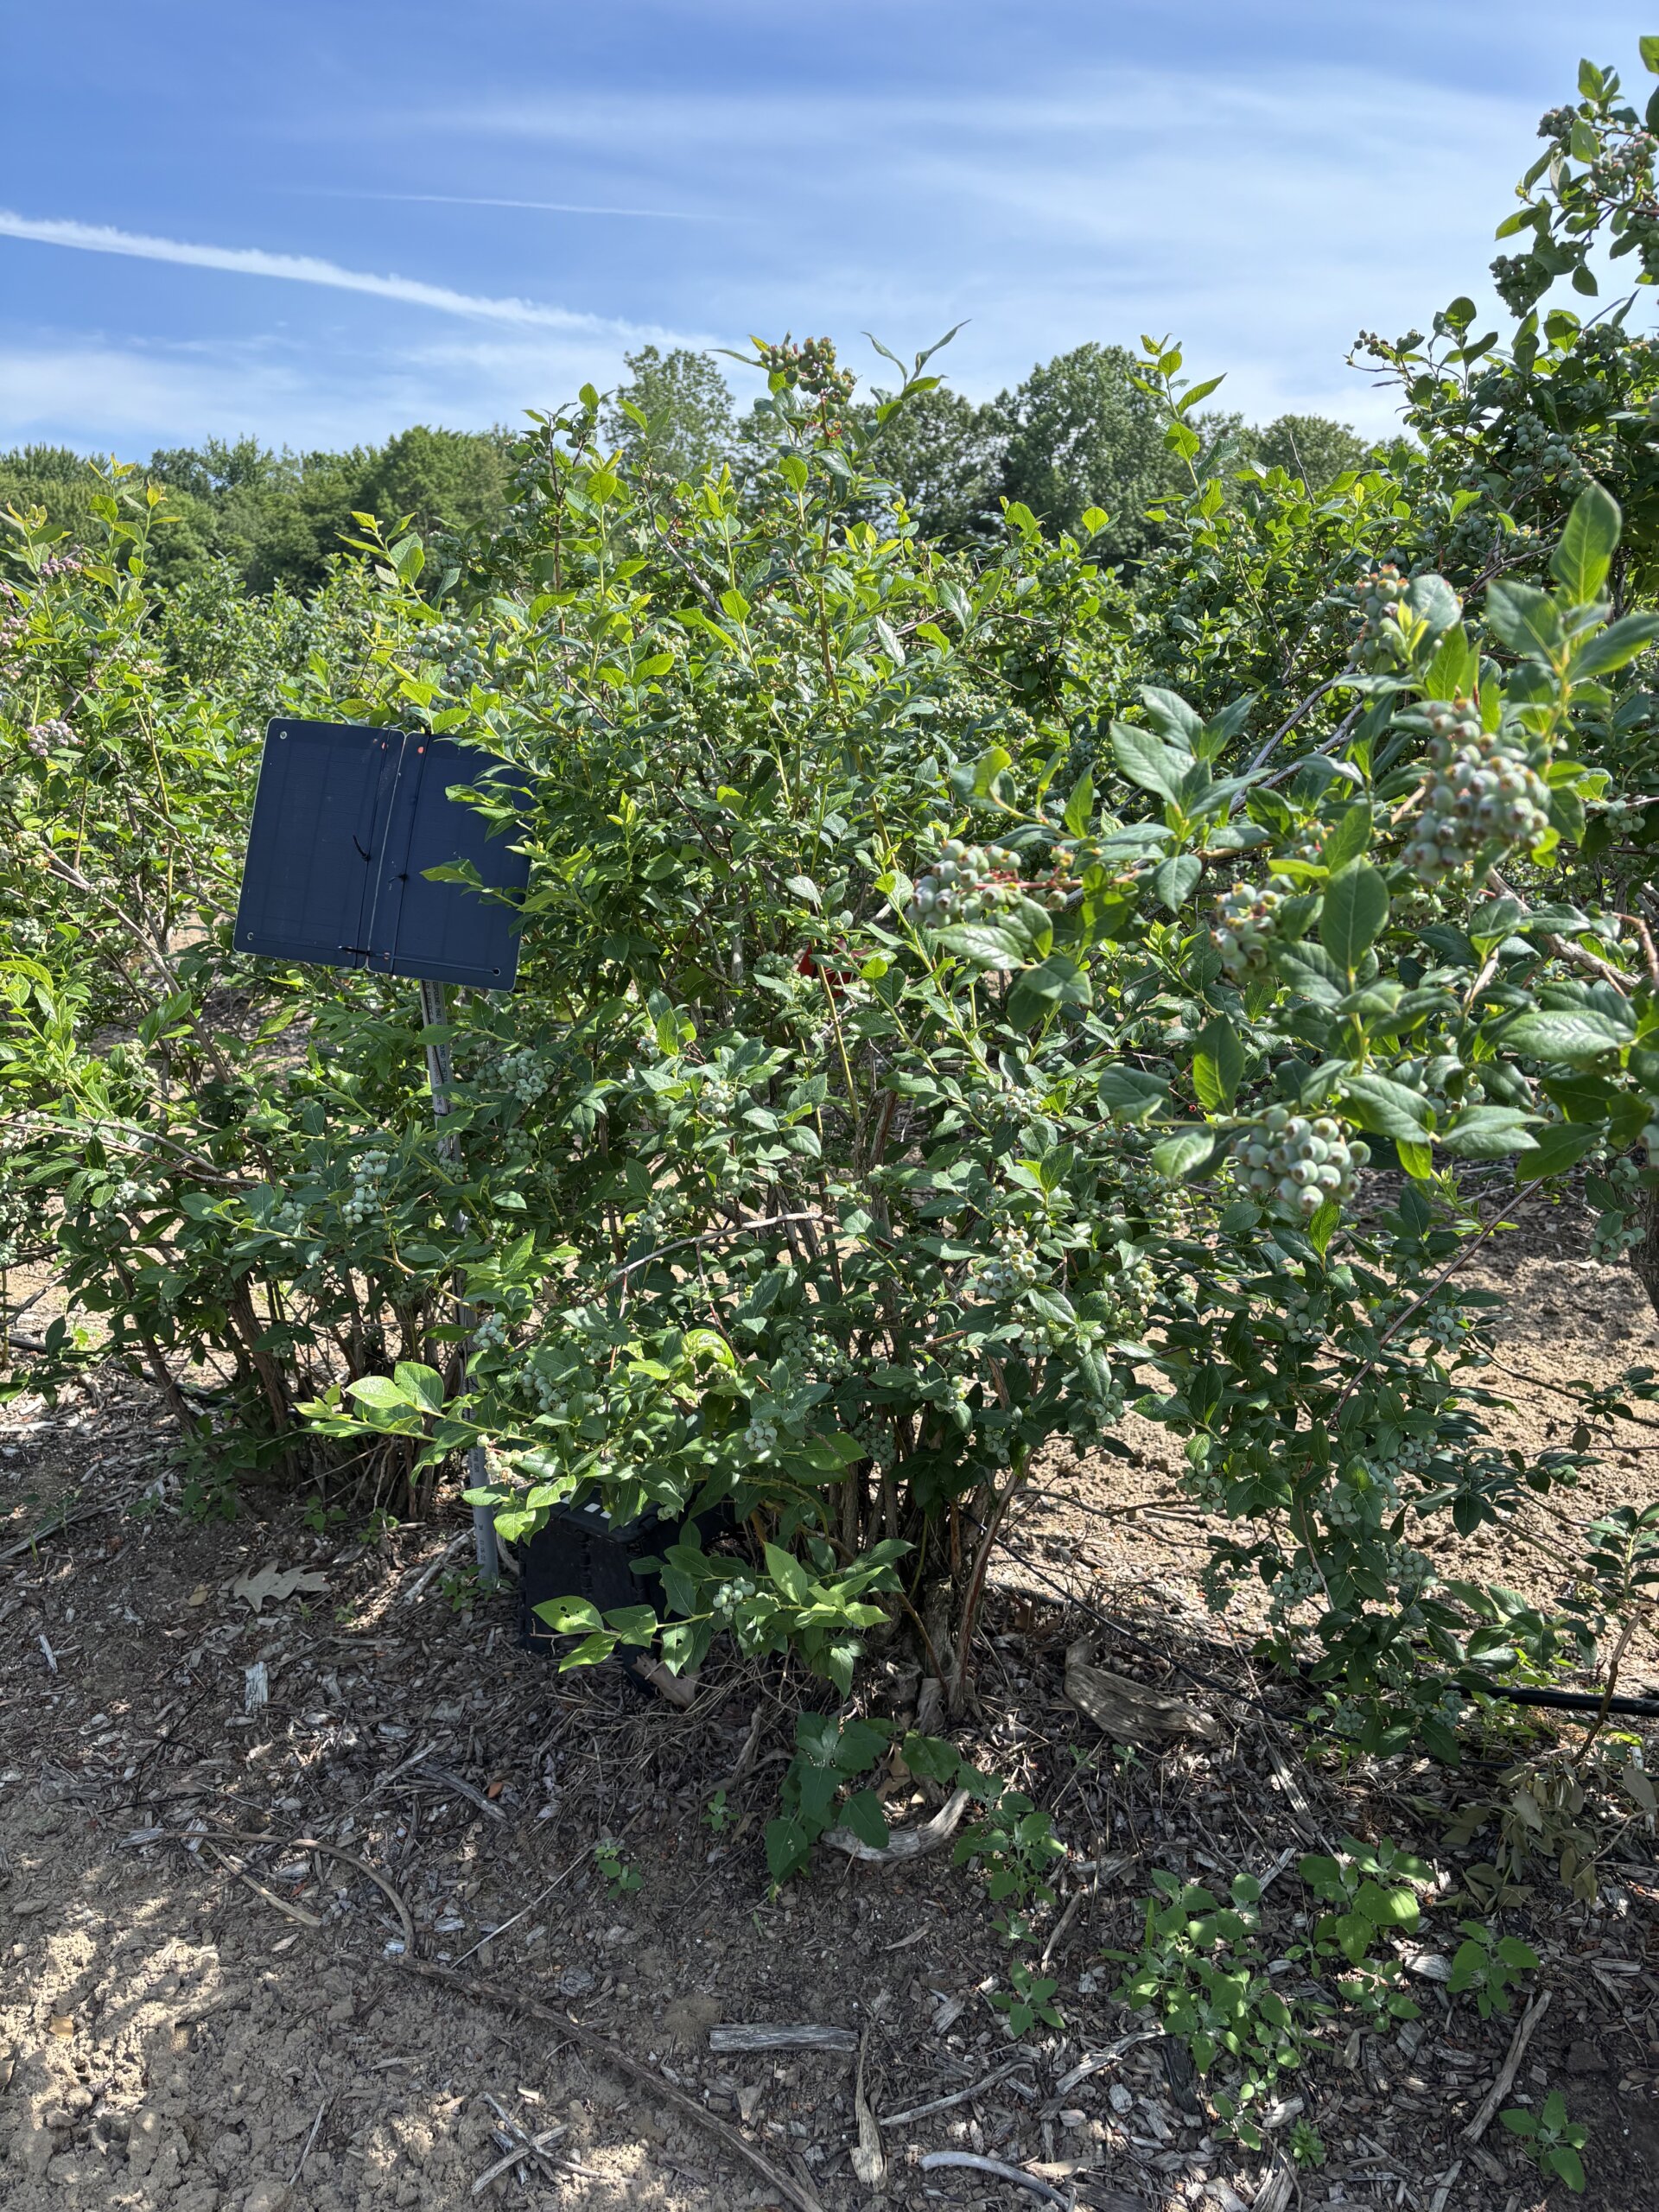
    Prototype, 8-sided sensor located in a blueberry bush.
    Solar panel powering three, 8-sided prototype sensors spanning 10 meters of highbush blueberry.

    Benchmarking the sensor

    The Spray Doctor (working name for the prototype) started its life as a leaf wetness sensor, evolving into a spray coverage sensor piloted in 2023/24 in Australian and New Zealand grape production. The history of earlier iterations and company schisms is convoluted, and fortunately immaterial to our purposes. All I needed to know was that we weren’t starting from scratch. Several of the questions regarding how accurately the surface could detect spray deposition were already addressed by independent research.

    The sensing surface is impregnated with an array of capacitive wetness sensors. The sensor responds to the surface area covered and not deposit density. Researchers reported a reliable response range between ~10% and 50% surface coverage. Given the arguable “ideal” coverage standard of 10-15% surface area, this includes the range of interest for most sprays.

    Benchmarking against WSP was part of the foundational assessment. A droplet of water deposited on WSP produces a high angle of contact and very little spread, while the same droplet deposited on plant tissue tends to produce a lower angle of contact and more spread. This means the stain produced on WSP is smaller than would be produced on plant tissue, depending on how smooth, vertical or waxy the tissue surface was.

    It was therefore surprising that WSP were found to report a higher degree of spray coverage during water-only sprays than the sensor. It seemed droplets more easily coalesced and ran off the sensor surface. This was ultimately interpreted as an advantage, because the sensor would better emulate how a leaf surface would respond to the influence of surfactants and spray quality.

    Adding a surfactant to a spray solution improves droplet adherence, and/or reduces surface tension, improving the degree of contact on plant surfaces. Likewise, it was found that surfactants increased the degree of coverage reported by the sensor, and when actual chemistry was sprayed (e.g. sulphur powder or copper sulfate) there was an effect on the degree of coverage reported. This is unlike WSP, where adjuvants and chemistry do little to increase the spread.

    And so, like every method for assessing spray coverage, the sensor has limitations and caveats. If you have some doubt as to the sensor’s accuracy, do not get distracted by the fine detail. Remember, most operators currently have no feedback whatsoever; even a binary response (e.g. hit or miss) would be welcome. The sensor is sufficiently sensitive and consistent to resolve coverage in a range relevant to most sprays, and therefore worth field testing.

    The experiment

    My role in this story was to work with a grower to evaluate the sensor’s ability to report coverage information in a clear and actionable way. There were three questions:

    • Does data from the sensor influence a sprayer operator’s behaviour?
    • Does that change in behaviour lead to improved spray coverage (implying more efficient and effective crop protection).
    • Could we “dial in” the hardware and the interface based on the grower’s feedback?

    In part two, we share our experience installing and using the Spray Doctor, as well as supply answers to these questions. Stay tuned.

    Thanks to Brandon Falcon (Falcon Blueberries) for volunteering his time and farm for this evaluation, and the developer for the in kind donation of the prototype Spray Doctor.