Category: Calibration

Horizontal boom sprayer calibration

  • Broadcast Boom Nozzle Spacing

    Broadcast Boom Nozzle Spacing

    North American built boom sprayers have nozzle spacings of 20” (50 cm in the rest of the world), but other spacings such as 15” (37 cm) and 10” (25 cm) also exist. What are the reasons for these alternative spacings and do they offer any inherent advantages?

    Why spacing matters

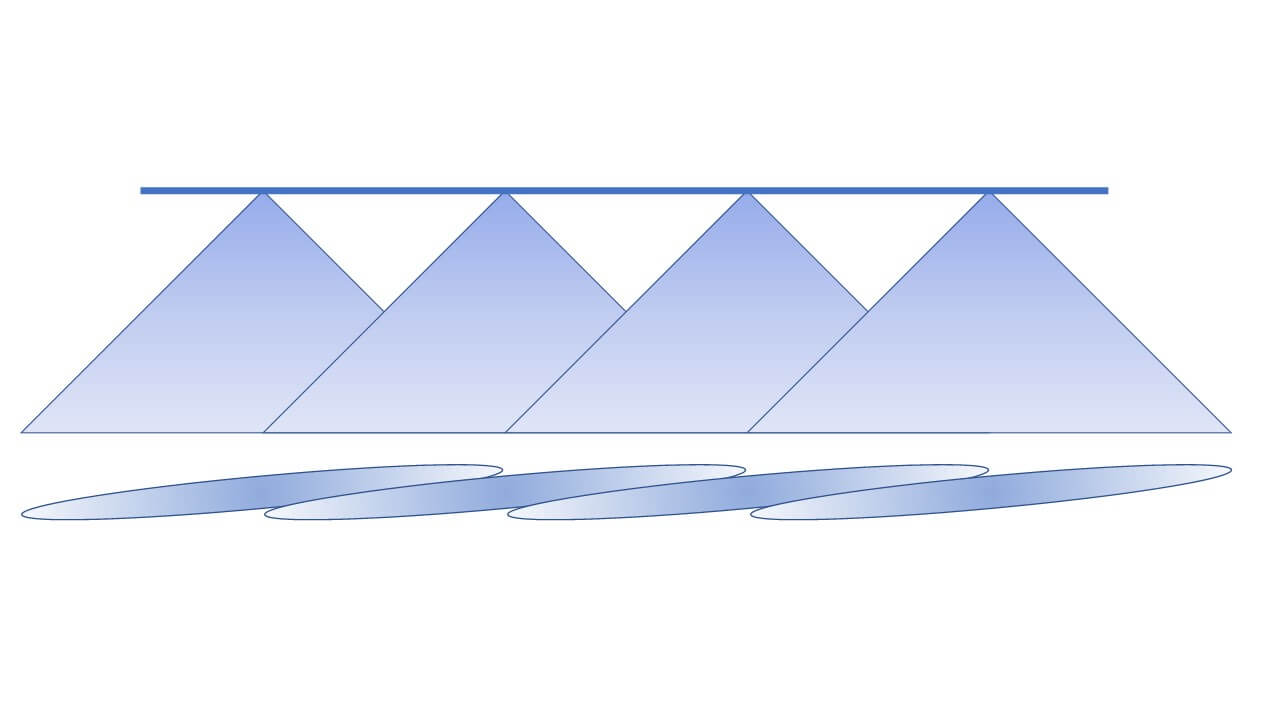
    Nozzles are spaced along a boom to allow their fans (patterns) to overlap sufficiently at the target. In broadcast spraying, a uniform distribution of spray volume gives us the best chance for consistent coverage along the boom. Since flat fan nozzles produce a tapered pattern (i.e. the volume is highest in the centre and diminishes towards the edges), approximately 100% overlap (i.e. 50% from each neighbour) will produce a uniform swath.

    Figure 1: Tapered flat fans that require some overlap are the default pattern type for agricultural boom nozzles. This is true of conventional and low-drift styles. Note that the flat fans are turned 15° to prevent the spray patterns from interfering with one another.

    The 100% overlap isn’t just for volumetric distribution. Flat fan spray patterns tend to have more and finer droplets in the centre and fewer and coarser droplets at the edges. All droplet sizes contribute to coverage in different ways, so the overlap ensures both number and sizes are evenly distributed along the entire boom.
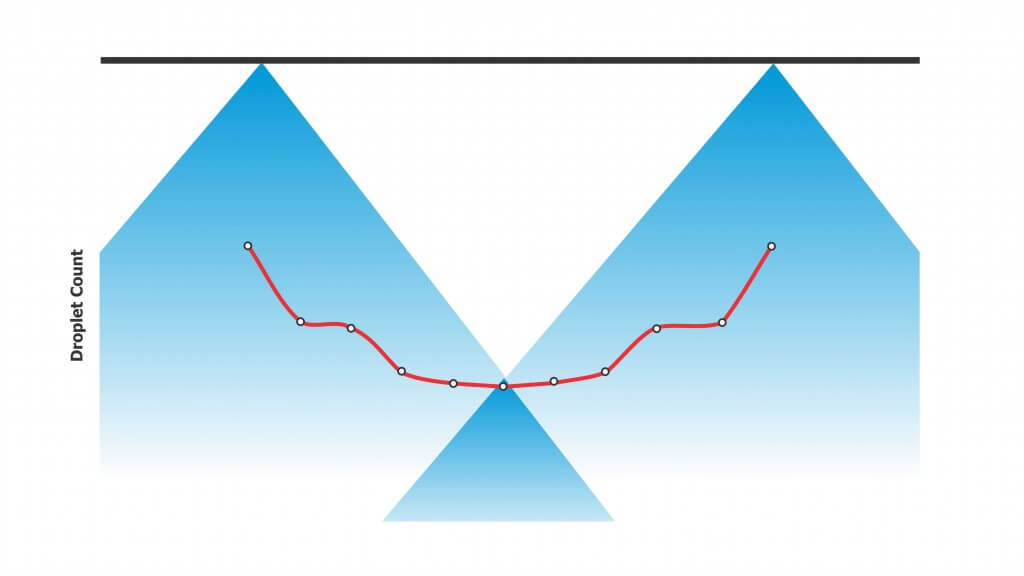
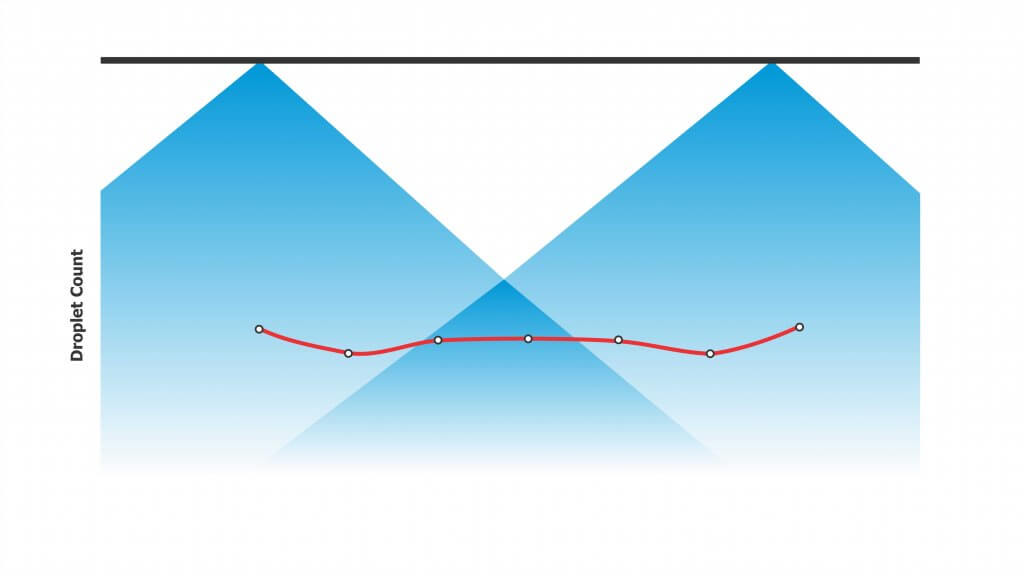
    Figure 2: 30% overlap may achieve volumetric uniformity. But because the centre of the pattern contains the majority of the smaller droplets, low overlap may result in low coverage in the overlap regions, resulting in striping.
    Figure 3: Consistent droplet number distribution along the boom requires at minimum 100% overlap (50% from each neighbouring nozzle). This blends those regions of the patterns with high and low droplet densities.

    The generic 20” spacing arose from long-held conventions about boom height, fan angle, and travel speed. Specifically, this spacing required a boom height of 20” to obtain good overlap of the once-dominant 80° fan angle. Combined with 0.15 to 0.3 US gallon per minute (gpm) nozzles and travel speeds of 6 to 8 mph, operators were able to apply 5 to 15 US gallons per acre (gpa) volumes. Using nozzles with smaller flow rates would generally result in nozzle blockages.

    But what if we want to change any of those variables? How does this affect nozzle spacing? Figuring out the pros and cons of an alternate spacing requires a little math and some contingency management.

    Boom Height Math

    First the math. If the boom has 20” nozzle spacing and we need 100% overlap, the width of the spray pattern at target height must be two times the nozzle spacing, which is 40″. You must calculate the required fan angle and boom height to achieve this. Most nozzle catalogues have tables to help with this, or you can download a handy spreadsheet to calculate your own scenarios here.

    For today’s standard 110° fans, a minimum boom height of 14” is needed to achieve 100% overlap. For 15” spacing, the height is reduced to 11”. For 10” spacing, we drop to a mere 7”. However, consider that most modern suspended booms are not operated at heights less than 24” to allow for sway. At that height, there’s plenty of overlap to go around for 20″ nozzle spacing. For those booms that are able to operate at a consistent height, narrower spacings permit lower heights that will reduce drift potential significantly. Every time we halve boom height, we also halve drift potential.
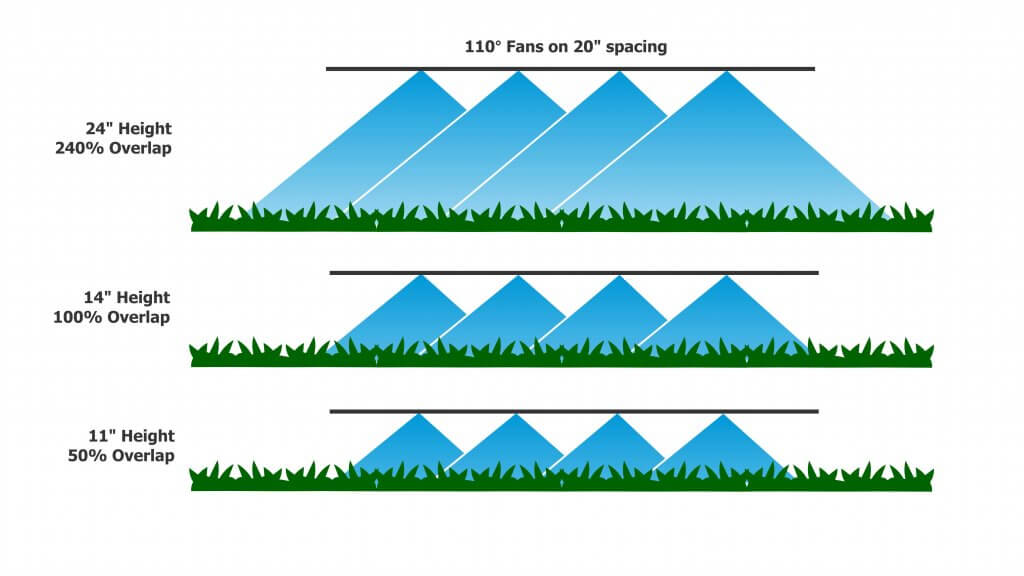
    Figure 4: Using 110° tips with 20″ spacing, the theoretical height at which we achieve 50% overlap is 11″ above target.

    By tilting the nozzles forward or backward from the vertical, we can reduce the boom height somewhat further and still get the same overlap. For example, for 20 and 15” spacings, angling nozzles forward or backwards by 30° allows us to drop the boom another 2” closer to the target.

    Contingencies

    A suspended boom hardly ever stays at a uniform height; It sways up and down with field conditions, topography, etc. This is why many operators set their booms above the minimum height – to prevent striping when the boom sways low. The penalty is that this increases the distance droplets need to travel, increasing drift potential and any turbulent displacement problems arising from the moving boom.

    Assuming a 110° flat fan at 24” boom height, each nozzle achieves a theoretical pattern width of about 70”, which is an overlap of 70÷20=3.4-fold or 240% on 20” nozzle spacing. Given a minimally-acceptable overlap of 50% (25% from each neighbouring nozzle), the boom could be as low as 11”. For 15” spacing, the minimum height for 50% overlap is 8”, and for 10” spacing it’s 5”. This means the narrower spray patterns gain 3” to 6” in allowed downward boom movement.
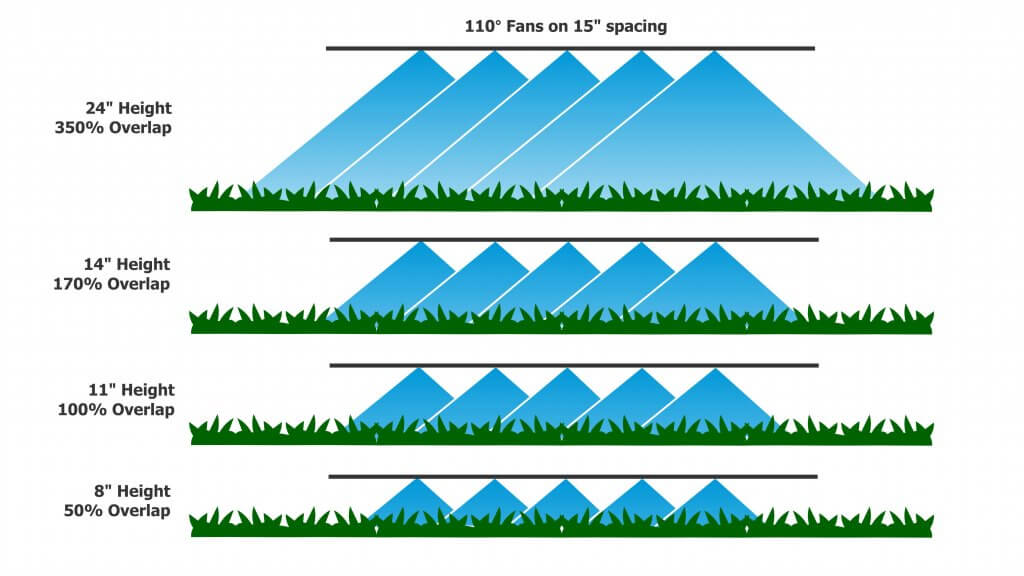
    Figure 5: Using 110° tips on 15″ spacing, the height for 50% overlap is 8″ above target.

    A second contingency is that spray patterns are rarely the exact value that the nozzle catalogues specify. A so-called 110° nozzle may operate at only 90°, or up to 150°, depending on the nozzle model, the spray pressure, and the tank mix. Learn more here and here. Patterns also don’t continue to grow at their rated fan angle, as droplets slow due to air-resistance and fall more vertically due to gravity. For that reason, a visual check is recommended to ensure the expected overlap is achieved.
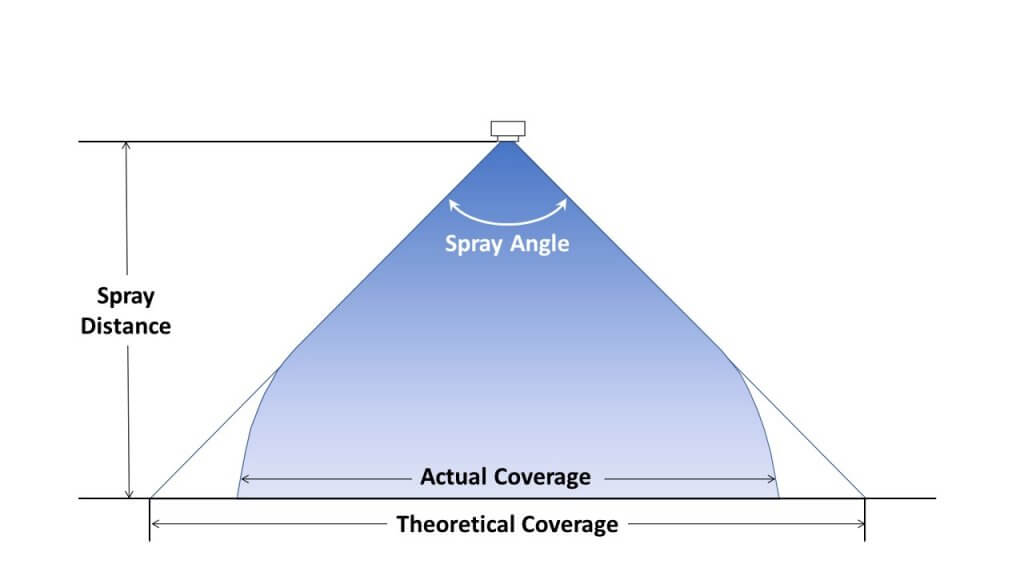
    Figure 6: Fan angles indicate initial trajectories of droplets at the edge. With distance, gravity pulls these droplets downward, narrowing the pattern width from that achieved theoretically (figure adapted from image in TeeJet catalogue).

    A third issue to consider is less related to boom height but nonetheless affects spray distribution. Small droplets move with air currents, and the turbulence created by large, fast sprayers creates enough turbulence to move these droplets significantly. A perfect pattern under static conditions can look quite different at a fast travel speed with a modest side wind. Low booms may help prevent some of this displacement because droplets spend less time in flight, and their average velocity is faster.
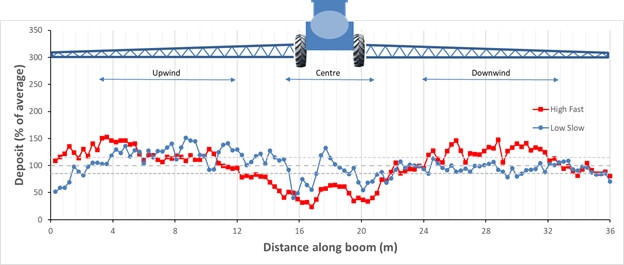
    Figure 7: Spray deposition onto a 2 mm string to measure deposit uniformity for a fast travel speed and high boom and a slow speed, low boom configuration.

    Flow Rate Math

    Flow rate requirements per nozzle change whenever we equip a boom at an alternate spacing. The basic formulae are shown below.
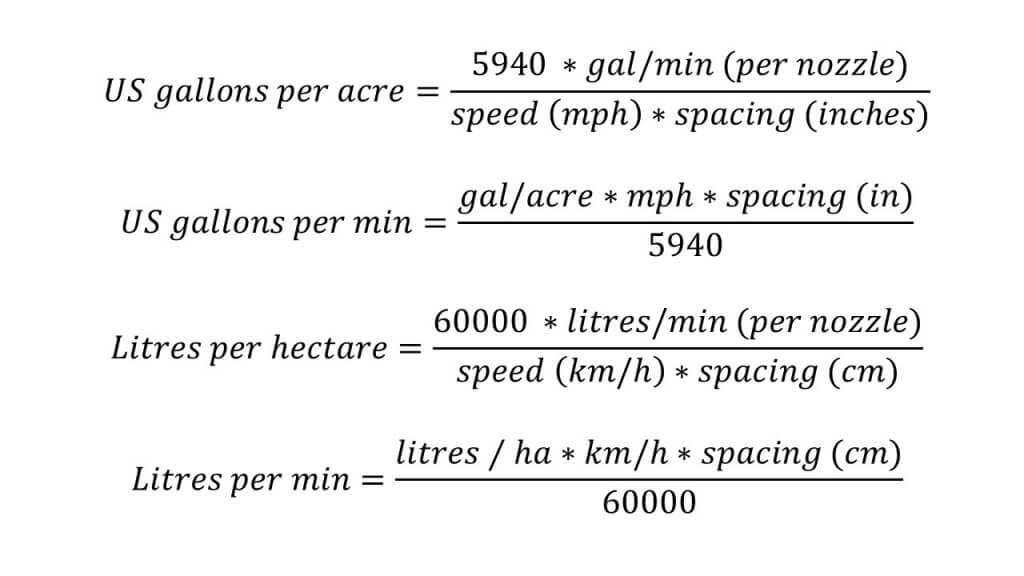
    Moving from a 20″ to a 15″ spacing would require a nozzle with 0.75 of the flow rate, approximately from a 02 to 015 size, or 03 to a 025 size, or 04 to 03 size, etc.

    Pulse Width Modulation

    The use of Pulse Width Modulation (PWM) has increased the overlap requirement. With PWM, alternate nozzles are on a 180° timing offset from their neighbours. This means that when running >50% duty cycle, when one nozzle is temporarily off, its neighbours are on. These neighbours’ patterns must now span the gap, and 100% overlap is the absolute minimum to achieve this. PWM users therefore select the wider pattern angles and some opt for >100% overlap.
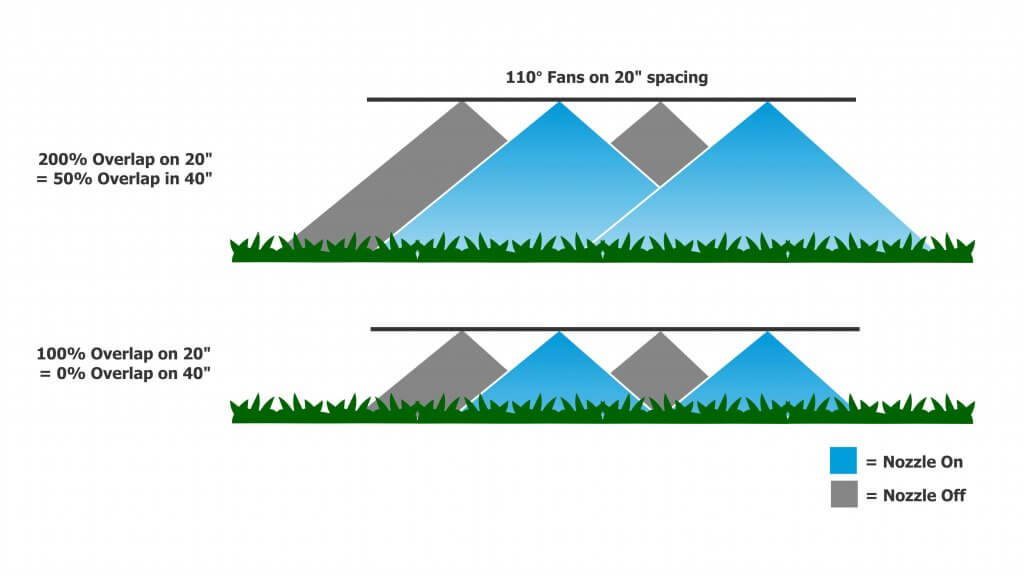
    Figure 8: Pulse Width Modulated booms require 200% overlap so that the entire boom receives proper coverage when the alternate set of nozzles is off. For 110° fans at 20″ spacing, the minimum boom height would be 21″

    PWM Considerations

    • High flows (greater than 1 US gpm at the nozzle) that are common for fertilizer top-dressing may require higher-flow PWM valves.
    • Narrow spacings reduce the individual nozzle flow rates and can therefore support higher application rates before triggering a larger valve requirement.
    • PWM valves aren’t cheap and for example 15″ spacing compared to 20″ spacing adds 24 valves on a 120′ boom.

    Banding

    We noted that 20” nozzle spacing is a standard because it corresponds to what has traditionally been achievable with available boom heights and spray pattern angles. But things can change.

    Narrower spacings such as 15” originate with row crops and planter row spacings of 15” or 30”. These spacings exist so the spray pattern can be placed either over the top of a crop row, or in between the rows for banding. Using narrower fan angles and/or lower boom heights, together with “even” (as opposed to “tapered”) fans, banding sprays can be applied over the top of, or between crop rows. Or drop hoses can reach between the rows for top-dressing or directed sprays into the canopy.

    Canopy Penetration

    With narrower spacing, it can be argued that a greater proportion of the boom length has spray directed directly downward (corresponding to the centre of the pattern). Whether or not this translates into better penetration of a canopy is a fair question. In laboratory trials, use of 10” or 20” spacing did not improve penetration into a broadleaf canopy. But if the lower boom height afforded by the narrower spacing was utilized, some improvements in the deposit of angled sprays onto vertical targets was observed.

    Adjusting to Narrower Spacings

    As we showed earlier, use of 15” or 10” spacing booms for broadcast sprays requires a smaller nozzle size to achieve the same spray volumes as the 20” spacing. If boom height remains constant, narrower spacings result in greater pattern overlap which provides more latitude for sway. Alternately, lower boom heights can be used.

    Using smaller nozzles on narrower spacing presents some challenges. Generally, smaller nozzle size means finer spray quality. If an operator wants to retain the spray quality they had on a 20″ spacing, they may opt to use lower pressure (not advisable for non-PWM systems) or swap to different nozzle design that can produce the desired spray quality at the lower flow rate.

    Smaller nozzles are more prone to plugging, so that needs to be managed with filtration, filling practices and water sourcing. Be aware of the the product formulations and their requirements for filter mesh size. Most dry products specify a 50 mesh filter (or coarser). Also, check size options for nozzles. The smallest size for most nozzle models is 015, but certain PWM-specific nozzles are only available in 03 or larger.

    The marriage of narrow spacings with individual nozzle shutoff can result in a versatile system capable of producing high resolution banded sprays in narrow seeded crops. For example, consider a boom with a 10” nozzle spacing spacing that matches the seeder row spacing. The operator can shift from 10” to 20” or 30” from the cab if the valve control software allows it. With accurate guidance and good boom levelling, topdressing foliar products (e.g. nutrients, fungicides) can follow the crop row precisely.

    Spot Sprays

    Spot sprays present a situation where compromises are needed. Some, such as WEEDit, utilize narrower nozzle spacings to allow better treatment resolution and increase product savings. Any one nozzle or sets of adjacent nozzles may be triggered by the sensor. For single nozzle activation, to preserve the value of the better resolution a uniform, narrow band of spray needs to be created. This means a 30° or 40° fan angle from a banding nozzle will be necessary. For example, a 24” boom height will result in a 13” band with a 30° fan, and an 18” band with a 40° fan. In the latter case, the dose would be diluted by 80%, wasting much of the potential savings.
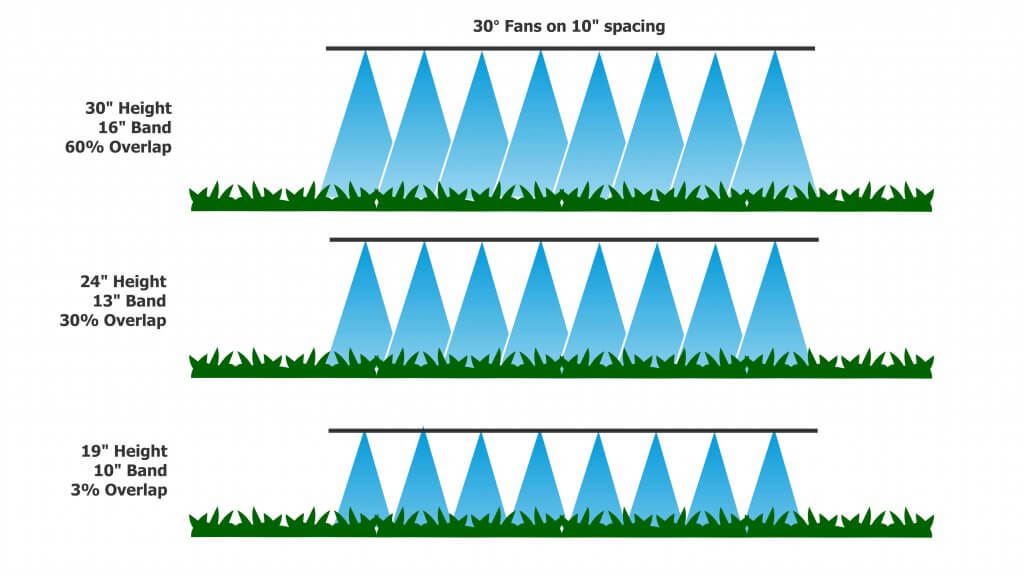
    Figure 10: Boom height is critical for banded sprays and for spot sprays. Too wide a pattern on a single nozzle reduces dose, too narrow creates misses.

    Frequently, a patch of weeds will trigger several adjacent nozzles. Now these individual bands need to work together to create a uniform swath. This will inevitably require some overlap to avoid gaps, but too much overlap will result in bands where twice the dose will be applied. A tapered fan may suit this situation better. As a result of these varying needs, tolerances for spot spray boom height are even more strict than for broadcast spraying. More thoughts on spot spray nozzle selection are here.

    Conclusions

    Narrower nozzle spacings on a broadcast boom allow somewhat lower boom heights and these can in turn reduce drift and improve deposition of sprays. Lower flow nozzles will be needed with narrower spacings, requiring management of plugging and potentially a more drift-prone spray quality. The value of narrower spacings depends on the availability of booms that control sway, allowing them to operate at uniform, low heights.
  • Assessing Water Sensitive Paper – Part 3

    Assessing Water Sensitive Paper – Part 3

    This is the final part of our three-part article discussing methods for digitizing and processing water sensitive paper. You can read part one here and part two here.

    Morphological operations

    We can now move on to the larger shapes, or “morphology” of the objects in our binary image. Our goal is to quantify deposits by interpreting these shapes. Once again, these operations are powerful processing tools, but we must acknowledge three overriding limitations:

    1. Inconsistent stains

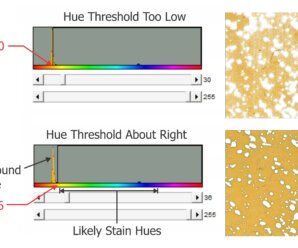
    Sometimes deposits do not create a consistent blue colour – they can get lighter or take on a greenish-yellow hue towards the perimeter of the stain. During thresholding, the outer edge can be accidently eroded, leaving behind an object with a jagged edge. This may lead us to underestimate the percent area actually covered. In the case of tiny stains, it might eliminate them entirely and lead us to underestimate deposit density.

    2. Overlaps

    It can be difficult to determine if an object represents a stain from a single droplet or is the result of multiple, overlapping deposits. This becomes significant when the surface of the WSP exceeds ~20% total coverage. The resulting objects may or may not have hollow centres where droplets do not overlap entirely. Misidentifying overlaps leads us to falsely conclude that an object is the result of a single, coarser droplet rather than multiple finer droplets.

    3. Ellipses

    Non-circular stains are formed when droplets scuff along the surface. Two droplets with the same volume encountering a paper at different angles can create stains with significantly different areas. We may wrongly conclude that the droplets that created them were coarser than they truly were. One approach is to use Feret’s Diameter (aka Caliper Diameter) by measuring the widest spans on the X and Y axes and taking the average. Another approach is to interpret the ellipse as a series of circular stains. Or we can decide to only acknowledge these objects when calculating percent area covered, but omit them when calculating deposit density or predicting original droplet size. Each strategy is a compromise, so it is important to be consistent and transparent when reporting results.

    Three common problems when analysing water sensitive paper.

    We’ll explore two morphological operations that can help us separate fact from fiction: Granulometry and Dilation-and-Erosion. We’re introducing these operations as part of the processing and detection step, but they may also overlap with the measurement step in our three-step process.

    Granulometry

    We can estimate the range of object sizes and get a sense of how they are distributed on the paper by filtering or “sieving” the image. Imagine pouring a mixture of sand and rocks through a series of ever-finer sieves. Doing so allows you to separate particles based on size exclusion. A granulometry function compares each object to a series of standardized objects with decreasing diameters. This isolates objects of a similar size and bins them in that size range. This is a powerful operation, but accuracy is lost when stains overlap to form larger objects. In this case, we move on to Dilation and Erosion.

    Dilation and Erosion

    Think of dilation as adding pixels to the boundary of an object. This makes tiny objects bigger, fills in any interior holes and can cause objects to merge. The number of pixel-wide dilations required to make objects contact one another can be used as a measure of deposit density.

    Erosion removes pixels from the outer (and sometimes inner) boundaries of an object. This eliminates tiny artifacts that may not actually represent stains. It can also split non-circular objects into multiple parts before shrinking them into multiple nuclei (aka centroids). These last-remaining points are not necessarily the centre of a stain, but the pixels furthest away from the original boundary.

    When a non-circular shape has more than one nucleus, they likely represent individual droplets that combined to form the larger stain. We can then use these nuclei to measure deposit density, such as in a Voronoi partition which triangulates each nucleus in relation to the two closest neighbours.

    Many image processers use both these operations sequentially. When an image is eroded and then dilated (a process called “Opening”), smaller objects are removed, leaving the area and shape of remaining objects relatively intact. Dilating and then eroding (a process called “Closing”) fills in small holes and merges smaller objects, once again leaving the area and shape of remaining objects relatively intact. We can use both of these functions to help smooth an image prior to measurement.

    (Top) Opening operations erode and then dilate the image. Moving left to right, the smaller objects tend to disappear. (Bottom) Closing operations dilate and then erode the image. Moving left to right, smaller objects either disappear or merge and holes are filled in

    Distance Transformations

    Distance transformations are advanced operations specifically used to separate objects that are densely packed. While not typically used when analyzing WSP, distance transformations are another means of identifying object nuclei. They are another means for teasing apart objects that are likely the result of overlapping deposits and then mapping their relative sizes and positions.

    Measurement

    The calculation of the area covered by deposits is straightforward. The pixels belonging to objects (the deposits) and those belonging to background are summed and then the fraction is converted to percent area covered. Research has shown that the image resolution does not significantly impact percent coverage assessments and has suggested that all image analysis software tends to produce similar results (+/- 3.5% observed when the same threshold was applied to multiple papers). This is acceptable because it’s within the variability inherent to spraying.

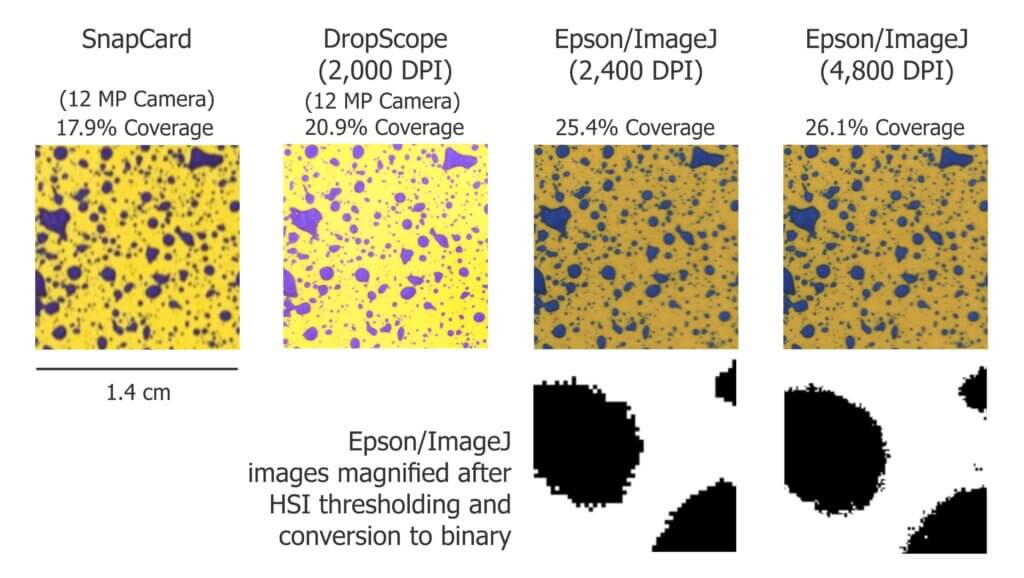
    We ran a similar experiment wherein we analyzed the same piece of WSP using four methods. Here are a few facts about the software we used:

    • DropScope produces images between 2,100 and 2,300 DPI. Currently, it ignores ellipses and doesn’t count anything spanning less than ~35 µm (3 pixels).
    • We set ImageJ to ignore any object spanning less than 3 pixels, which at 2,400 DPI was 30 µm in diameter.
    • Snapcard was a free app created by Australia’s GRDC. It was benchmarked using ImageJ, tended to underestimate coverage and was fairly inconsistent. Nevertheless, it was convenient for field work. Instances may still exist, but as of 2025 it no longer available through the GRDC.

    The images shown in the figure below were cropped from screenshots produced by each method. The actual ROI analyzed was ~3 cm2 for SnapCard, 3.68 cm2 for DropScope and 2.0 cm2 for both Epson/ImageJ methods. Our results indicate an +/- 4% difference in percent area coverage. This variability reflects the results of a 2016 journal article that compared SnapCard with ImageJ and other leading analytical software. That study claimed no statistically significant difference in percent coverage detected (standard deviations were about 20%). However, the ImageJ results tended to trend several percent higher than SnapCard. We saw this as well. And so, while resolution may not have a significant impact on percent area covered, there does appear to be some correlation.

    Percent area covered as reported by three image analysis systems. Only a minor difference was observed when resolution was doubled using the Epson/ImageJ method.

    Resolution definitely affects deposit counts. Particularly in applications that employ finer droplets. Consider the difference between detecting or missing 1,000 30 µm diameter objects. It may only amount to a fraction of a percentage of the surface covered, but +/- 1,000 objects on a 2 cm2 area is significant in terms of deposit density.

    Output

    Once a WSP image (or set of images) has been scanned, pre-processed, processed and measured, we will receive some manner of output. Some software packages create an attractive report with images, graphs and key values. These reports include percent coverage and many provide droplet density. Deposits may be binned by size, or spread factors are used to calculate the original droplet diameters and even estimate the volume applied by area. Other software packages provide raw data that can be imported into a statistical program or spreadsheet program like Excel for further analysis. Some software packages provide both.

    How far can we take this?

    Blow-by-blow data analysis is beyond the scope of this document, but how much weight should we give to coverage data obtained using WSP? The answer depends on the metric in question, but in all cases we must first acknowledge the three overriding caveats. Take it as said that they apply to everything that follows:

    1. Different brands (and even different production runs) of WSP can produce significantly different coverage metrics. When conducting experiments, use a single brand of WSP. Better still, use papers from the same production batch whenever possible.
    2. The same of piece of sprayed WSP can produce significantly different results depending on the software and protocol used to analyze it. When conducting experiments, use the same software and assessment protocol and be transparent about the process when communicating results.
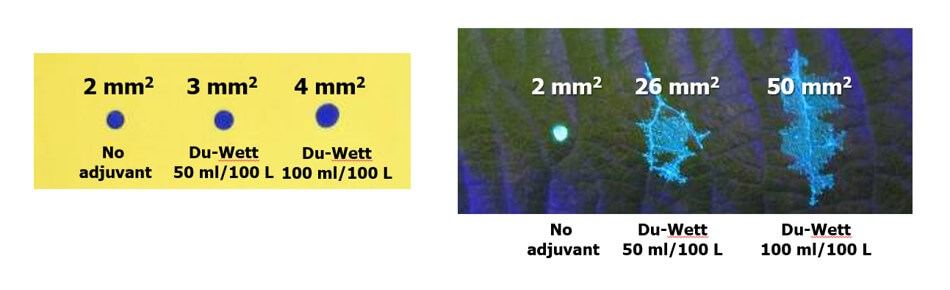
    3. WSP coverage may not reflect the coverage achieved on an actual plant tissue surface. It is suitable as a relative index (I.e. papers can be compared to papers, but not to tissues) but the spread factor changes with surface wettability and the surface tension of the liquid sprayed. Note the differences in percent area covered in the following experiment with an organosilicone super-spreader:
    Difference in deposit spread on water sensitive paper versus a leaf surface using an organosilicone super-spreader and UV dye. The same volume was applied in each case and while the area increased two-fold on WSP it increased ~10-fold on an actual leaf. Image reproduced from work by Robyn Gaskin, Plant Protection Products, New Zealand.

    Recall that we started this document by listing the four pieces of information commonly sought using WSP. They were listed in order of reliability, and now we can explain why.

    • The percent surface area covered: We have established that this is the most reliable piece of data. Droplets do not spread on WSP the way they do on plant surfaces, so it will underestimate actual coverage. The results vary by analytical method, but it’s likely not dependent on resolution and still falls within the variability inherent to spraying. This metric gives us valuable and actionable information. We can say whether or not we hit a target, and evaluate whether a sprayer change resulted in more or less deposit.
    • The density of deposits on the target area: We have established that that there are limits to the reliability of this metric. It is affected by the analytical method used and can be greatly underestimated when resolution is poor or when deposits overlap in high numbers. Also, it will never reliably reflect deposits under 30 µm. Nevertheless, under controlled conditions this information does have value and is of great interest in enquiries about drift and contact fungicides.
    • The size of the droplets that left the stains: This metric is highly questionable except under controlled conditions. The many assumptions about surface tension, droplet speed, and droplet evaporation make it impossible to make definitive statements about spray quality. Finer droplets are greatly underestimated in this equation. Therefore, while there may be some value in using WSP as a relative index, this metric is a crude indication at best.
    • The dose applied to the target surface: This metric has not been discussed up to this point, but is quickly and easily dismissed. Let’s assume that a droplet with a high concentration of an active ingredient will leave a stain that is the same area as another droplet with a lower concentration. This will lead some to suggest that as long as the original concentration is known, we can back-calculate the dose (which is the amount of active on a given area). However, one droplet has the same volume as eight droplets that are half it’s diameter. This cubic relationship means that if they all deposit, the larger droplet will cover roughly 1/2 the surface area as the eight smaller droplets. Therefore, the smaller droplets spread the same amount of active over a greater area. Spread factor muddies this a bit, but ultimately it means that dose cannot be estimated from area covered. Dose is better assessed using collectors that permit the residue to be removed, such as Petri dishes, Mylar sheets, pipe cleaners, alpha cellulose cards, or glass slides.

    And so, the image analysis process described here is powerful and effective when used with water sensitive paper as long as the limitations are acknowledged. The same process can also be used with dyes and specialized collectors such as Kromekote to permit even greater resolution. But that’s another story.

    2026

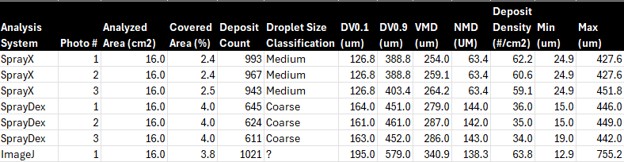
    A new Brazilian cellphone-based system (SprayDex) emerged in 2026 that offers possibilities. Preliminary testing alongside other methods indicate it is consistent within itself, but as we saw in previous testing, the same WSP scanned using different systems will create different results. This is why, ultimately, WSP is a relative index and should only be compared within a given system; coverage cannot be reliably compared across WSP brands, or between digitization methods.

    2026 Comparison of three digitization / analysis methods. Same WSP was scanned each time.

    References (Further reading)

    Bankhead, P. 2014. Analyzing fluorescence microscopy images with ImageJ.

    Cunha, J.P.A.R., Farnese, A.C., Olivet, J.J. 2013. Computer programs for analysis of droplets sprayed on water sensitive papers. Planta Daninha, Viçosa-MG. 31(3): 715-720.

    Ferguson, J.C., Chechetto, R.G., O’Donnell, C.C., Fritz, B.K., Hoffmann, W.C., Coleman, C.E., Chauhan, B.S., Adkins, S.W. Kruger, G.R., Hewitt, A.J. 2016. Assessing a novel smartphone application – SnapCard, compared to five imaging systems to quantify droplet deposition on artificial collectors. Computers and Electronics in Agriculture. 128: 193-198.

    Ledebuhr, M. 2016. Small Drop Sprays.

    Marçal, A.R.S., Cunha, M. 2008. Image processing of artificial targets for automatic evaluation of spray targets. Trans. of the ASABE. 51(3): 811-821.

    Moor, A., Langenakens, J., Vereecke, E., Jaeken, P., Lootens, P., Vandecasteele, P. 2000. Image analysis of water sensitive paper as a tool for the evaluation of spray distribution of orchard sprayers. Aspects of Applied Biology. 57.

    Panneton, B. 2002. Image analysis of water‐sensitive cards for spray coverage experiments. Applied Eng. in Agric. 18(2): 179‐182.

    Salyani, M., Zhu, H., Sweeb, R.D., Pai, N. 2013. Assessment of spray distribution with water-sensitive paper. Agric. Eng. Int.: CIGR Journal. 15(2): 101-111.

    SnapCard website. University of Western Australia and the Department of Primary Industries and Regional Development, Western Australia. (Note: As of 2026, may no longer exist).

    Syngenta. 2002. Water‐sensitive paper for monitoring spray distributions. CH‐4002. Basle, Switzerland: Syngenta Crop Protection.

    Turner, C.R., Huntington, K.A. 1970. The use of a water sensitive dye for the detection and assessment of small spray droplets. J. Agric. Eng. Res. 15: 385-387.

  • Variable Rate Spraying

    Variable Rate Spraying

    Variable rate spray application is receiving a lot or attention with our increased ability to farm according to prescription maps.  For dry products such as seed or fertilizer, metering is relatively straight-forward and variable rate application has been possible for many years. However, liquid product application has been more complex and requires special approaches

    Hydraulic Pressure and Flow Rate

    In conventional liquid metering, the liquid is forced through a metering orifice that is placed in-line.  This could be an orifice plate for liquid fertilizer, or a flat fan nozzle for pesticides.  Rate control is achieved by altering the spray pressure. It is usually impractical to change the nozzle or metering orifice during an application.

    The main drawback to this approach is that spray pressure is not very effective at changing flow rates due to the square root relationship between spray pressure and flow rate.

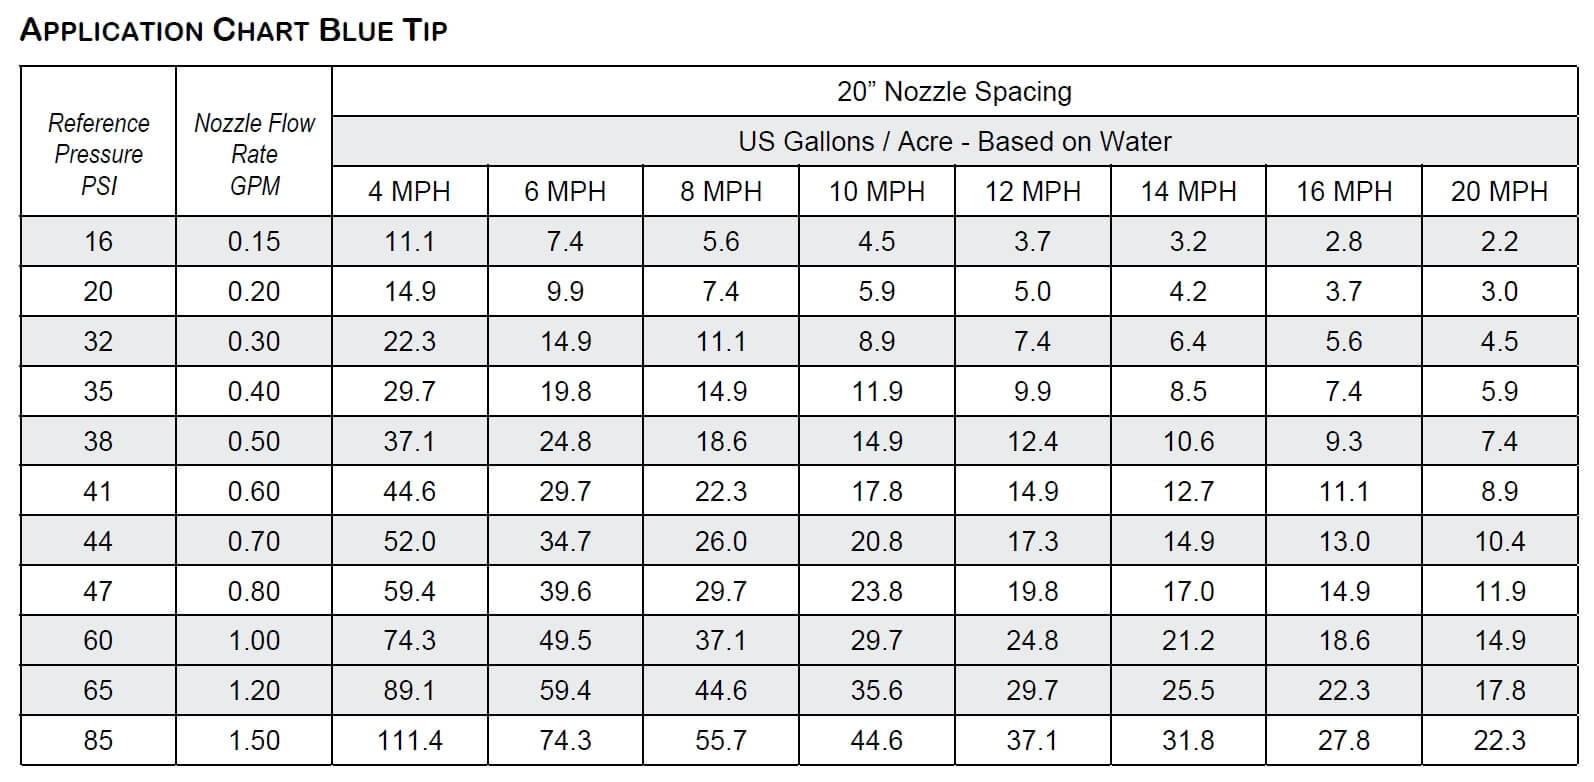
    For example, with reference to the table below, one can see that doubling the spray pressure (say, from 30 to 60 psi) only increases the flow rate by 40%. Tripling the pressure (from 30 to 90 psi) increases the application volume by 73% (we can call that a factor of 1.73). As a result, the use of pressure alone doesn’t offer a large range of application rates, and we accept a factor of 2 to be the limit for fertilizer streamer and broadcast nozzles (meaning a four-fold pressure range) and a factor of 1.73 to be practical for broadcast pesticide sprays over a 3-fold pressure range.  Any wider application volume range would require adjustment to travel speed.

    Application Chart 2015 cropped

    With these inherent limitations in flow rate capacities from hydraulic pressure alone, applicators are often forced to use wide pressure fluctuations to achieve reasonable rate responses.  In some cases, this means that pressure needs can be too low for uniform distribution, or too high for pump or plumbing capacities.

    For Variable Rate application, we are less interested in travel speed range, and are more interested in flow rate range. The above chart can be used for both purposes. In the above example, rows under each application volume identify the travel speed range. These headings can be flipped, so the 10 gpa column (with mph values in it) can also be a 10 mph column (with gpa in it). the numbers don’t change. same is true for metric units, except the convenience of being in the same magnitude that makes the flip easy in US units is absent.

    There are a few options available that expand the flow rate range of liquid products.  A brief overview of the main options follows:

    Greenleaf / Agrotop

    TurboDrop Variable Rate (TDVR): This nozzle appears like the traditional TurboDrop family, but has an innovative dual orifice in its venturi. The first stage is always open, but the second orifice is held closed under spring pressure until a certain threshold is reached. This design achieves a 3-fold flow rate range between 40 and 140 psi. Below the 40 psi threshold, the spray pattern fan angle deteriorates quickly.

    TurboDrop VR tip provides about 3-fold flow rate range at any given speed, but requires higher pressures.

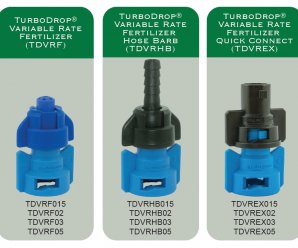
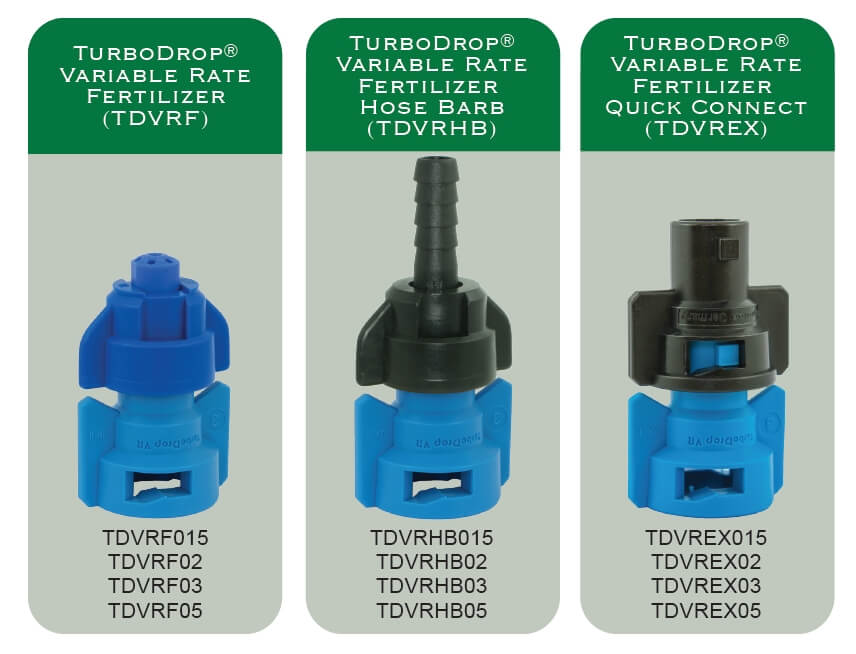
    TurboDrop Variable Rate Fertilizer (TDVFR): Because fertilizer streams do not need to atomize the spray or form a fan, the minimum pressure can be reduced, in this case to 10 psi. From 10 to 140 psi, this design offers a four- to five-fold range of flow rates. Three exits are offered, a streamer, a hose barb, and a quick connect.

    Three variants of the variable rate fertilizer orifice are offered by Greenleaf.

    VariTarget Nozzle

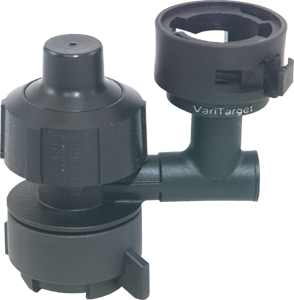
    This nozzle design uses a spring-loaded plunger to exert force on a flexible nozzle cap, deflecting it slightly.  The deflection changes the orifice size, allowing for a change in flow.  As a result, the flow rate response to a pressure change is increased dramatically. A single VariTarget nozzle equipped with a blue or green nozzle cap can deliver flows ranging from 0.2 US gpm at 20 psi to 1.2 gpm at 65 psi, for a stunning 6-fold change in application rate (link).

    VariTarget
    The VariTarget nozzle body

    The main drawback of this nozzle is the poor metering accuracy of the system. In calibration tests, flows from various new VariTarget nozzles operated at the same pressures varied by more than 10%.  While this amount of variability may be acceptable in liquid fertilizer application, it is not considered acceptable for pesticide application. Tightening or loosening the threaded spring cap even a little changes the flow.

    VariTarget Flow Chart

    TeeJet Variable Rate Fertilizer Assemblies

    These metering assemblies, introduced in 2016, offer an elastomer (EPDM) metering plate whose orifice diameter expands with pressure, offering a wider range of flows.  There are no moving parts in the assembly.  Four models are available (link).

    IMG_20160112_112250662

    PTC-VR:  Using a push-to-connect design for planters and toolbars, it offers versions that accomodate 1/4″, 5/16”, and 3/8” OD tubing diameters

    QJ-VR Hose Barb:  This unit offers hose barb diameters for 1/4″ and 3/8” ID hose.

    Both units feature a pressure range of 10 psi to 100 psi, within which a flow rate range of approximately 8-fold is possible.

    SJ3-VR: This unit generates three streams and operates over a pressure range of 20 to 100 psi, offering a flow rate range of about 3-fold.

    GPA ranges for specific travel speeds for TeeJet SJ3 VR

    SJ7-VR: Generating seven streams and operating over a pressure range of 30 to 80 psi, this unit allows a flow rate range of about 2.9.

    In all cases, the realized flow rate range is significantly greater than would have been achieved with pressure change alone. TeeJet has tested the flow rate variance among units operating at the same pressure and has found them to be acceptable, according to company representatives.

    Fertilizer banding has greater tolerances for application because pattern width is less important, and also because stream stability is less affected by pressure than spray pattern droplet size.

    Pulse Width Modulation (PWM)

    PWM utilizes conventional plumbing:  a single boom line and a single nozzle at each location.  Liquid flow rate through each nozzle is managed via an intermittent, brief shutoff of the nozzle flow activated by an electric solenoid that replaces the spring-loaded check valve.  Typical systems pulse at 10 or 15 Hz (the solenoid shuts off the nozzle 10 or 15 times per second), and the duration of the nozzle in the “on” position is called the duty cycle (DC) or pulse width.

    100% DC means the nozzle is fully on, and 20% DC means the solenoid is open only 20% of the time, resulting in the nozzle flowing at approximately 20% of its capacity. This is illustrated in the figure below.  The ability to control the duty cycle is referred to as pulse width modulation.

    PWM Schematic

    The system has a theoretical flow rate range of about four- to five-fold. Within this range, spray pressure, and the corresponding spray pattern and droplet size, stay roughly constant.  This makes it ideal for variable rate pesticide application, where spray patterns and spray quality are critical for performance.

    The main disadvantage of this system, compared to the variable orifice designs, is cost. Although highly accurate and dependable, commercial sprayer units are priced between $15,000 and $65,000 per sprayer, depending on features and boom widths. The available systems are Capstan PinPoint II and EVO (as a retrofit to any sprayer), Raven Hawkeye (retrofit to any sprayer, available as factory option on Case (AIM Command), New Holland (IntelliSpray) and most other brands, John Deere ExactApply, WEEDit Quadro, Agrifac StrictSprayPlus and TeeJet DynaJet (available as retrofit). See our in-depth article on PWM for more information on these systems.

    For ammonia and liquid fertilizer planters or toolbars, Capstan offers three different PWM products, N-Ject NH3, N-Ject LF or EVO LF. These systems offer more control over PWM pulse frequency and duty cycle and can achieve 8-fold rate ranges. 

    Flow rate ranges for Capstan N-Ject LF, on 30″ spacing

    At low frequencies and duty cycles, the mobiliy of the fertilizer in soil needs to be considered, as significant gaps in a stream can be generated.

    A variable rate for liquid fertilizer system for seeders, together with sectional control and turn compensation, is offered by Capstan EVO-LF. This system can generate 10 to 60 gpa at 4.5 mph on 12″ spacing.

    Dual Boom Systems

    A second boom fitted with different flow nozzles is installed, and is activated when the flow rate requirements can no longer be met with a single set of nozzles.  Once the second boom is activated, the spray pressure drops significantly and additional flow capacity can be realized.

    Dual boom system

    Dual or Quadruple Nozzle Bodies

    A similar approach to the dual boom is available as selectable nozzles in the same body from Arag (Seletron), Hypro (Duo React), John Deere (ExactApply) Amazone (AmaSelect), and others. These systems utilize a single boom and direct the flow through one of any two (Duo React, ExactApply, Seletron) or four (Seletron, others) nozzles, or several nozzles at the same time. 

    AmaSelect utilizes a unique switching system that allows the user to select only Nozzle 4, Nozzle 3, Nozzles 3 & 4, and Nozzles 2 & 4, making the placement of certain sized nozzles critical.

    Amazone AmaSelect nozzle switching system

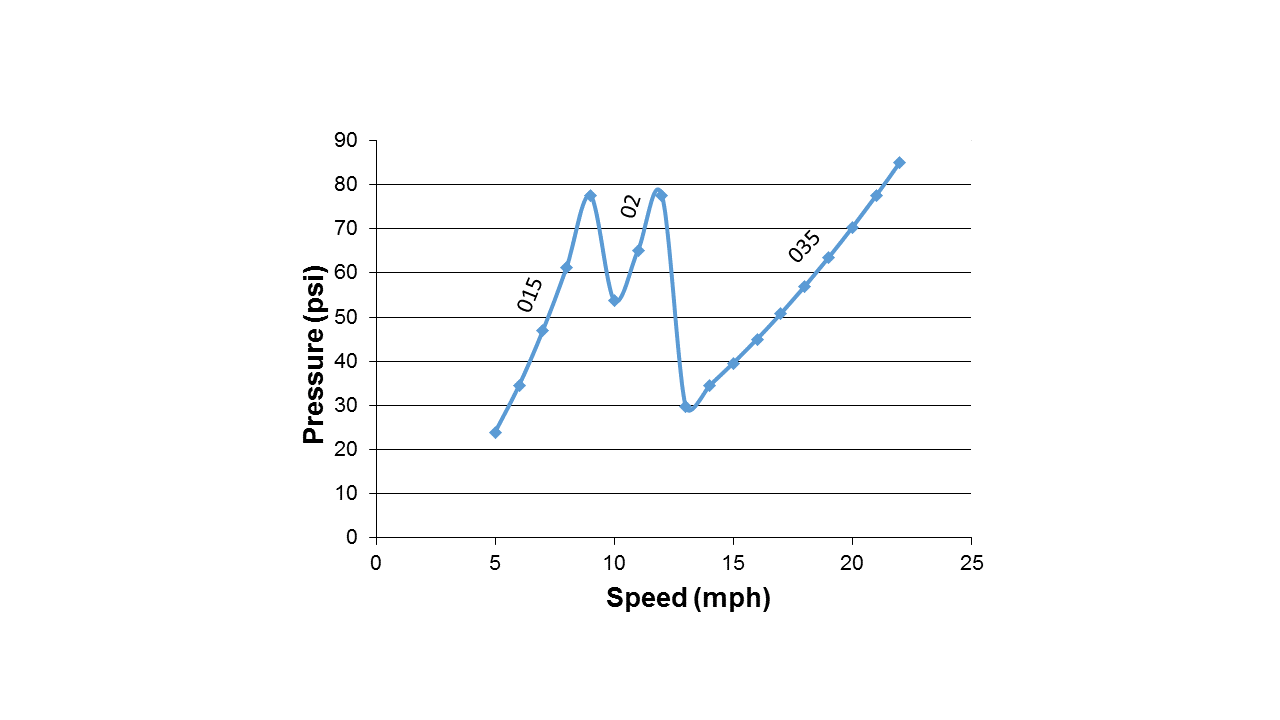
    Similar pressure fluctuations as with a dual boom would be experienced, requiring careful selection of nozzle flow rates to avoid large pressure jumps. The system can also be used to manually change from one nozzle to another as needed. In the figure below, the pressure changes associated with the sequential use of 015, 02, and 035 flows are shown.

    Duo React

    Direct Injection

    Direct injection is an option for variable application of pesticides.  In this system, undiluted pesticide is placed into canisters on the sprayer, and plain water (or water plus adjuvant) is in the sprayer tank. The chemical is metered and introduced into the water on the pressure side at some distance upstream from the boom sections. The pesticide rate can be varied with the speed of the direct injection pump, offering a very high dynamic range of possible rates. For example, Raven’s Sidekick Pro (available as factory option on Case and John Deere sprayers, or as a retrofit to any sprayer) offers a 40-fold range of flow rates.

    20140123_145619

    After injection, an in-line mixer ensures that products are evenly distributed in the carrier.  The amount of lag in the systems will depend on the amount of spray mixture in the plumbing upstream of the nozzles, the total boom flow rate, as well as the boom section configuration.  With a variable rate map this lag can can be anticipated and accommodated.

    Pump technology has improved the metering accuracy over a range of viscosities. However, dry formulations remain a challenge as slurries can settle and create problems for the pump and screen components.

    Summary

    High dynamic flow rate ranges for agricultural sprays are challenging to achieve, but will become more important as interest in site-specific management increases.  Relatively inexpensive solutions are available for liquid fertilizer, whereas pesticide sprays require greater investments in technology to preserve spray pattern integrity. As mapping sophistication continues to grow, these application technologies will be integral to variable input prescriptions.

  • Compulsory, Standardized Sprayer Inspections

    Compulsory, Standardized Sprayer Inspections

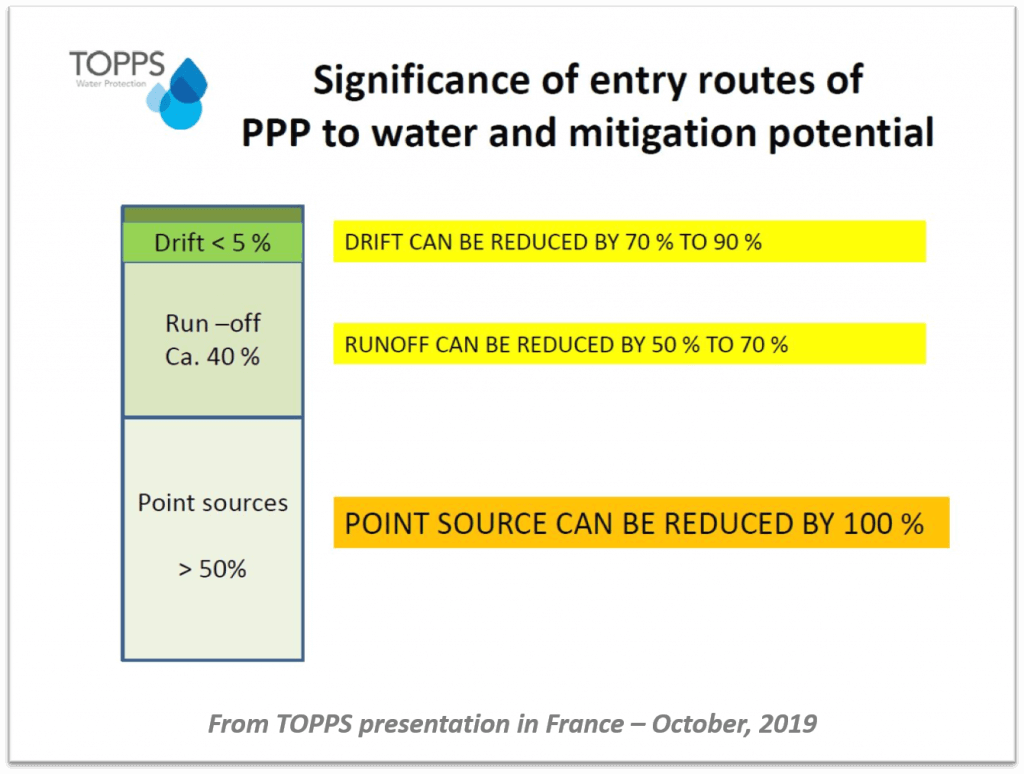
    Spring always brings renewed interest in sprayer calibration. This is good, because a well-maintained and calibrated sprayer will protect crops more effectively and efficiently, as well as reduce the potential for off-target drift and point source contamination.

    Presently, there is no nationally-recognized standard for sprayer calibration in either Canada or the United States. As a result there are many methods, some more stringent than others, spanning activities relating to seasonal maintenance through to precise diagnostic measurements. This means an operator can be in compliance with programs such as CanadaGAP (a food safety traceability standard for fruit and vegetables), and yet only perform the most rudimentary adjustments.

    I was first made aware of “compulsory inspections” in 2009 when I started noticing certification stickers on certain European import airblast sprayers. Some Ontario tender fruit and grape growers familiar with the European standards asked why we didn’t enforce standardized calibration program as they do in Europe. I was surprised to hear a farmer ask for more paperwork, so it made me wonder, are Canada and the US overdue for a change?

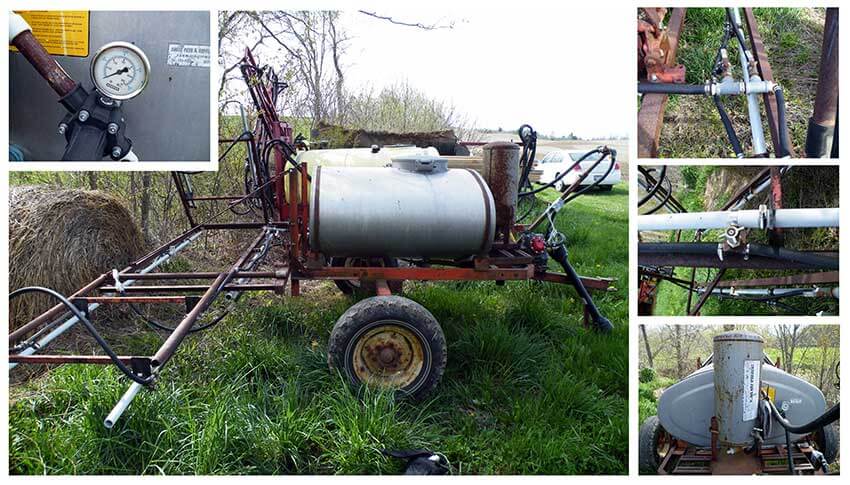
    All sprayers, from large, commercial field and airblast sprayers, to the more humble home-grown sprayers (see below) benefit from regular servicing and calibration. And yet, sprayer calibration in Canada and the US remains largely voluntary and highly variable depending on the size of the operation, sprayer design and the willingness/skill of the operator.

    Canada and the US: Then

    In the mid 1980’s, University of Nebraska engineers and Successful Farming Magazine published a study showing that un-calibrated spray applications were costing US farmers ~$1,000,000,000 per year. The article was infamously called “The Billion Dollar Blunder”. You can download the original journal article describing the survey here.  It was estimated that fewer than 5% of applications were within 5% of the desired rates. Spray overlaps and poor calibration resulted in over-applications of more than 20%.

    At the time it was eye-opening and received a lot of attention. In 2006 the original study was revisited (see here), and even with advances in precision application, there was a disappointing lack of improvement. Bill Casady, University of Missouri Extension agricultural engineer, estimated that if 20 minutes of calibration can save 5% on 500 acres in an application sprayed at $25/ac ($61.75/ha), then the 20 minutes of effort worked out to $1,875 / hour. Now that’s a solid return on investment!

    Belgium: Then

    Belgium recognized and addressed this issue more than twenty years ago. In 1995, following the lead of the Netherlands and Germany, Belgium’s Ministry of Agriculture mandated that all spraying equipment (save backpacks) be inspected every three years. At the time, other countries such as Sweden, Hungary and Austria had similar, albeit voluntary, programs.

    Belgian farmers received letters asking them to make their sprayers available for testing by a Ministry-appointed institution, in locations no more than 10 kilometers from their operations. The institution’s trained technicians would subject the sprayers to a regimented, standardized inspection. When the equipment met the standard, they would receive a permit in the form of a sticker (see below) attached to the sprayer. The growers paid for this service, based in part on the size of the sprayer.

    In order to introduce the process to the Belgian farmer, a short documentary was produced. If you would rather not watch the preamble explaining why the prudent use of chemistry is critical to agriculture, and get right to the sprayer inspection process, skip ahead to 3:35.

    What follows is a brief outline of that 1995 process, which I’m told is similar to the process currently used in Belgium:

    1. Administrators perform visual checks to assess the general condition of the sprayer (e.g. obvious maintenance, safety and operational issues).
    2. Boom balance (where applicable), hinges, boom ends and boom sturdiness is checked.
    3. Nozzle spacing and orientation of nozzle bodies is inspected.
    4. All points of filtration are inspected.
    5. For boom sprayers, a spray pattern distribution used to be performed, but it wasn’t diagnostic enough. Instead, a pressure gauge / nozzle combo is used in each position to check for pressure fluctuation, and to ensure each tip had a flow rate within 5% of the average and no more than 10% deviation from the manufacturer’s rate.
    6. For airblast sprayers, the overall output of the sprayer is measured to determine nozzle wear using individual collectors clamped onto each position.
    7. For sprayers with rate controllers, calibrated collection bags are attached to a few nozzles and the sprayer drives a 100 metre course while spraying. The actual output is compared to the expected.
    8. Finally, the farmer receives a report outlining issues that need to be remedied before the sprayer is certified.

    SPISE: Today

    Today, collaborating European countries are members of SPISE – Standardized Procedure for the Inspection of Sprayers in Europe. Established in 2004 by founding members from Belgium, France, Germany, Italy and the Netherlands, the SPISE Working Group aims to “further the harmonization and mutual acceptance of equipment inspections”. They also work to continually improve the inspection / calibration process.

    Their website hosts a number of sprayer-related resources, but the SPICE Advice handbooks are perhaps most valuable to the sprayer operator. Click either image below to download them as PDF for airblast or field sprayers:

    This more current video by AAMS-Salvarani goes though the inspection and adjustment process for airblast sprayers. While there is no mention of air speed adjustments, many of the steps in this video correspond with the airblast adjustments relating to Crop-Adapted Spraying which has proven very successful in Canada.

    Canada and the US: Tomorrow

    Regular, third-party mediated inspections offer many potential benefits to the average operator. But, in order to realize gains in crop protection and environmental stewardship, perhaps there are two programs required: One to certify the sprayer and the other to certify the sprayer operator.

    1. A sprayer inspection program would focus on sprayer maintenance rather than calibration. Maintenance occurs at regular intervals to ensure spray equipment is operating optimally. Calibration is an ongoing process intended to match the sprayer to the conditions in which it’s operating, and that requires an educated sprayer operator.
    2. Sprayer operator education programs such as Ontario’s Grower Pesticide Safety Course, or Penn State’s Pesticide Applicator Certification Course already exist, but they are not offered in every state or province, and they are often voluntary or perhaps specific to a particular expertise (e.g. not applying to custom applicators or airblast operators).

    They could start as voluntary, pay-for-service pilot programs to see if operators appreciate how much better their sprayers are functioning, and to quantify how much waste is been reduced. They wouldn’t necessarily have to be government-run; Industry or Academia may be better conduits. So, what would be required to develop and implement these two programs?

    • We would need to agree on a robust and generic sprayer inspection protocol. We have several European examples to draw on.
    • We would need to agree on the minimal content for a sprayer operator course. Again, we have many to draw on, with the obvious understanding that the core curriculum would be amended to reflect various state and provincial requirements.
    • We would need a trained, third-party organization to take responsibility for overseeing and implementing the two programs.
    • And, of course, we would need the funds to initiate both programs before they would eventually become self-sustaining.

    So, are we dreaming in Technicolor? If responses to this article are any indication, there are those in western society that lash out at the idea of mandatory requirements. But there are supporters, too. Maybe we can learn from those European countries that have been doing this for more than 20 years.

    Thanks to Jan Langenakens of aams for reviewing this article, and providing the videos.

  • Pressure Spikes and Relief Valves on Air-Assist Sprayers

    Pressure Spikes and Relief Valves on Air-Assist Sprayers

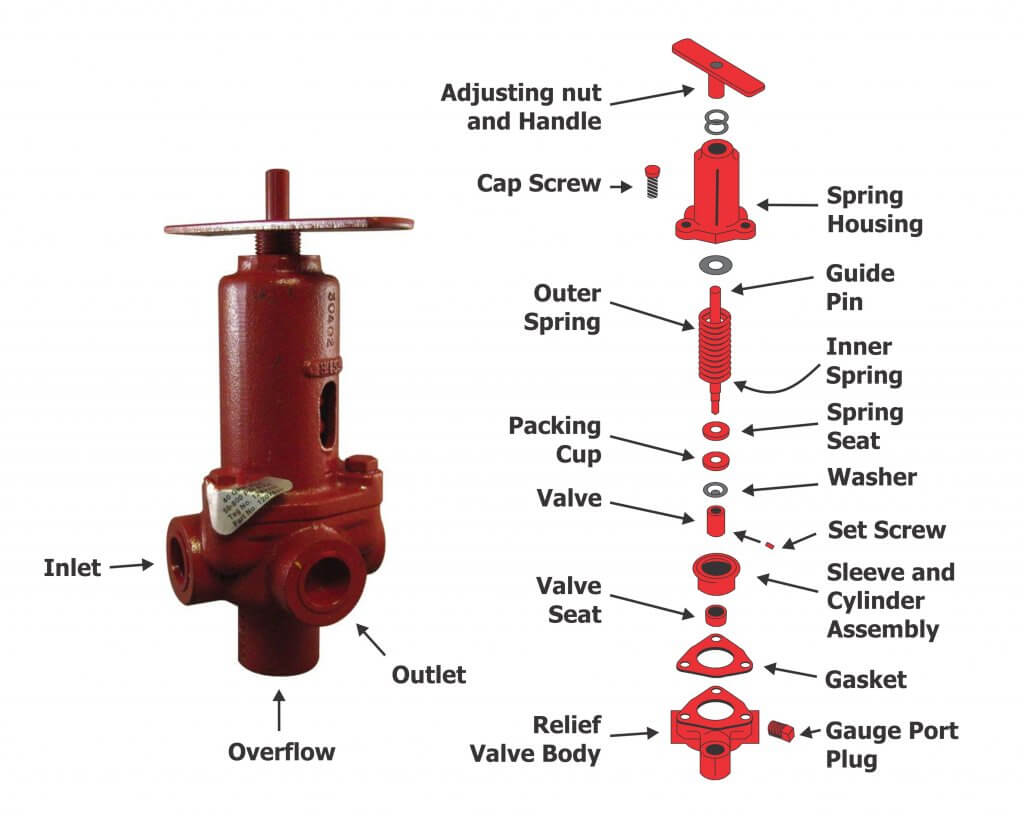
    A properly-sized pump should produce more flow than is needed and work in conjunction with the atomizers to regulate that flow. Typical to high pressure pumps, a piston relief valve (aka regulator) should maintain the desired system pressure through the normal speed range of the sprayer, regardless of the number of booms (or boom-sections) that are on or off. This is achieved by balancing the sprayer pressure against the relief valve spring, which must move freely across a range of flows.

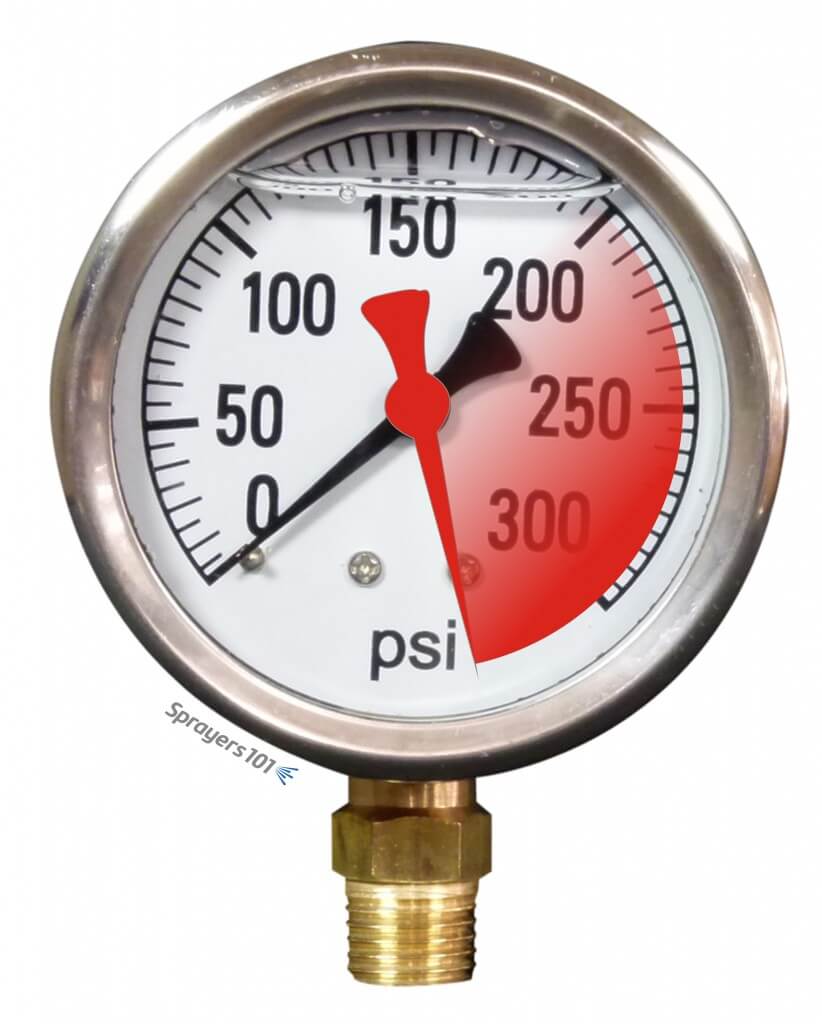
    But what does it mean when the pressure gauge briefly spikes off-scale when boom are turned on or off? This is bad for the gauge and will eventually cause it to fail. Quite often, pressure spikes are an indication of one of two things:

    • A dirty or stuck valve
    • An inappropriate spring size
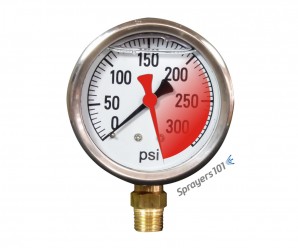
    A pressure gauge spiking beyond its range.
    A pressure gauge spiking beyond its range.

    Relief valve maintenance

    Sometimes, pressure spikes indicate a need for valve cleaning and maintenance.

    • The regulator spring cavity may be packed with dirt, which limits valve travel. Clean the housing and spring, and then lubricate and adjust.
    • The regulator may be partially seized or sticky. If the regulator piston and cylinder bores are caked with spray they will ‘hold’ the valve until the pressure/spring balance overcomes the friction.
    • Sometimes valve, and/or the valve guide pin are seized. Disassemble them, clean all sliding surfaces, then lubricate and adjust.
    • Valve/seat wear may have created a leak. You may have already tightened the spring to compensate, but this loads the spring past the pressure balance point you want to spray at. This means that when the booms are shut off, the pressure increases until it reaches the ‘new’ spring balance point. Repair (or replace) the regulator, then lubricate and adjust. Be aware that any leak (external or internal) can contribute to this condition and tightening the spring isn’t the solution.
    • The spring may be damaged (e.g. bent, corroded, etc.). Replace the spring, lubricate and adjust.

    Note: Be sure to read the operator’s manual before you do anything. You should understand your sprayer’s design before you perform any maintenance, adjustments or calibration.

    Spring size

    Sometimes, the relief valve may be mechanically sound, but the spring may not be sized to match a reduced operating pressure. Relief valve springs match the maximum pressure range of the pump. Sprayers operated at lower pressure may be unable to compress the spring. This is common when people switch from disc-core nozzles operated at higher pressure to molded nozzles operated at lower pressure.

    This would manifest when one boom is shut off for single-boom operation; there may not be enough pressure to open the bypass. As a result, flow increases over the remaining boom.

    Recognizing this problem, some operators have teed-in a second relief valve capable of finer adjustments at lower pressures. Make sure you know what you’re doing if you’re considering this option.

    Technically, a spring can either be too weak, or too heavy:

    • The spring may be too weak for the pressure being used (i.e. any adjustment bottoms out). In order to obtain sufficient pressure the operator tightens the spring until it is virtually collapsed, essentially creating a fixed orifice. When the booms are closed the ‘fixed orifice’ doesn’t compensate and pressure rises to force the increased flow through that small orifice.
    • If the spring is too heavy for the pressure being used (any adjustment barely touches the spring when pump is turned off). In this case, the pressure being used will not deflect the spring, so the operator closes the regulator until the ‘fixed orifice’ creates sufficient restriction to flow to achieve the desired pressure. When the booms are closed the ‘fixed orifice’ doesn’t compensate and pressure rises to force the increased flow through, or until the spring begins to deflect.
    • In either situation the spring must be sized so it is in the centre-third of its flex range (i.e. rest state > fully collapsed) at the desired pressure. You can buy springs from the sprayer dealer or hardware supply. Try to maintain original length and diameter of the coil, while varying the diameter of the wire.

    Engineering

    In some cases, it is not a matter of valve maintenance, or spring size, but poor engineering. Consider the following:

    • The valve supply and return may be too small for the pump flow. Consult hose and fitting catalogs for flow capacities and lengths. Re-size the hoses and fittings appropriately, and then adjust the regulator.
    • There may be kinks or sharp bends in in the supply and return lines. Re-route the hoses and/or fittings to avoid kinks and sharp bends, and then adjust the regulator.
    • The relief valve may be too small for the pump flow. Consult a regulator catalog for flow capacities and replace the regulator with an appropriate size. Calibrate the regulator spring and adjust.
    • Relief valves have a ‘cracking’ pressure (that’s when the valve just starts to open). Well-designed regulators have small pressure changes from ‘cracking’ to full flow. That information is in their catalogs. Poorly designed regulators have large pressure changes between these two ratings and these regulators should be avoided.
    • The pump may be too big for system. This often happens when sprayers are upgraded and pumps are replaced. Consult the catalogs and reduce pump size or speed, or increase the sizes of the hoses, fittings and regulator.
    • There may be a hydraulic agitator jet on the regulator ‘tank’ line. An agitator jet applies considerable back pressure to a system, and when booms are closed the increased flow causes more than a linear increase in pressure.
    • Broadly, the sprayer system as a whole may be poorly engineered. Inspect and draw a flow path of the sprayer system. Examine where everything is going (or not going). Is it possible someone made changes that the manufacturer did not intend? Consult the manufacturer if you are uncertain. Sometimes, it will have to be re-engineered, which may require expert consultation.

    Note: Your pressure gauge can tell you a lot more than your operating pressure – it can indicate a problem with your regulator, pump, lines or overall sprayer engineering. Don’t ignore it – address it.

    Thanks to Murray Thiessen, Consulting Agricultural Mechanic, for his contribution to this article.