Category: General Operation

Articles that discuss general field sprayer operation and productivity factors

  • Spray Window – Can you plan a spray week?

    Spray Window – Can you plan a spray week?

    Plan the day. Weigh the risks. Finish the job.

    Spray Window is a strategy game about spray planning. You have one sprayer and six working days of changeable weather. Depending on your role, you manage your own fields or a list of clients’ jobs.

    Each turn is one day. Read the forecast and what each field needs, choose which jobs to do and in what order, set up the sprayer, and see how the day unfolds. There’s no single right answer.

    It’s what every operator learns on the job: assess the work, plan ahead, weigh risk against reward, and get as much done as you safely can. A week takes about 20 minutes and plays best on a tablet or computer. At the end, a debrief shows what your decisions cost, what they saved, and how a benchmark operator planned the same week.

    Why a game?

    Sprayer training usually covers drift, Delta T, inversions, spray quality, water volume, travel speed one at a time. On a real morning they all arrive together, along with crop stage, a closing window, a neighbour, and someone waiting on the work.

    Those decisions rarely have one correct answer, so they’re hard to teach in an article or test with a quiz. An owner facing a closing disease window might reasonably accept more drift risk than a custom applicator whose business depends on reputation. Both may be making a sound call.

    A simulation lets you decide, live with the consequences and try again. In Spray Window, the opponent is the weather and the clock, not another player. And, of course, it’s a fun 16-bit style that reminds me of a lot of wasted quarters in my youth.

    How it plays

    The game is set in Ontario mostly on corn, soybeans and winter wheat, with canola, white beans, sugar beets, processing tomatoes and potatoes in some weeks. Every week is a new combination of fields, crops, pests and weather, in one of three seasons.

    Choose your role (owner-operator or custom applicator) and your level, outfit your sprayer on a limited budget, pick your tires, and dive in. The weather changes, and there are surprises to deal with.

    There are three levels.

    • Beginner is a quiet week of seven fields: honest work orders, no surprises, no tank cleanouts and nobody pushing you to spray, and the sprayer comes ready to go.
    • Intermediate has ten fields and adds wind gusts, an interruption, wet ground, cleanouts and people leaning on you.
    • Expert is the full game. Your week is saved each morning, so you can stop and come back to it.

    Micron Woman is back to be your guide.

    Choose your role and level – the scenarios change accordingly.

    Spring

    In mid-May, jobs include herbicide and fungicide in wheat, a pre-emergence herbicide before the corn comes up, a burndown ahead of soybean planting, and insecticide for cereal leaf beetle and black cutworm at threshold.

    Early Summer

    In mid-June, jobs include fusarium head blight at wheat flowering, a Group 4 herbicide before the corn’s crop-stage limit, post-emergence herbicides in soybeans, and armyworm in wheat.

    Mid-Summer

    In late July, jobs include tar spot at corn tassel, white mould and soybean aphid in soybeans, western bean cutworm, and a pre-harvest herbicide as wheat dries down. 

    Drift

    Every field borders something sensitive: open water, a neighbour’s home and garden, beehives in a flowering hedgerow, a vineyard or a certified organic farm. Each responds as it would in real life.

    When water or habitat is downwind, the label may require an unsprayed buffer, and coarser sprays shrink it. Coarser sprays also cut drift sharply, because each step coarser roughly halves the fine droplets that drift, but fungicides and insecticides lose some coverage, so more water helps them. Heat brings another risk: after application, dicamba can turn to vapour and move off target whatever the nozzle. In June, a cooler day or a pass after the heat of the day may be the safer call.

    Sometimes, not spraying is the right move.

    Outfit your sprayer for the week ahead.

    High scores, weekly scenarios and feedback

    Money keeps score. Beside your money, a second readout shows whether you’re ahead (▲) or behind (▼) the benchmark operator playing the same week. Every off-label pass is a label strike and a fine, so bad calls sting right away. If your balance falls below zero, you’re broke and the week ends with zero points.

    A score of 1,000 means you finished as well off as the benchmark. Both roles use the same yardstick, and weeks are drawn from scenarios of similar difficulty, so scores are comparable. Each level has its own benchmark and its own high scores, so beginners compete with beginners.

    Ranks are awarded as follows: 

    • Apprentice (0-499)
    • Operator (500+)
    • Pro (800+)
    • Ace (950+)
    • Legend (1,100+)
    Get your rank and scorecard. See what you might have done differently.

    At the end of the week you get your report card. “Turning points” shows the three decisions that cost you most and what the forecast would have allowed instead. If you want to understand how the game balances all these variables, check out the (assumptions) button.

    Enter your initials arcade-style. Your score is sent to the leaderboard automatically and once we review it, the leaderboard updates. Playing a downloaded copy? Email the code from the end screen to jason@sprayers101.com. Something odd, or a call you’d question? Copy the code and send it with a note: your exact week can be replayed. Only a week’s first play counts; “Play this week again” is for practice.

    Thanks to Dr. Ian McDonald for the inspiration to build a game. Ready to play?

    High Scores

    1. 1RKLegendCustom applicator1,102points
    2. 2JAYAceOwner-operator1,072points
    3. 3RKAceCustom applicator994points

    See the full leaderboard

    Version Updates:

    Updated November 6, 2026: Three levels, Beginner, Intermediate and Expert, each with its own high scores. A week in progress is saved on your device, so you can finish it later. And on still mornings, listen for a train in the distance. Scores from earlier versions count as Expert.

    Updated November 5, 2026: Refills and water volume now add up correctly, so more water never makes a job finish sooner (thanks, Lucas). Each job card now shows how the product moves, its Group and its rainfast time, and the day plan warns when rain could wash it off. Micron Woman’s tutorial is clearer and shorter. Scores from earlier versions still count.

    Updated November 2, 2026: Spray quality and walking the edges rebalanced so careful decisions pay off more, and the top three scores now appear on the title screen between rounds. Scores from earlier versions still count.
  • How Much Pesticide in the Tank?

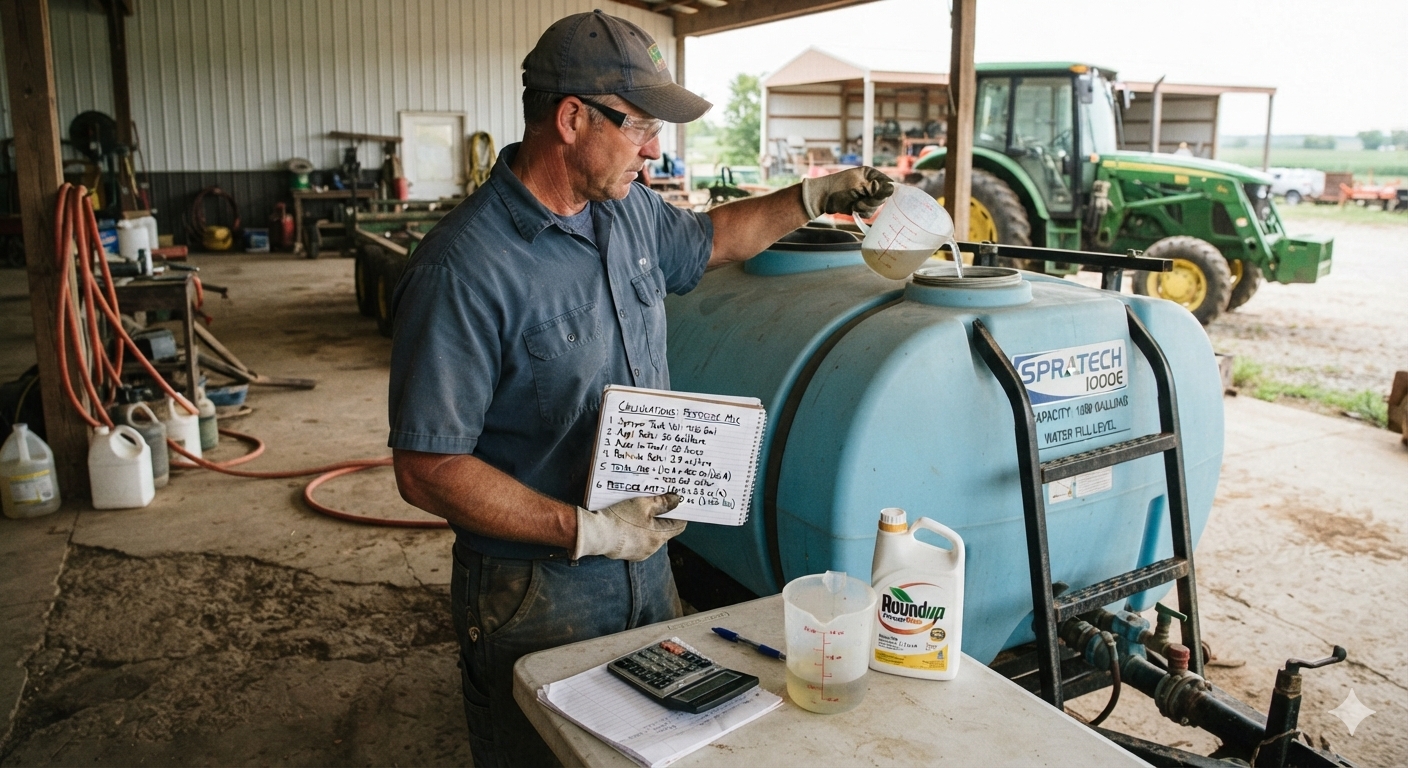
    How Much Pesticide in the Tank?

    Sprayer math can be intimidating, but the effort gives solid value. When combined with a calibrated sprayer you reap the following benefits:

    • Determine how much spray mix is required to apply the intended rate.
    • Estimate how much crop protection product must be ordered for the season.
    • Populate spray records which allow you to review practices, respond to enquiries and satisfy traceability requirements.

    There are many ways to perform sprayer math, and you need only look to local pesticide safety courses, industrial catalogues, and extension resource centres for examples. If you’re already comfortable with your current method, don’t mix and match with others. Sprayer math is a series of related calculations that employ constants to keep the units straight. It’s all or none.

    Walkthrough

    Let’s start with the classic, US Imperial formula for calculating the sprayer output. We’ll weave in Metric, later. This base formula can be adjusted to allow you to solve for any factor, as long as you’re only missing one piece of information. Turns out your high school teacher was right – you DO need algebra.

    GPM = [GPA x MPH x W] ÷ 5,940

    In this case, you can determine an output rate (GPM – gallons per minute). You’ll need to know your target volume (GPA – gallons per acre), your average travel speed (MPH – miles per hour) and your nozzle spacing (W – which is width in inches). The number “5,940” is a constant that handles all the unit conversions. If you divide the GPM by the number of nozzles on your sprayer (assuming they are all the same rate), you can hone in on the ideal nozzle size.

    But, as we noted earlier, you can do a lot more with sprayer math than just pick the ideal nozzle size. The rest of this article includes examples of both Metric and US Imperial formulae, but watch out for unit conversions. If at any time you don’t see the units you’re looking for, you can consult our unit conversion tool.

    Grab your calculator – it’s math time!

    Don’t be intimidated. With a little practice, sprayer math gets easier and it’s always worthwhile. The real trick is navigating unit conversions.

    Step 1 – How large is the area you need to spray?

    Multiply the length of the area you plan to spray times the width. If you are using metres, then divide the product by 10,000, which is the number of m2 in a hectare (ha). For feet and acres, divide by 43,560 which is the number of ft2 in an acre (ac):

    Step 2 – How much product is needed to spray the area?

    Consult the rate(s) shown on the label. In Canada, rates are often based on planted area (E.g. hectares). In Australia and New Zealand, they may be based on row length (not covered in this article). If you measure your area in acres, you’ll have to convert the rate by multiplying by a constant: 0.4.

    product-per-area

    Now multiply the area you want to spray (step 1) by the rate (step 2).

    product-per-area2

    Step 3 – How far can you go on a full tank?

    You know your sprayer output (determined through calibration) so you divide that into your tank size. Watch your units:

    full-tank-distance

    Step 4 – How much pesticide per tank? 

    Multiply the area that can be sprayed per tank (Step 3) by the pesticide rate (Step 2). Again, watch your units:

    pesticide-per-tank

    Step 5 – How much area is left to spray?

    Just subtract what you’ve already sprayed from the total area.

    area-left-to-spray

    Step 6 – How much pesticide in the last, partially-full tank?

    Multiply the area you have left to spray (Step 5) by the pesticide rate (Step 2). Yes, watch your units:

    pesticide-partially-full-tank

    Step 7 – How much spray mix will I need for the partial tank to finish spraying the total area?

    Multiply the area you have left to spray (Step 5) by the sprayer output (determined through calibration). Guess what? Watch your units:

    spray-mix-for-total-area

    Sample problems

    Time to test your knowledge. Let’s suppose you want to apply a product rate of 3 L/ha to your blueberries. You calibrate your sprayer and determine your output to be 50 L/ha. Your tank holds 400 L of spray mix. Your planting is 500 m long and 200 m wide.

    Q1 – How large is the area you need to spray?

    area-to-spray

    Q2 – How much product is needed to spray the area?

    product-to-spray-the-area

    Q3- How much area can be sprayed on one tank?

    area-on-full-tank

    Q4 – How much product should be added to a full tank?

    product-needed-full-tank

    Q5 – After the tank is empty, how much area is left to spray?

    area-left

    Q6 – How much product to add to the last, partially full tank?

    product-partially-full-tank

    Q7 – How much spray mix will be needed to finish spraying?

    spray-mix-to-finish-spraying

    Tank mix calculator

    You might feel we buried the lead by adding this calculator to the end of the article. It’s important for a sprayer operator to understand the math required to interpret labels and calculate tank mixes, so hopefully you read and understood the process before you got here. And now that you have, this is a very helpful tool. Try it online, or download a standalone version.

    Notable exceptions

    Certain situations aren’t covered in this article. If you are spraying a greenhouse, the math is different. If you are performing a banded application, the math is different. And, if you’re an airblast operator trying to reconcile why a pesticide label uses planted area rather than canopy volume for its rates, you’re in for some additional reading.

  • Sprayer Math for Banded Applications

    Sprayer Math for Banded Applications

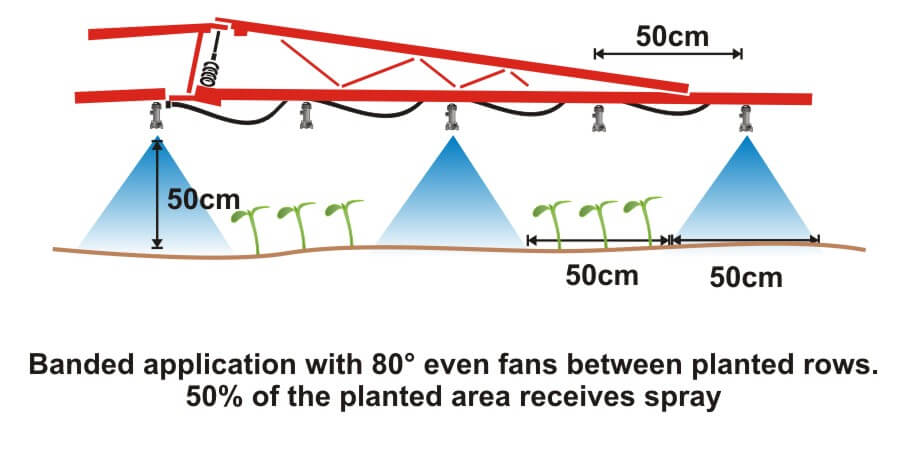
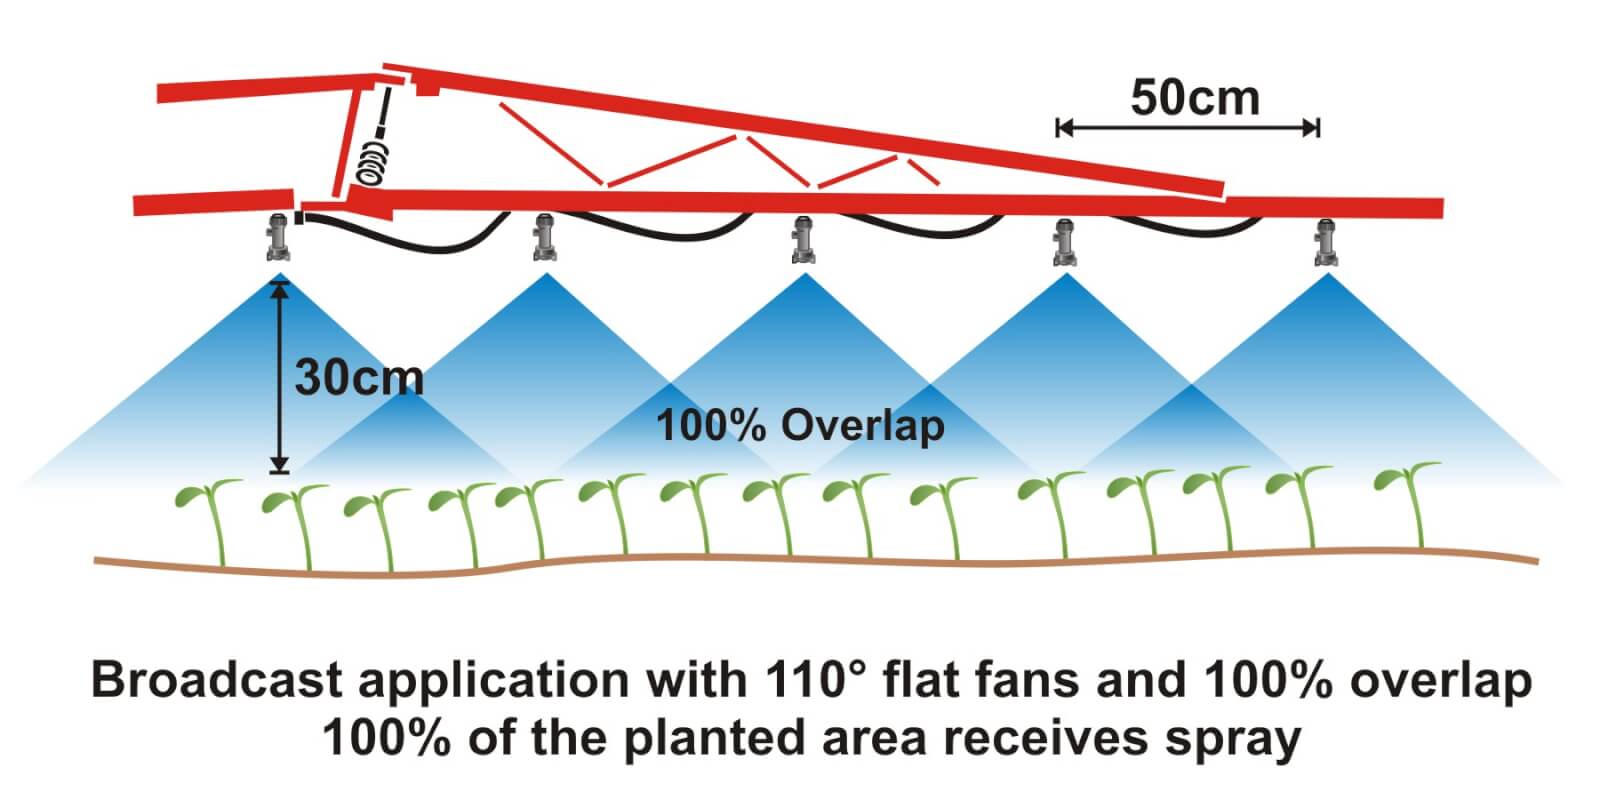
    Where crops are planted in rows, growers can save on chemical costs and reduce potentially wasted spray by performing banded applications. A banded application is treating parallel bands (Figure one), unlike a broadcast application where the entire area is treated (Figure two). This means only a portion of the field or orchard/vineyard floor receives spray, so the total amount of product applied per hectare (or per acre) should be less for banded than for broadcast.

    Figure 1
    Figure 1
    Figure 2
    Figure 2

    Banded applications are used in many situations, including:

    • Applying herbicides right over a crop during planting, both for pre-emergent or post-emergent crops.
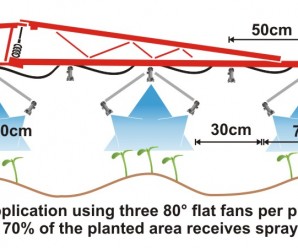
    • Applying insecticides/fungicides by “directed spraying” using drop hoses or row kits; the latter is pictured in Figure three.
    • Carefully spraying herbicide between the rows to control weeds in the alleys of an established crop (Figure one).
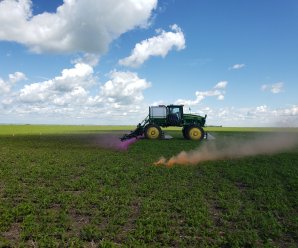
    • Applying herbicide under fruit trees or grape vines to control weeds (Figure four).
    Figure 3
    Figure 3
    Figure 4
    Figure 4

    It’s easy to make mistakes when calculating product rates for banded applications and these can be costly errors: too little means poor control and too much means wasted product and possible crop injury. This article describes how to calculate sprayer output and product rate for common banded applications.

    Step One: Determine broadcast volume

    Pesticide labels typically list broadcast product rates (e.g. amount of formulated product per hectare or acre). In this example, let’s say the label recommends a broadcast product rate of 500 ml of formulated herbicide applied using 100 litres of spray mix per hectare (i.e. added to 99.5 L water).

    Step Two: Establish sprayer settings

    Select a travel speed that is safe, gives decent efficiency and doesn’t compromise coverage. For this example, we’ll say the sprayer moving is at 8.0 km/h.

    Select a band width that completely covers the target row and some of the adjacent area where control is desired. Band width should be measured along the ground for soil-applied products or along the top of plants for post-emergence products. We’ll use Figure one for our settings: bands are 50 cm wide on 100 cm centres. We’ll say that a single nozzle swath can treat the band, and that we’re spraying 2 hectares of planted area.

    Step Three: Calculate the banded sprayer output

    We can calculate how much of the planted area actually receives spray using this formula:

    [band width (cm) ÷ row width (cm)] x total planted area (ha) = actual sprayed area (ha)
    [50 cm ÷ 100 cm] x 2 ha = 1 ha

    For completeness, here’s the US formula:
    [band width (in) ÷ row width (in)] x total planted area (ac) = actual sprayed area (ac)

    From this we now know that we should be able to go twice as far on a tank spraying a banded application as we would a broadcast, because we’re only spraying half the planted area.

    Step four: Calculate the nozzle output

    Use the following formula to convert the broadcast output into the banded output:

    [broadcast output (L/ha) x travel speed (km/h) x (swath width (cm) ÷ number of nozzles per swath)] ÷ 60,000 = nozzle output (L/min)
    [100 L/ha x 8 km/h x (50 ÷ 1)] ÷ 60,000 = 0.67 L/min

    For completeness, here’s the US formula:
    [broadcast output (gal/ac) x travel speed (mph) x (swath width (in) ÷ number of nozzles per swath)] ÷ 5,940 = nozzle output (gal/min)

    If multiple nozzles were contributing to the swath, such as in figure three or figure four, this formula will account for it. You still mix the labelled product rate at a ratio of 500 ml of herbicide to 99.5 L water, but as we determined in step three, we should be able to spray twice the planted area using a banded application as we would a broadcast application.

    Warning! Watch your units. You may be familiar with other formulae for calculating your output. Do not mix and match formulae or parts of formulae. For example, here is another Metric option for determining L/min. It employs different units so it requires a different constant:

    [broadcast output (L/ha) x travel speed (m/min) x (swath width (m)) ÷ number of nozzles per swath)] ÷ 10,000 (m2/ha) = nozzle output (L/min)

    Step Five: Use the nozzle catalogue to find the right nozzle

    Using a nozzle manufacturer’s catalogue, select a nozzle that gives the desired spray quality (usually coarser for herbicides) and will produce the 50 cm swath we’re looking for (which can be adjusted a little using boom height). Always choose to operate a nozzle in the middle of its pressure range.

    Step Six: Calibrate the sprayer (i.e. double-check)

    Follow your typical calibration process and make minor adjustments until the nozzle discharge per minute results in the desired banded output. A rate controller will handle this on larger sprayers, but if you don’t have one you can make small adjustments to speed and pressure until the desired output is achieved. Ideally, if your math was right, these changes won’t be needed.

    When performed correctly, banded applications are a great way to focus your efforts on the target, saving time and money.

    Other Resources

    Download this booklet on spraying potatoes using banded rows. Or try our calculator:

  • We Need Better Drift Control Technologies

    We Need Better Drift Control Technologies

    Sprayer manufacturers have all but offloaded the entire responsibility for drift management to the sprayer nozzle. It’s asking too much.

    Sprayers have changed a lot over the past 25 years. They have become larger, with more tank capacity, boom width, and, if self-propelled, horsepower.  They are more comfortable and ergonomic, with more sophisticated swath control and guidance systems. But every year, a very important deficiency in their design becomes obvious. Drift control.

    The changes described above are intended to improve productivity and fight operator fatigue.  Today’s sprayer can cover more ground than ever before. But the demand to cover ground, through a combination of growth in farm size and frequency of treatment, has outpaced machine productivity. As a result, operators find themselves ever further in a time deficit, with acres on the to do list and no time to get the work done.

    Spray drift remains the single most limiting factor to the safe application of pesticides. Spraying cannot happen when it’s too windy or during inversions because all agricultural nozzles produce fine droplets whose movement in the atmosphere cannot be controlled. This has been an issue since spraying began.

    Simply put, pesticides belong in one place only, and that is on the treated swath.  Applicators have some tools to make this happen, such as using coarser sprays, lowering the booms, choosing very specific weather conditions, and the like. But when winds are incessant, and crops and pests are quickly growing out of the treatable stages, what is an applicator to do?  There is only one thing they can do: lower their standards. Either miss the treatment and suffer the yield loss, or spray in the wind and hope nothing bad happens.

    Neither of these options are acceptable.

    There isn’t an easy fix. Spraying is a game of tight margins. The spray liquid in the tank must be atomized into droplets that can make their way to the target and provide adequate coverage when they get there. The total liquid volume to achieve that task must also be practical. The global ag industry has determined, over the past 100 years, that about 100 to 200 L/ha, 10 to 20 gallons per acre, is the ballpark amount that allows reasonable work rates with sprays that are just coarse enough to resist displacement in modest winds.  If it gets windier and we need even coarser sprays, we need to add more water to maintain an acceptable droplet density on the targets. And of course, the droplets need to stick to those targets, so there is a limit how coarse we can spray.

    Over the past 20 years, we’ve been asking the low-drift nozzle to do the heavy lifting in drift management, and it has served us well. But with a return to more contact modes of action for resistance management, there’s a need to retain good coverage for product performance.

    What ag needs is a drift-reducing technology that is better than the low-drift nozzle. We need a technology that maintains a practical water volume limit and combines this with intermediate spray qualities that generate good pesticide efficacy without allowing drift under windy conditions.

    These technologies need to do just one of three things: (a) Protect the driftable droplets from exposure to moving air with a physical barrier, (b) make driftable droplets less drift-prone by increasing their velocity, or (c) eliminate the driftable droplets altogether.

    Let’s have a look at some options, and explore the pros and cons.

    Shields and Cones.  A shroud surrounding the boom was first proposed and built in the 1950s in the UK by Dr. Walter Ripper. Although never commercial, his “Nodrif” boom inspired an entire industry that took hold in western Canada in the 1980s and 1990s. Shrouding worked. In studies conducted at Ag Canada, shrouds produced by Flexi-Coil, Rogers Engineering, AgShield, and Brandt reduced drift by up to 80%. But shrouds disappeared in the 90s, partly because of the advent of tight-folding suspended booms where their physical size posed a problem, but also because of crop contamination from the shrouds and poor nozzle visibility in case of blockages.

    The advent of the air-induced low-drift nozzle offered an alternative, but coarseness has been taken to its practical limit. 

    What about a newly engineered version of shrouds that addresses its shortcomings? Willmar Fabrication has created the Redball Buffer Sprayer, for example. We see hooded sprayers in row crops. But there may be other ideas. The simple device called the PatternMaster introduced by KB Industries a few years back was also a step in that direction. Let’s keep working on this.

    Figure 1: Shrouded booms, once common on the prairies and proven effective (Brandt cones, top), are still used on research and turf sprayers (bottom).

    Air Assist. Small drops don’t drift just because they’re small. They drift because they have very little kinetic energy, and they get blown off course easily. Speed them up, and that problem is solved. Introducing an air stream at the nozzle can do just that. Furthermore, air assist also enhances canopy penetration, a problem that we currently attempt to address with the addition of more water. Again, this idea is not new. Hardi, once the world’s largest sprayer manufacturer, has had the TwinForce boom available for decades. An inflatable bag is positioned over the boom. Openings along the bottom direct the air down. The operator turns a knob in the cab to control fan speed, and another for forward or backward angle, until the combination is suited to the canopy and the travel speed. The SprayAir, out of Carseland, AB (purchased by Miller but no longer available) was a less elegant version because they chose an air-shear atomizer that sometimes required more air than was prudent. Too much air rebounds off the ground, increasing the drift issue. Their Trident boom, allowing a hydraulic nozzle to be used with air assist, continues to have potential.

    Air bag type air assist systems were also available from other manufacturers, but none were ever commercially successful.

    Figure 2: Air assisted booms such as this Hardi TwinForce accelerate small droplets, reducing their drift-potential and improving canopy penetration (Source: Hardi Sprayers)

    Low Booms.  How low can booms go? It depends on the nozzle spacing and fan angle. Horsch claims that with a good boom package, this is an option. They are offering 10” spacing, and with wide fan angles, booms as low as 15” would still provide good overlap. Hands up who will try this at 18 mph. Wingssprayer has an interesting design where the boom rests on backswept plastic sheets, providing a physical barrier and a low height.

    Figure 3: Low booms can significantly reduce drift, but their success depends on superior stability and height control (Top, Source: Horsch Sprayers; Bottom, Source: Wingssprayer)

    Twin Fluid Atomizer. In this atomizer type, both air and liquid are forced out through the same nozzle. The ratio of air and liquid determines the liquid flow rate and the degree of atomization. First introduced by Cleanacres in the UK as the Airtec, improved by Harry Combellack in Australia over many years, and making a re-appearance with the Dutch manufacturer Agrifac, it’s been one of my favourite atomizers.  The small amount of air moving through each nozzle is not enough for serious air-assist, but the idea is good and perhaps it can be improved.

    Figure 4: A twin fluid atomizer utilizes air (entering from hose) and liquid (entering from boom) to create a spray whose droplet size and flow rate are adjustable. Air generates some assist to reduce drift.

    Electrostatics. Forget about it for drift control. The attractive force is so weak that it only works for very small droplets over short distances. It needs air-assist to work properly. See point #2.

    Rotary Atomizer. These are common on aircraft these days, as rotary cages, offering a more consistent droplet size range that eliminates the largest, water-wasting droplets, and curtails many of the smallest droplets produced by hydraulic atomizers. These attributes are powerful and address the fundamental problem: If the small droplets drift, then let’s not produce them. In reality, rotary atomizers are used mainly to produce smaller droplets to save water in the aerial business, not really solving the drift problem. In the 1970s and 80s, the concept was advanced by Micron Corporation, led by Ed Bals and later by his son Tom. Although very successful in forestry and hand-held applications in arid regions where water posed a serious limitation, the transition to boom spraying never happened.

    Rotary atomizers are now making a comeback with drone sprayers. Though promising, the flow rate capabilities of spinning disks are lower than those of the cages mounted on crewed aircraft. As a result, the disk may flood, and will no longer produce the desired monodisperse distributions.

    Figure 5: Rotary atomizers can eliminate larger droplets and sharply reduced the smallest ones, leaving a more uniform sized distribution (insert). They are used on aircraft to save water, but have not been adopted on ground equipment to control drift.

    A new Atomizer. All hydraulic nozzles produce a wide variety of droplet sizes, and that variety has provided robust performance over a wide range of conditions. But it can also be a problem. Even the venerable dicamba nozzles that create Extremely Coarse and Ultra Coarse sprays produce some fines that drift in inversions. The idea put forth by Ed Bals, to eliminate the problematic size ranges, is sound. But the rotary atomizer is hard to implement on a boom sprayer. Can there be an innovation that maintains a simple overall design, produces a narrow, but low-drift droplet size range, and mates it to a bit of air assist to get the spray where it belongs? Absolutely.

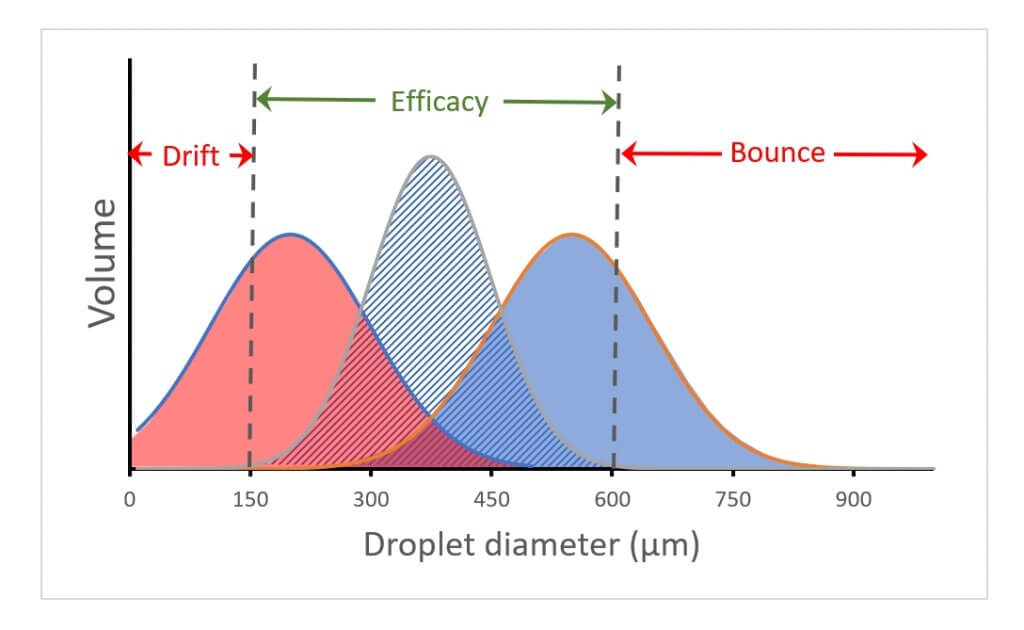
    Figure 6: Current hydraulic atomizers tend to produce a wide range of droplet sizes. The distribution on the left results in significant drift (droplets <150 µm). The one on the right wastes the larger droplets (droplets >600 µm. The narrower span in the centre distribution avoids these problem areas and delivers the spray in an efficacious portion.

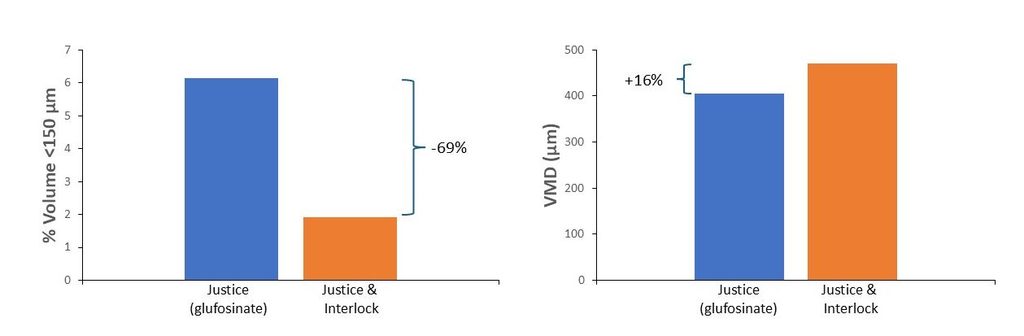
    Adjuvants. One of the problems with low-drift nozzles is their tendency to generate some very large droplets. These droplets are not very abundant and therefore don’t contribute to coverage, but they nonetheless consume significant carrier volume. The current generation of oil-based drift-reducing adjuvants (DRAs) have helped reduce the drift-prone size fraction without increasing the largest droplet size fraction as much as low-drift nozzles do. This more surgical approach is welcome. Unfortunately, the drift-reducing effect is not as much as low-drift nozzles alone can achieve. A combination of these two technologies is likely the best way forward.

    Figure 7: Effect of DRA on driftable fines (left) and overall volume median diameter (VMD, right) from AIXR11004 tip. Data courtesy Winfield United.

    Targetted Sprays. An obvious way to reduce drift is to spray less. With recent developments in camera-driven spot spraying, this is already happening. It’s safe to assume that every percentage not sprayed is an equivalent reduction in drift potential. And with reports of 50 to 90% savings, this will be significant. How these product savings are deployed remains important. Some applicators choose to raise pesticide rates to effect better control, and this of course negates some of the gains. Others are increasing the overall spray volume. This then opens the door to the use of coarser sprays without loss of coverage, enhancing gains.

    Figure 8: Spot spraying (Courtesy Croplands)

    To create value for farmers you first need to understand farmers’ priorities and problems. Getting the spraying job completed on time often means squeezing the work into ever narrower time frame, between rains, between winds in the afternoons and inversions that same evening, between too much dew and too dry, between too early and too late. I am looking forward to the day when engineering resources are allocated to address these issues better, protecting both the environment and the stress levels on the farm.

  • Increase Sprayer Productivity Without Driving Faster

    Increase Sprayer Productivity Without Driving Faster

    Timing trumps most things in crop protection. A great spray applied at the wrong time isn’t nearly as valuable as a mediocre spray at the right time. So how do we improve our ability to get things done at the right time?

    Often, we try to win races by driving faster. In our last article, we looked at driving speed and concluded that faster speeds can lead to more drift and less uniform deposition. Driving slower can be viewed as a sort of insurance policy: You may not notice the benefits right away, but on days when that extra bit of performance is required, you’re covered.

    So how do you get the job done quickly if you can’t drive faster?  To answer, we have to look to other opportunities for boosting productivity.

    Recently, we used our and tried to capture all the elements of a normal spray operation that affect timeliness. These were:

    • travel speed
    • boom width
    • tank size
    • water volume
    • field length
    • number of headlands
    • turning speed
    • fill time

    First, we identified a reasonable base condition. For the sprayer, that was a travel speed of 14 mph, a 90’ boom, an 800 gal tank, a 10 gpa water volume, and a 20 minute fill time. Then, we set up a typical field situation, which was spraying a half-mile run on a quarter with two sprayed headlands and a turning speed of 8 mph. Finally, we changed one factor at a time to determine its relative importance.

    Before we discuss the results, let’s make it clear that just because changing some of these factors improves productivity doesn’t mean we’re recommending them! For example, adequate water volume remains an important input that improves coverage and permits the use of low-drift sprays. Larger tanks increase compaction and take more power, and so forth.

    Here’s what we found:

    All productivity values were expressed as acres per engine hour. For this reason, our numbers will be lower than what a typical sprayer monitor reports, most of which calculate acres per spraying hour.

    For the base condition, the sprayer spent 15% of its driving time turning, and 37% of its on-field time stationary (i.e. filling or cleaning).  For every hour spent on the field, less than half the time (48%) was spent spraying. This resulted in an average productivity of 82 acres/h.

    Increasing the spray speed to 18 mph increased average productivity to 93 acres/h, but it also increased the proportion of time spent turning and loading, resulting in just 40% of the field time spent spraying.

    Decreasing the loading time from 20 to 10 minutes reduced the proportion of field time spent stationary to 23%, covering 100 acres/h at 14 mph. Surprisingly, this was the productivity-winner, resuling in 62% of on-field time spraying.

    We discovered other powerful productivity factors, and chief among them was boom width. A 33% increase in boom width from 90’ to 120’ gave a productivity boost to 94 acres/h, close to the same result as increasing the travel speed to 18 mph earlier. Similar side effects occurred: more time turning, and a greater proportion of time filling, as we saw with faster travel speeds.

    Boom width seems to have some room for growth.  Many smaller European counties use wider booms than we do in North America, for example.  With gps guidance and large fields, we have excellent conditions for their implementation.

    Two other factors that had similar effects to fill time were water volume and tank size. Less water and larger tanks increased productivity by decreasing the fill frequency, with effects similar in magnitude to speeding up the fill time. Decreasing the water volume from 10 to 5 gpa increased productivity to 100 acres/h by decreasing the proportion of time the sprayer was stopped from 37% to 23%. Increasing from an 800 to a 1,200 gallon tank increased productivity to 94 acres/h, again by decreasing the proportion of time spent filling to 28%.

    Taken together, a sprayer with a 120’ boom, a 1,200 gal tank, applying 10 gpa and filling in 10 min had an average productivity of 132 acres/h. And this was achieved without driving faster than 14 mph. If you can string two quarters together and drive a whole mile before turning, that number rises to 145 acres/h, a surprisingly large 13 acres/h gain.

    The perspective of minimizing downtime extends to other tasks, too:

    • Be more prepared for the job by reviewing the product label in advance, noting the correct mixing order.
    • Keep extra nozzles, clamps, and nozzle bodies in the cab.
    • Don’t clean plugged nozzles, replace them.
    • Use low-drift nozzles so a small increase in wind doesn’t shut you down.
    • Ensure all the products needed are on the tender truck (e.g. pesticide, adjuvant, tank cleaner, anti-foamer, etc.).
    • Consider switching to 3” plumbing (pump rates of 300 – 400 gpm are possible).
    • Make sure your inductor won’t be the limiting factor. For example, product pumps can be awfully slow when the product is cold. It might be worthwhile to explore a venturi system.

    Speeding up the fill process is a good idea, but be careful with certain products. Dry materials such as the sulfonyl ureas (e.g. Refine, Express SG, etc.) and some fungicides (e.g. Astound, etc.) require time to hydrate in water so they mix properly. Some operators pre-hydrate these in a smaller tank, while others get an extra tank to pre-mix whole loads and simply transfer them over.

    Also think about the time spent cleaning the sprayer. Thoroughness is important, but perhaps there are efficiencies to be gained there as well, like never letting a sprayer sit after spraying. We’ve written about continuous rinsing, for example, to improve cleaning speed and effectiveness.

    So, the quicker we can spray, while ensuring a quality job, the more effective our crop protection practices will be. We encourage you to use our to determine your best configuration.

    Got a productivity tips to share? Let us know! And remember: In spraying, the race is won in the pits.

    Factor

    Base

    Drive Faster

    Fill Faster

    Spray Wider

    Less Water

    Bigger Tank

    New Sprayer

    Travel Speed

    14 mph

    18 mph

    14 mph

    14 mph

    14 mph

    14 mph

    14 mph

    Fill time

    20 min

    20 min

    10 min

    20 min

    20 min

    20 min

    10 min

    Boom Width

    90 ft

    90 ft

    90 ft

    120 ft

    90 ft

    90 ft

    120 ft

    Water Volume

    10 gpa

    10 gpa

    10 gpa

    10 gpa

    5 gpa

    10 gpa

    10 gpa

    Tank Size

    800 gal

    800 gal

    800 gal

    800 gal

    800 gal

    1200 gal

    1200 gal

    Field Length

    0.5 mile

    0.5 mile

    0.5 mile

    0.5 mile

    0.5 mile

    0.5 mile

    0.5 mile


    Time Turning

    15%

    19%

    15%

    20%

    15%

    15%

    20%

    Time Loading

    37%

    42%

    23%

    42%

    23%

    28%

    19%

    Time Spraying

    48%

    39%

    62%

    38%

    62%

    57%

    61%

    Acres/h

    82

    93

    100

    94

    100

    94

    132

    To work with the productivity calculator, click here.