Category: Coverage

Articles related to horizontal boom sprayer coverage

  • Spray Coverage in Field Tomato

    Spray Coverage in Field Tomato

    Spraying field tomato is difficult – period.

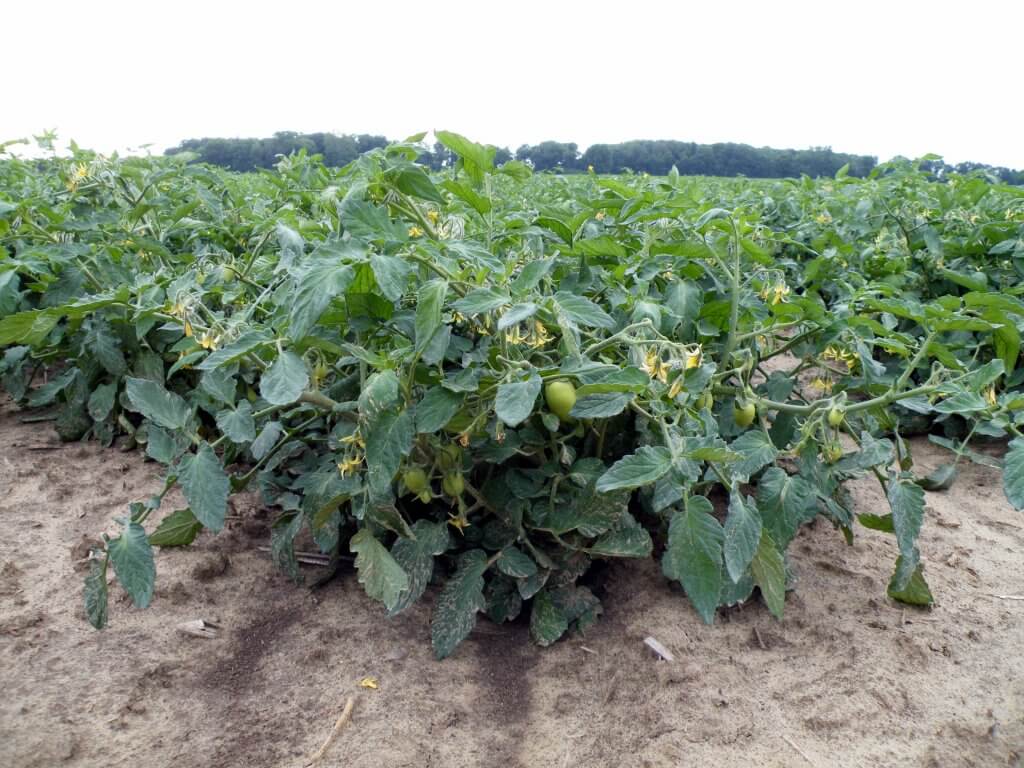
    In Ontario, early variety tomato canopies get very dense in July. The inner canopy is relatively still, humid, cool and a perfect environment for diseases such as late blight. It is challenging to deliver fungicides to the inner canopy and this can lead to inadequate disease control. Matters are slightly improved as the fruit grows and pulls the canopy open, and staked tomatoes might allow for the use of directed sprays, such as drop arms in staked peppers. But, there’s no getting around it – from a droplet’s perspective, it’s tough to get through the outer canopy.
    DSCF0002
    Imagine you are a spray droplet trying to get inside this canopy.

    Study 1 – Qualitative Observations

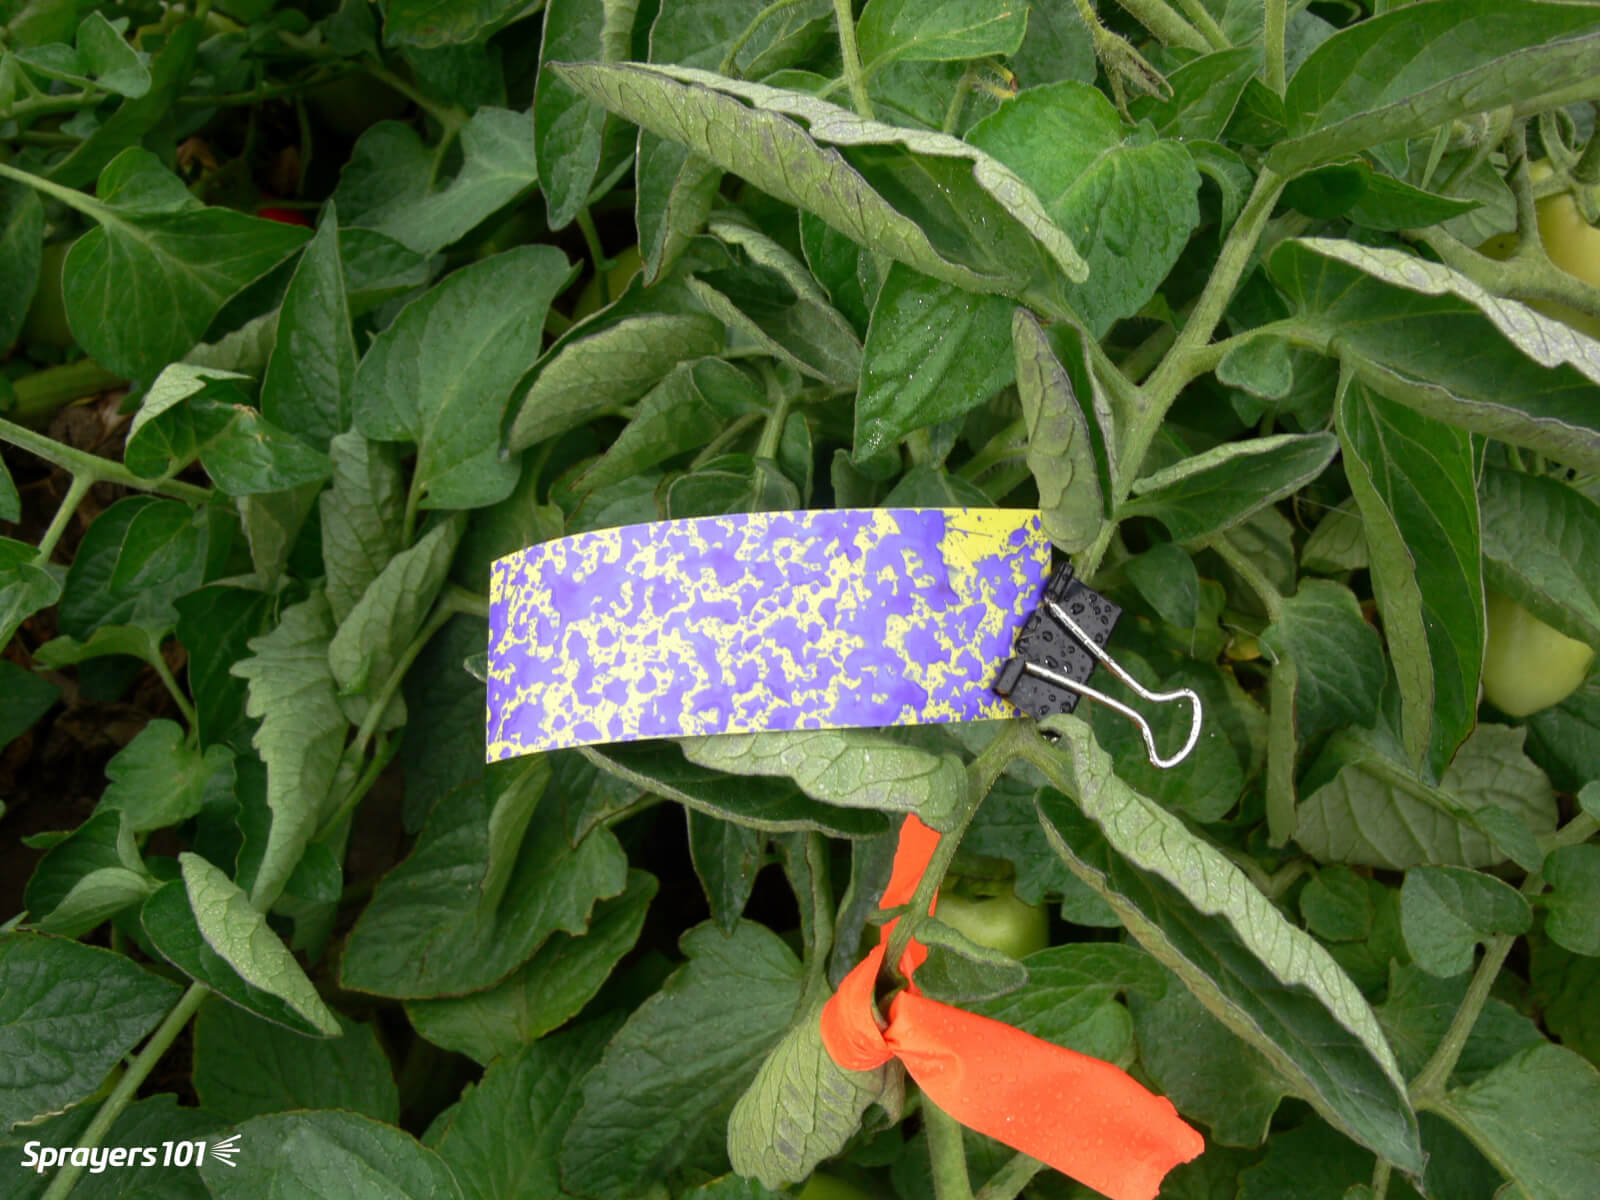
    In August, 2011 we worked in a market garden operation in Bolton comparing the spray coverage from four different nozzle configurations. We used the growers typical spray parameters: a travel speed of 4.5 km/h (2.8 mph), an operating pressure of about 4 bar (60 psi), a boom height of 45 cm (18 in) above the ground, and a sprayer output of 550 L/ha (~60 gpa). To monitor spray coverage, water sensitive paper was placed face-up in the middle of the tomato canopy. This diagnostic tool turns from yellow to blue when contacted by spray.
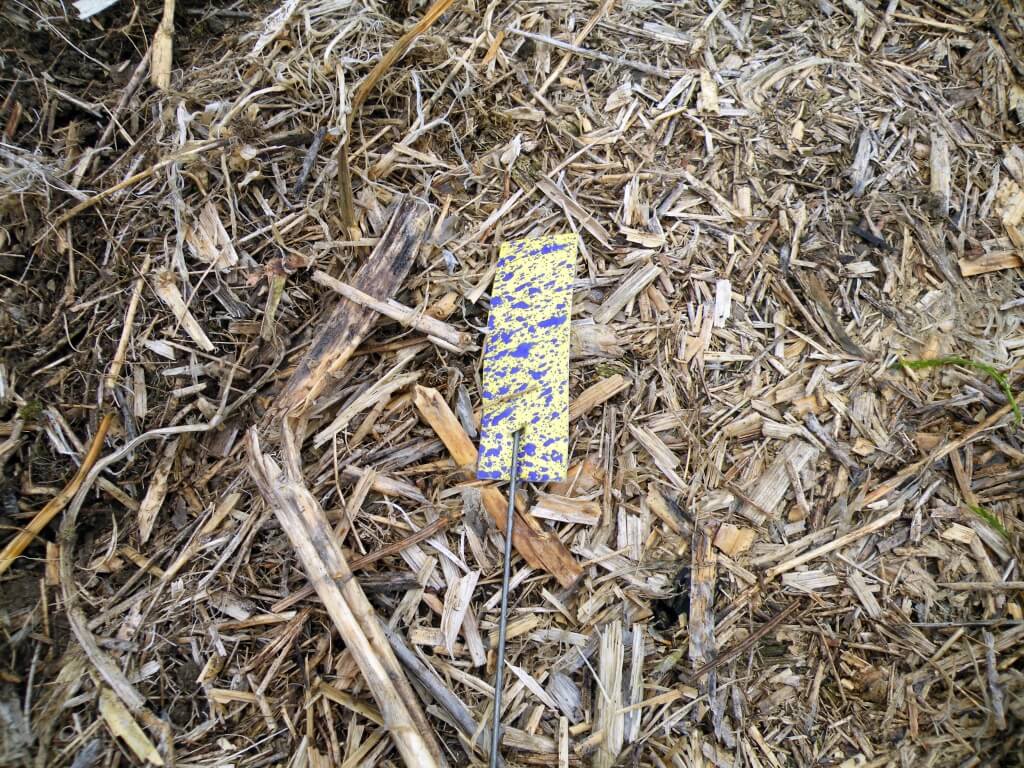
    Water-sensitive paper at top of tomato canopy - easy to hit.
    Water-sensitive paper at top of tomato canopy – easy to hit.

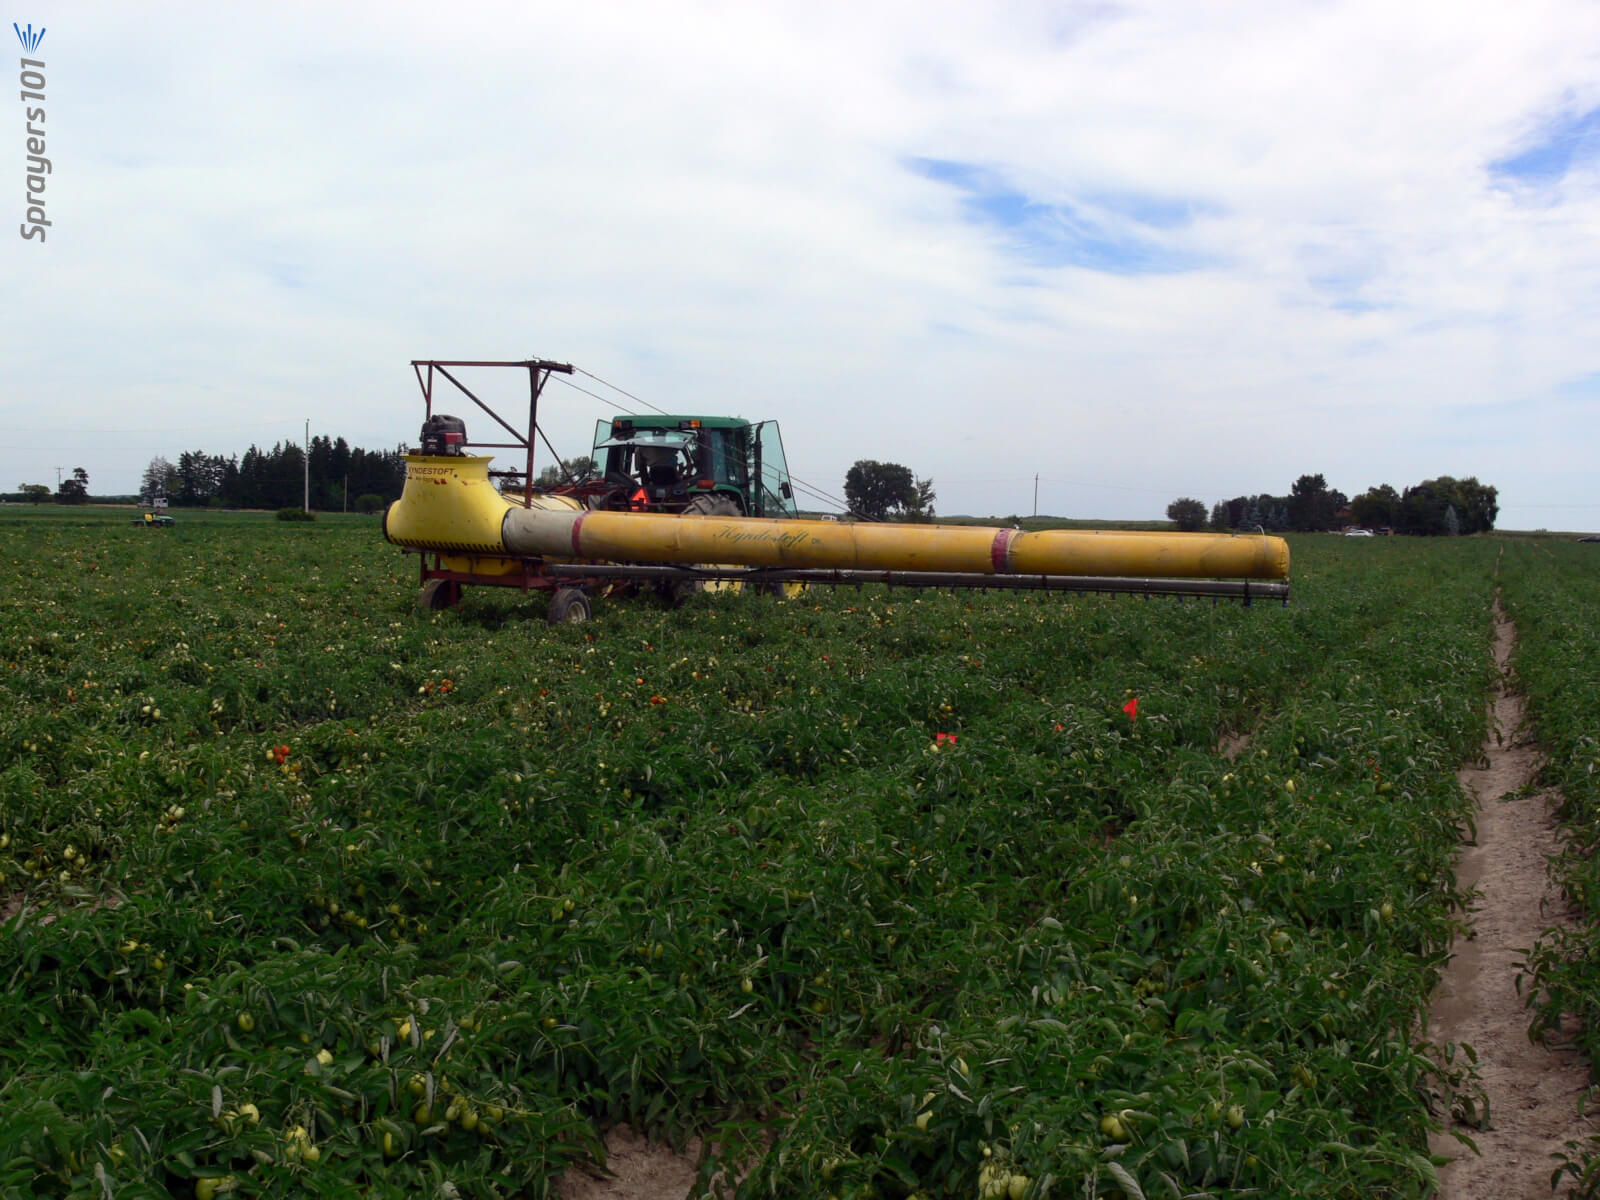
    This particular sprayer was equipped with an air assist sleeve that blew a curtain of air into the canopy at about 100 km/h (65 mph) as indicated by an air speed monitor placed at the air outlet. When properly adjusted, air-assist booms have a number of benefits:

    • They part the outer canopy giving spray access to the inner canopy.
    • They rustle leaves to expose all surfaces to spray.
    • They permit the use of smaller droplets, which are more numerous and adhere to vertical surfaces, by entraining them and reducing drift.
    • They extend the spray window by permitting the applicator to operate in slightly higher ambient wind speeds.
    Boom sprayer with air assist sleeve operating.
    Boom sprayer with air assist sleeve operating.

    We sprayed using the four different nozzle configurations, with and without air assist. Our goal was to make qualitative assessments (Good, Moderate, Poor), and here’s what we observed:

    Nozzle Type / Sprayer OutputWith Air AssistWithout Air Assist
    80 degree flat fans /~550 L/ha (60 g/ac)
    • Good coverage in upper canopy
    • Poor / Moderate canopy penetration
    • Low drift
    • Good coverage in upper canopy
    • Poor canopy penetration
    • Moderate drift
    80 degree air induction flat fans /~550 L/ha (60 g/ac)
    • Inconsistent upper canopy coverage
    • Poor canopy penetration
    • “No” drift
    • Inconsistent upper canopy coverage
    • Poor canopy penetration
    • “No”/Low drift
    TwinJet dual 80 degree flat fans /~550 L/ha (60 g/ac)
    • Good coverage in upper canopy
    • Poor / Moderate canopy penetration
    • Moderate Drift
    • Good coverage in upper canopy
    • Poor canopy penetration
    • Moderate/High drift
    Hollow cones /~750 L/ha (80 g/ac)
    • Good coverage in upper canopy
    • Moderate canopy penetration
    • Low drift
    • Good coverage in upper canopy
    • Poor canopy penetration
    • Very High drift

    The air induction nozzles performed poorly. Their Coarse/Very Coarse droplets impacted on the outer canopy, created run-off and resulted in very little canopy penetration. Medium droplets produced by twin fans and conventional flat fans were both inconsistent with inner-canopy coverage, but some advantage may have been observed with air assist. The TwinJets contributed to higher drift (likely because they were too high off the canopy) but otherwise produced coverage similar to the conventional flat fans. From these observations, the convention that spray shape (e.g. cone, fan, twin) has little or no impact on broadleaf canopy penetration holds true.
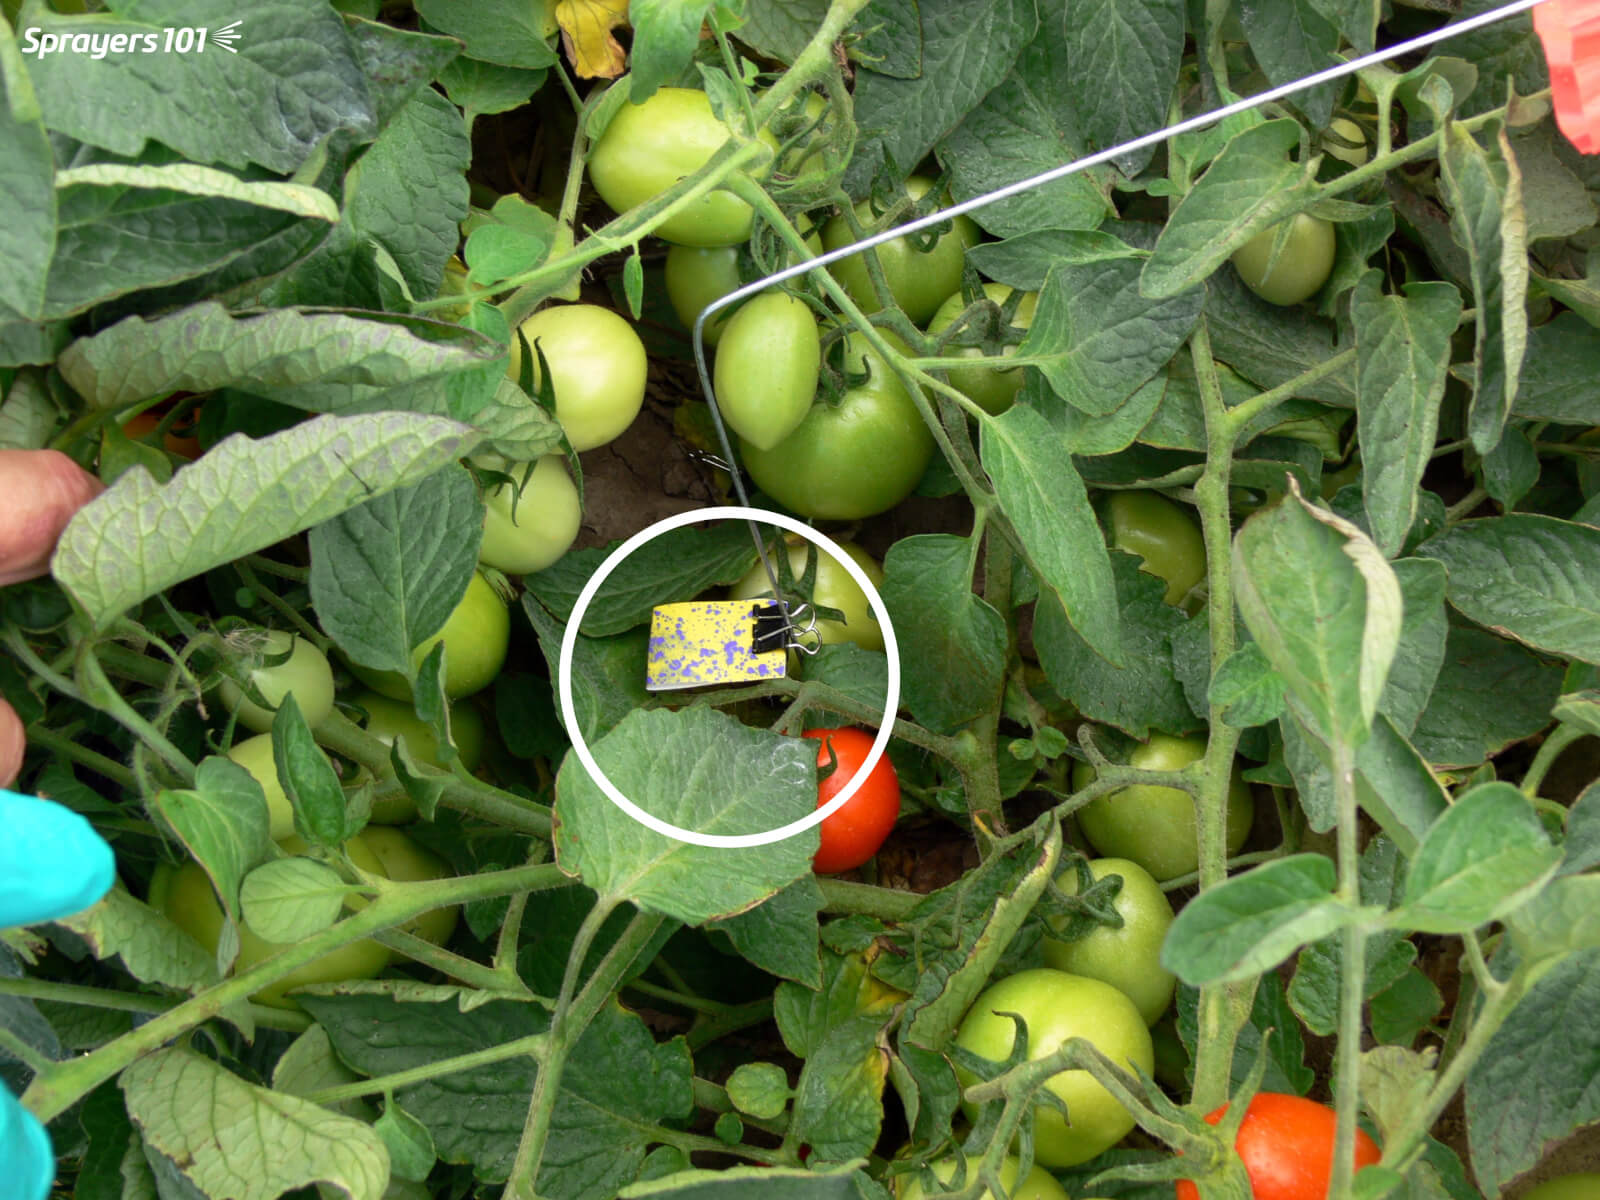
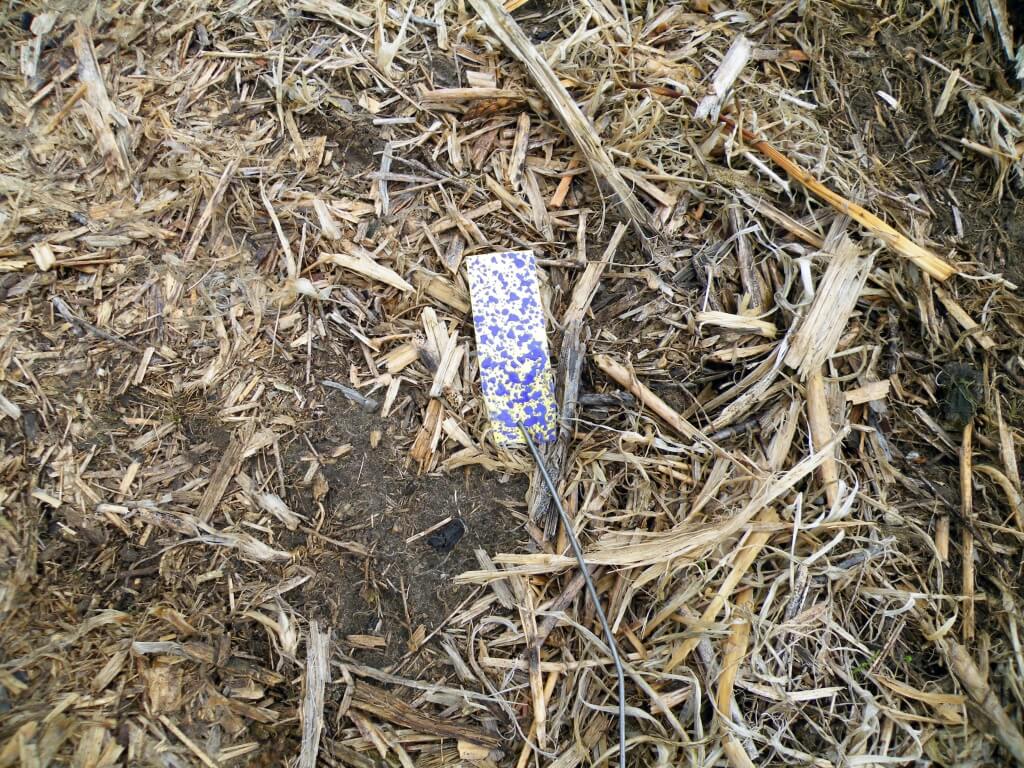
    Acceptable spray coverage deep in canopy (harder to hit) using hollow cone nozzles.
    Acceptable spray coverage deep in canopy (harder to hit) using hollow cone nozzles and air assist.

    After inspecting the papers deep in the canopy, we were surprised that air assist did not obviously improve canopy penetration. It did seem to help, but it wasn’t a slam-dunk. This may be because finer droplets (<50µm) are not easily seen on water sensitive paper. It might also be because we did not calibrate the air speed to the canopy: too little air and spray impacts on the outer canopy, while too much air forces leaves out of the way and spray is blown into the ground. It was obvious that drift was greatly reduced, so logically the spray had to have gone somewhere – we can only assume it entered the canopy.

    The best results were achieved with hollow cones and air assist. Theoretically, smaller droplets should improve the potential for coverage by sheer number, but they slow quickly and are easily blown off course. Winds were only about 5 km/h (3 mph) during the trials. Had they been higher, the no-air-assist condition would have resulted in poorer canopy coverage. While we feel the air assist improved inner canopy coverage, we attribute much of the performance to the spray volume of 750 L/ha (80 gpa), which was significantly higher than we used with the other nozzles. When we attempted lower volumes using the hollow cones (not shown) the inner canopy coverage was greatly compromised. Higher volumes are a demonstrated means for improving canopy penetration, so this observation is consistent with what was expected.

    The 2011 trial suggested that hollow cone tips used with high volume and air assist, improved canopy coverage and penetration. They are, however, very prone to drift and their use is not recommended without an air assist sleeve to counter the spray drift. Spray volumes over 500 L/ha are highly recommended.

    Study 2 – Quantitative Observations

    In July, 2016 we ran another study in Chatham-Kent. This operation was concerned about spray drift and recently changed from Hardi hollow cones on 25 cm (10″) centres to TeeJet Turbo TwinJets on 50 cm (20″) centres. They wanted to know if they had improved their coverage. We decided to test four nozzles at similar driving speeds and volumes.

    Once again, we used water-sensitive paper. This time we placed two pieces back-to-back (face up and face down) about 1/3 down into the canopy. Then we placed two more in the same orientation about 2/3 down into the canopy. We did this for three plants for each pass. The next four images show the visual drift and weather conditions for each nozzle. Note that only one boom section was nozzled (indicated by a white line) in each condition.

    Condition 1 – Turbo TwinJet (Coarse Spray Quality)
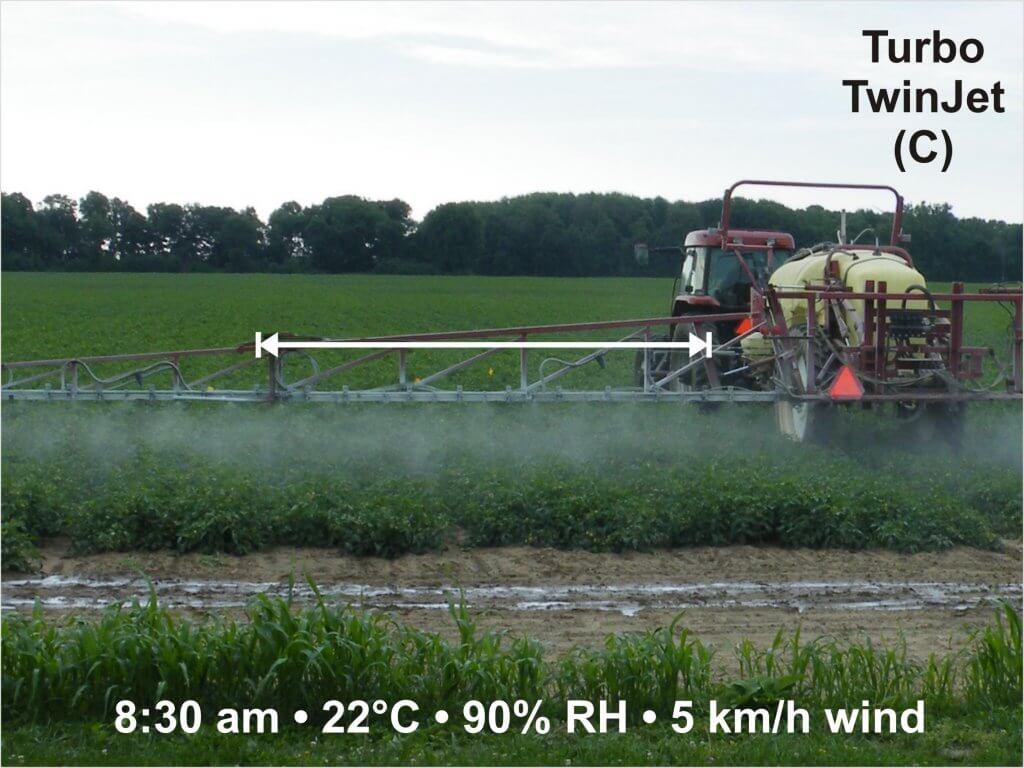
    2016_Tomato_Sprayers_TTJ

    Condition 2 – Hollow Cones (10″ centres – Fine/Medium Spray Quality)
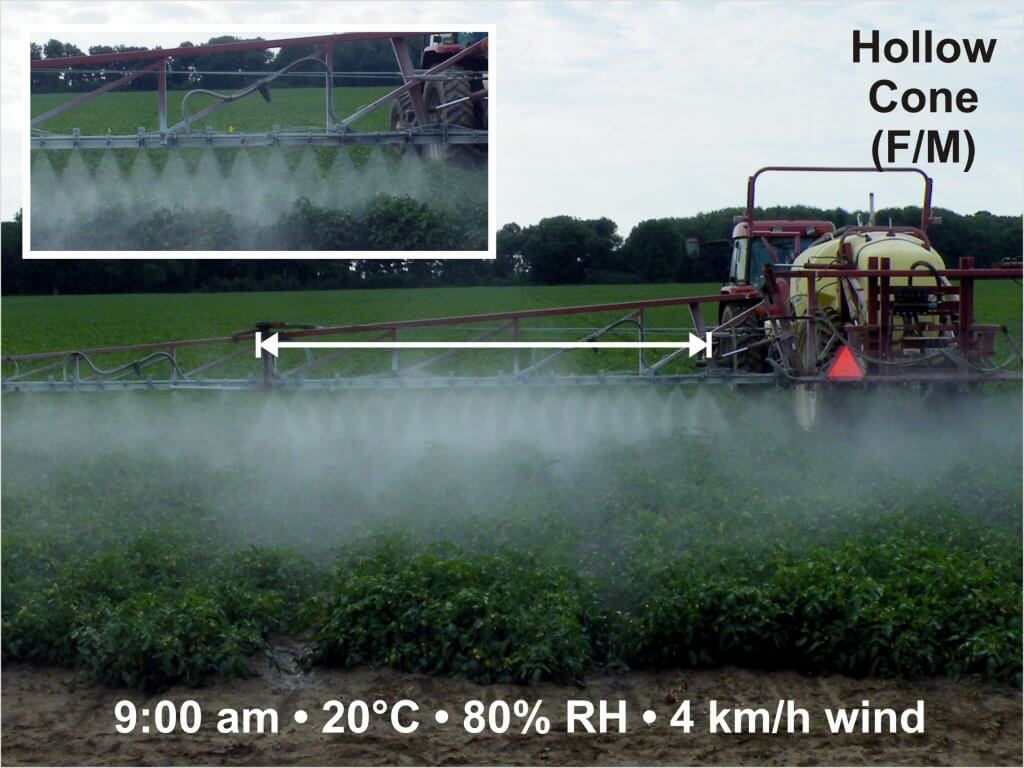
    2016_Tomato_Sprayers_hollowcone

    Condition 3 – XR 110° FlatFan (Fine Spray Quality)
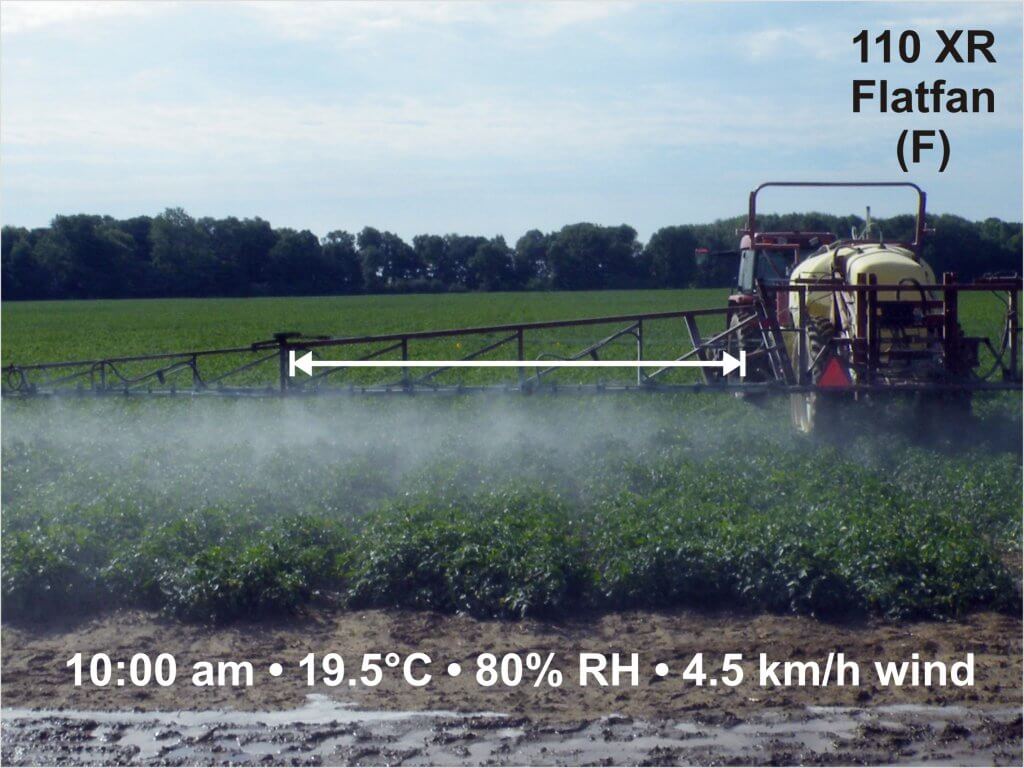
    2016_Tomato_Sprayers_XR

    Condition 4 – TeeJet 3070 (Coarse Spray Quality)
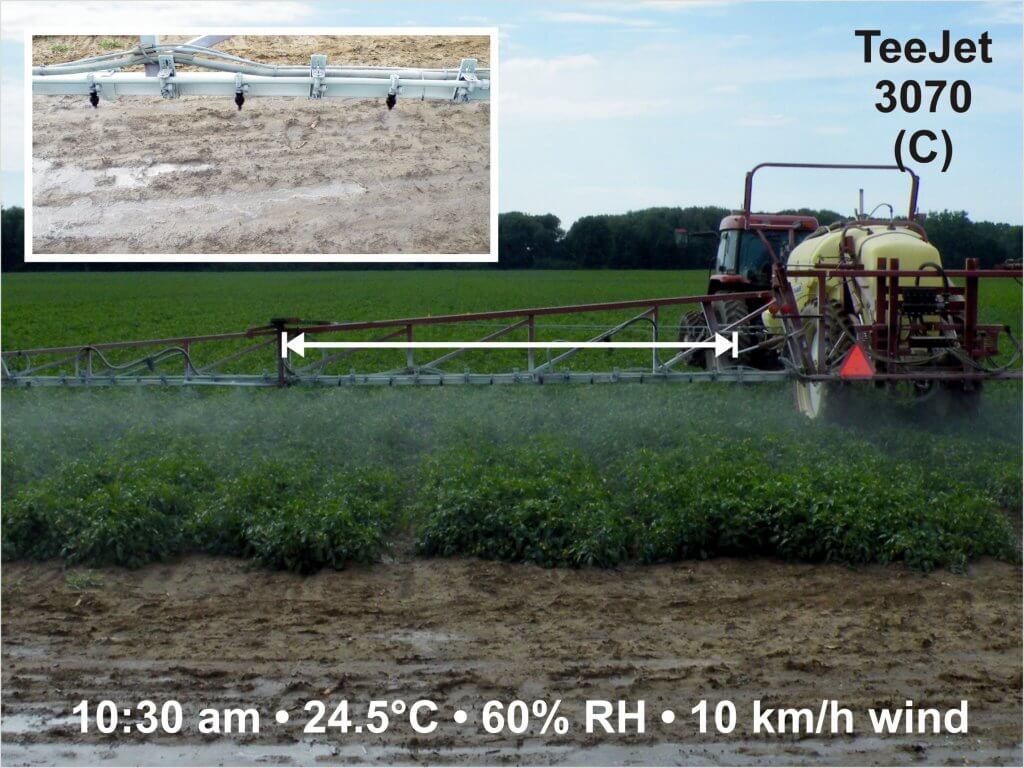
    2016_Tomato_Sprayers_3070

    It was very humid, making it difficult to place and retrieve the papers without smearing them. This made it tricky to discern differences in coverage, and the blurring prevented us from quantifying droplet density (i.e. number of drops per unit area). Nevertheless, papers were scanned and the percent coverage was calculated using the DepositScan software developed by the USDA’s Dr. Heping Zhu. The average percent-coverage (± S.E. n=3) is shown in the image below.
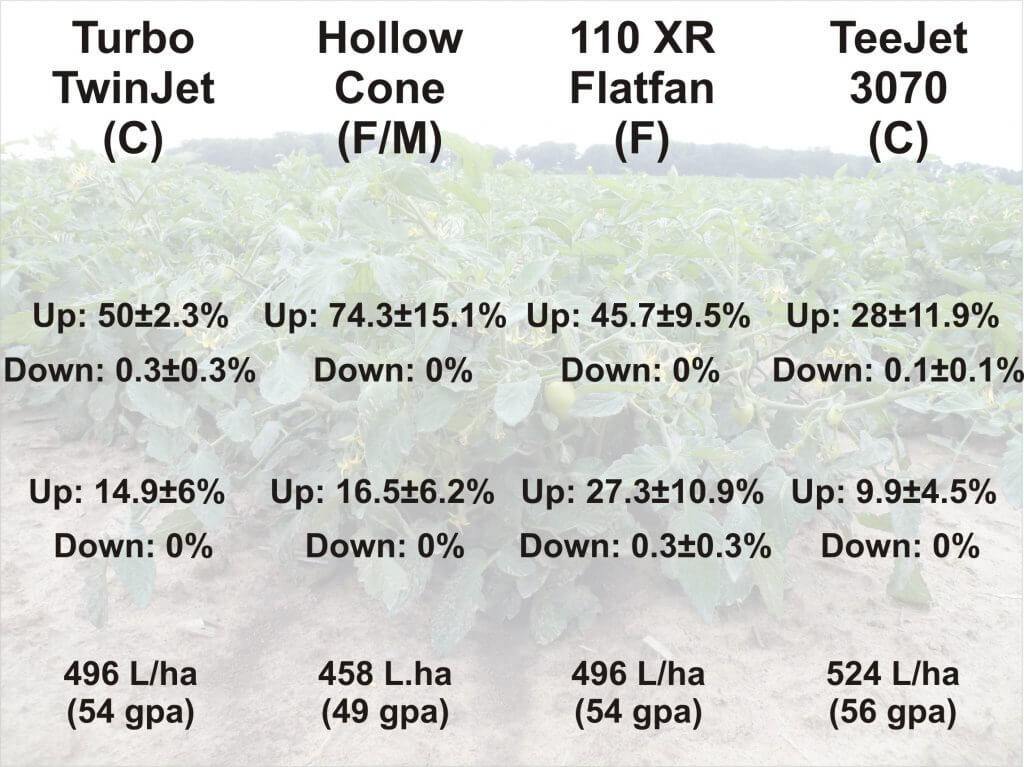
    2016_Tomato_Sprayers_Coverage

    Coverage on the upward-facing papers in the upper portion of the canopy showed excessive coverage for all nozzles but the 3070. Little or no coverage was detected on the downward-facing cards, but without air-assist or a directed application (e.g. drop arms), this was expected. It’s the deeper canopy that’s of particular interest. The only significant difference may lie in the XR flat fan which showed more coverage on the upward facing papers and some (however little) on the downward facing papers.

    This came as something of a surprise given that the XR produced a Fine spray quality and there was no air assist to guide spray into the canopy. I believe the high humidity and low winds played a role in this outcome by reducing evaporation and off-target drift. On a drier, windier day, we likely would not have seen this level of inner canopy coverage for either the XR or the hollow cone. By comparison, the Turbo TwinJet with its Coarse spray quality not only reduces off target drift, but would be more resilient in drier and windier weather and may very well have produced the best coverage by comparison.

    Take Home

    Drawing from both studies:

    • Properly calibrated air assist will reduce drift and has promise to improve canopy penetration/coverage.
    • Spray shape (e.g. twin, hollow cone, flat fan) does not seem to play a role in canopy penetration.
    • Spray quality larger than Coarse may negatively impact canopy penetration in tomato.
    • Coarse spray quality is perhaps the most versatile option when volume is sufficient (>500 L/ha).
    • Fine-Medium spray quality is only a viable option in high humidity and light winds. However, air assist is critical to counter drift, and high spray volumes (>500 L/ha) are still required despite the higher droplet count.
    • Underleaf coverage is exceedingly difficult to achieve, even with finer spray quality and air assist.
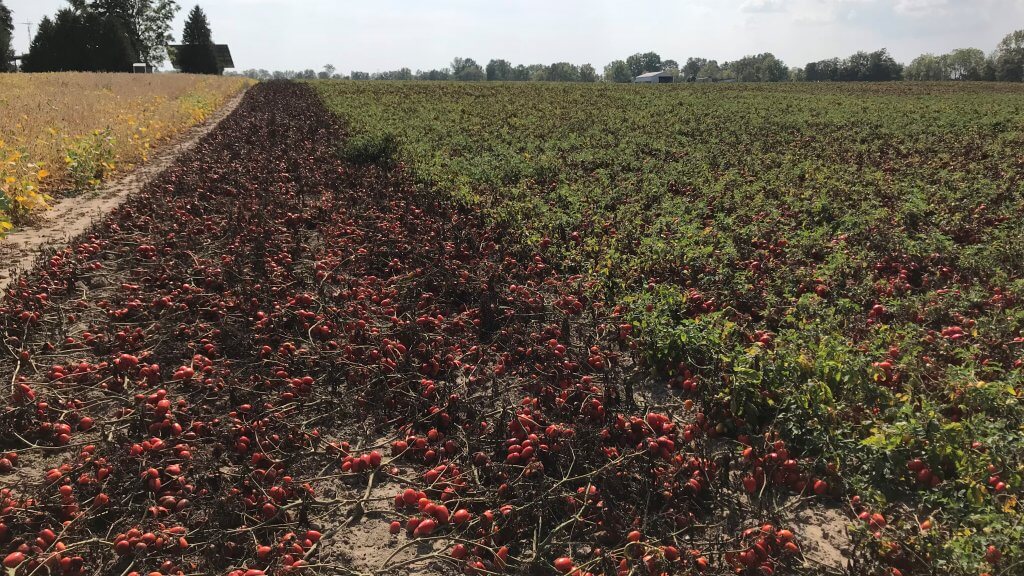
    This occurred in Ontario (date and location withheld). The sprayer missed the outer edge of the tomato field during a late blight application. An unintentional field check, and amazing to see the results.
  • Herbicides in Asparagus – A creative solution

    Herbicides in Asparagus – A creative solution

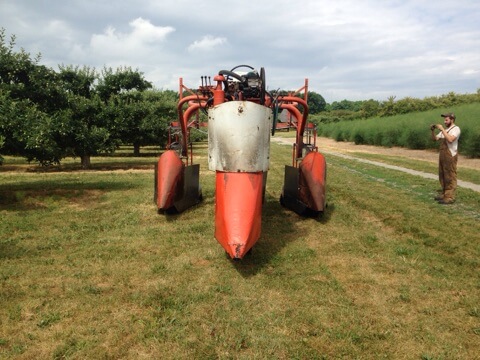
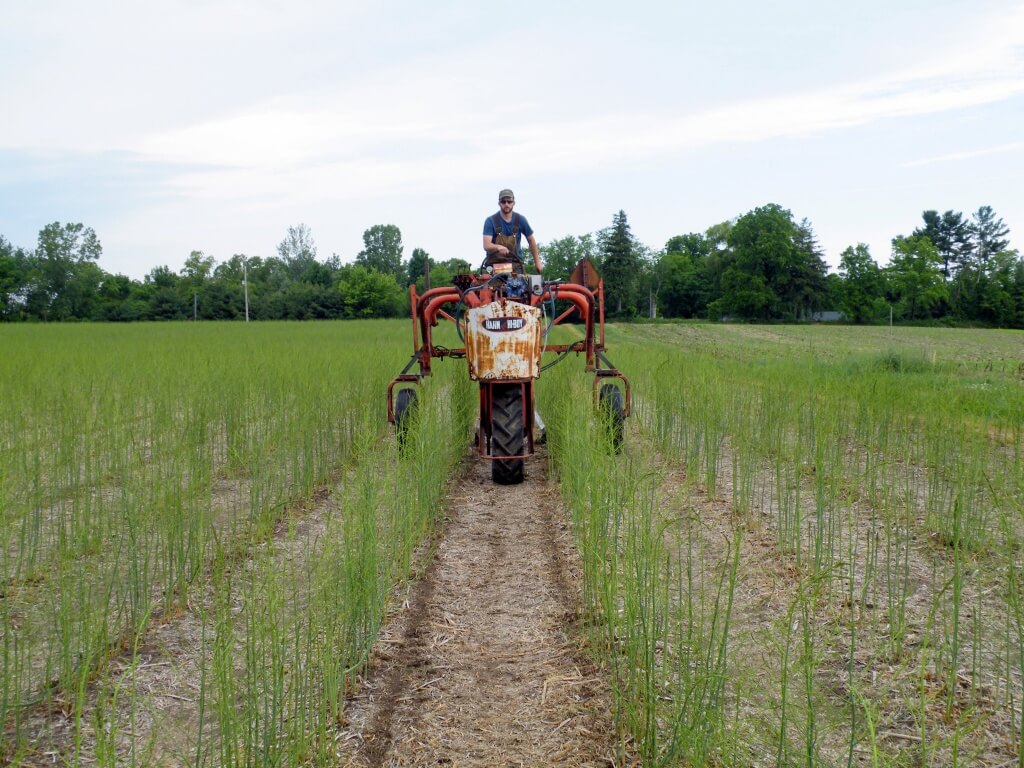
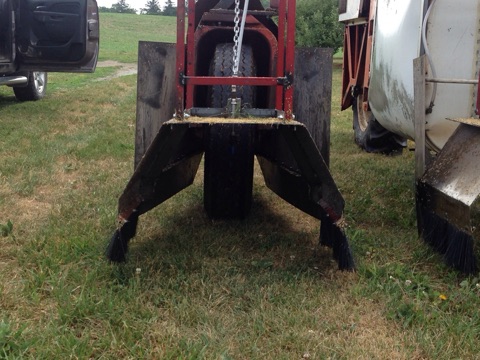
    In 2016, an asparagus grower in southern Ontario picked up a used De Cloet Hi-Boy originally used to spray tobacco. His vision was to create a three-row herbicide sprayer for asparagus and we were invited to participate. His concept was to design shrouds that would contain the herbicide, but not snag the asparagus or drag heavily on the ground. This article follows the development of the sprayer from concept to testing to final product.
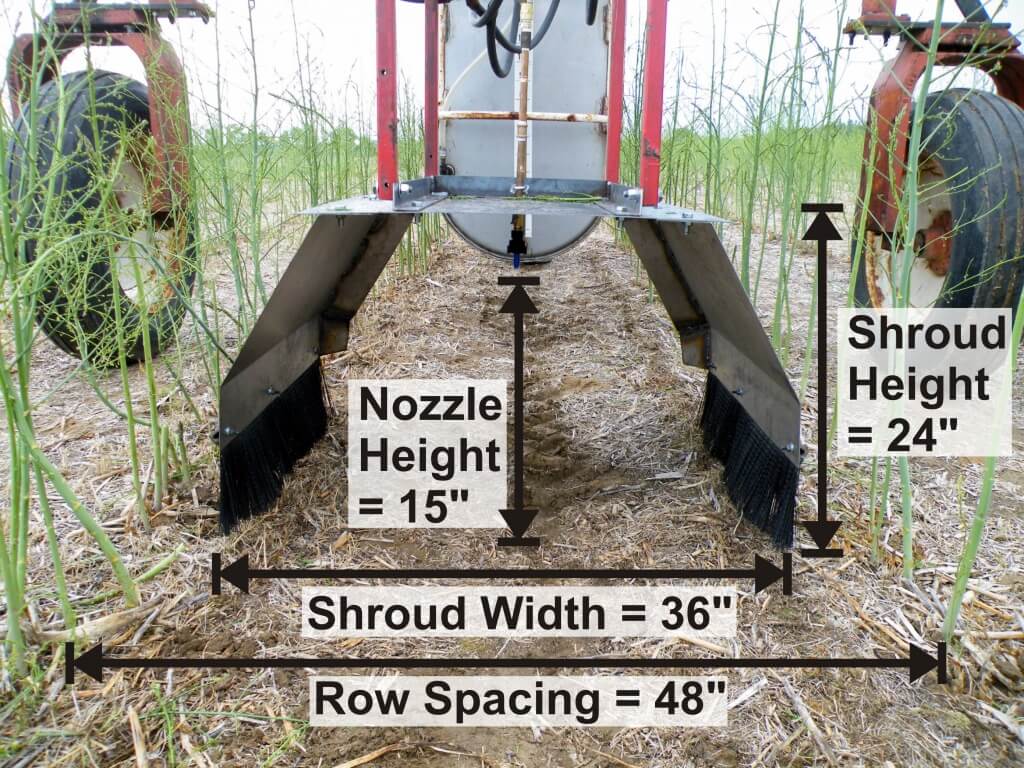
    The sprayer itself was a classic three-wheel, self-propelled affair. The asparagus was planted on four foot centres, leaving a three foot alley. While the goal was to hang three shrouds off the boom, we started with one to work out the bugs.
    DSCF3362

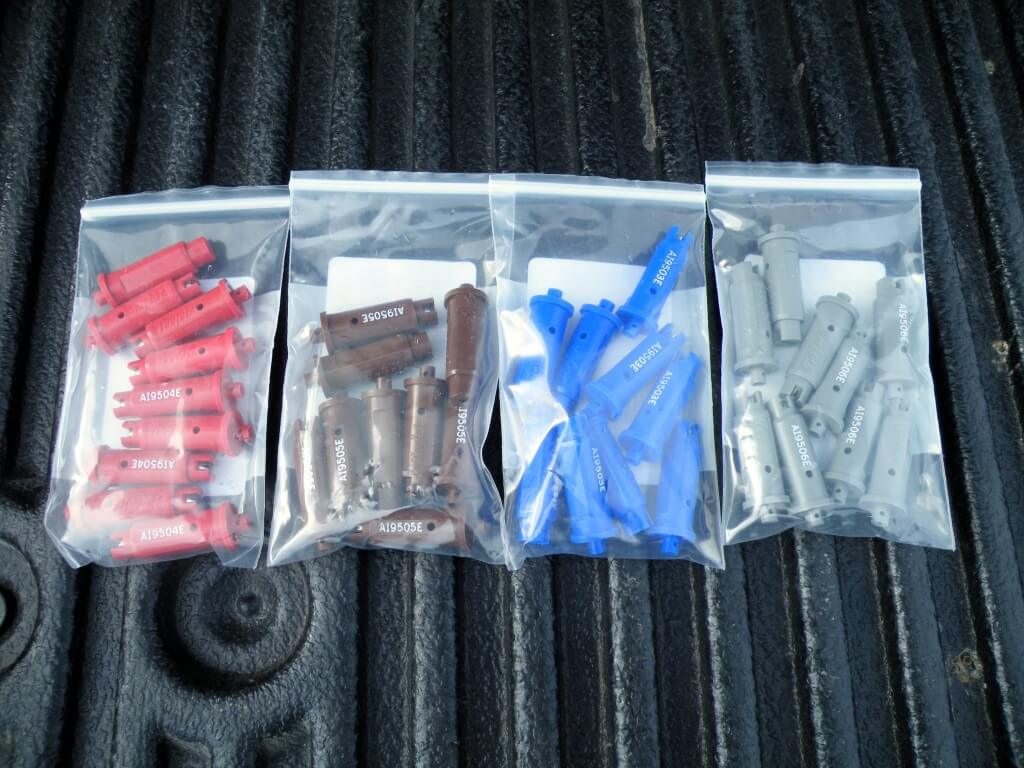
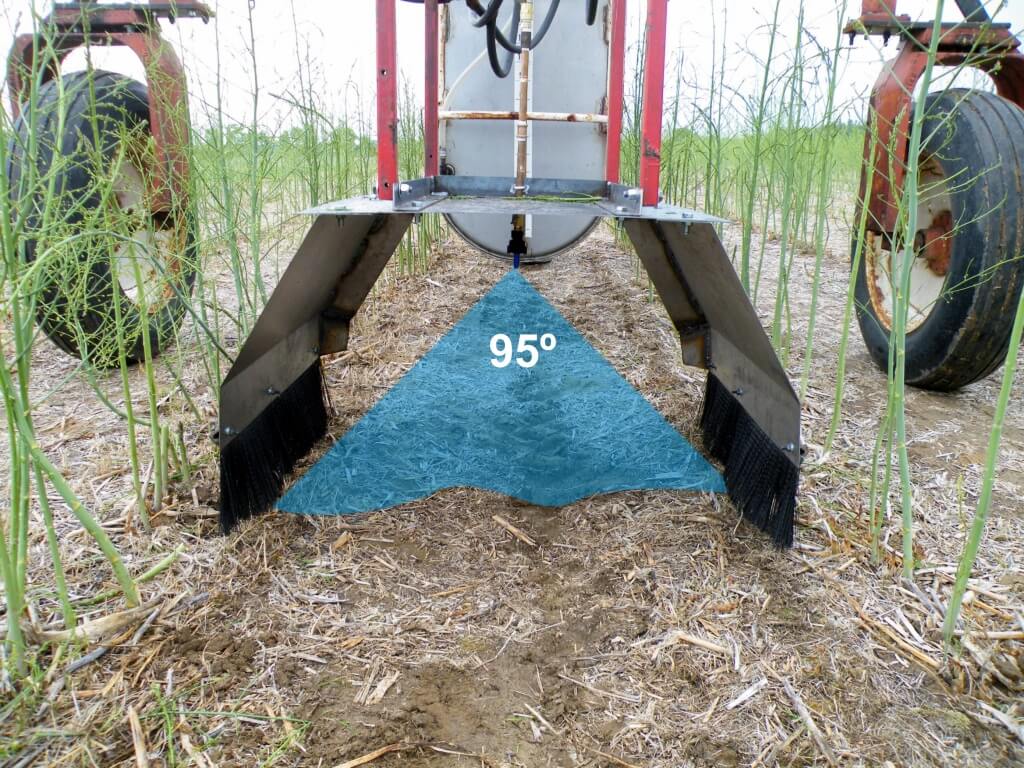
    This operation uses 2,4-D to control weeds in the alleys and while a little can hit the asparagus stem up to 12 inches (where the branching starts), we wanted to avoid contact at all costs. That led us to the TeeJet AI 95° flat fan nozzle, which produces a Very Coarse to Extremely Coarse spray quality. A single nozzle could be suspended to span the 3 foot width of the alley.

    DSCF3355
    2016_Asparagus_Herb_Shroud_2

    The first version of the shroud was suspended off the boom from four anchorage points. A certain amount of of play was allowed so the shroud would find plumb (i.e. hang vertically), even when the sprayer boom yawed or pitched over uneven ground.

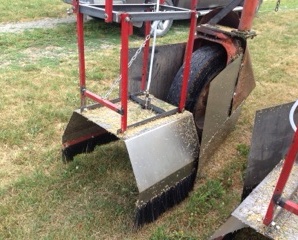
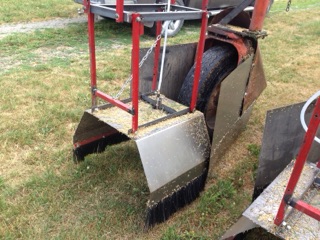
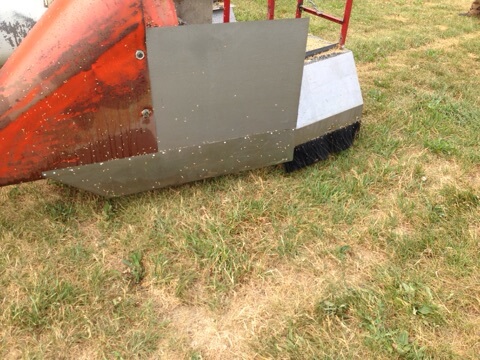
    The shroud was constructed of sheet metal, angled to reduce the potential for contact with the asparagus branches, and terminated in stiff, nylon brush-style mud flaps commonly seen on trucks. These brushes were cut to a few inches in length to span the distance between the side of the shroud and the ground. This would create a “seal” to prevent spray from escaping, maintaining some degree of contact with uneven ground.

    2016_Asparagus_Herb_Shroud_1

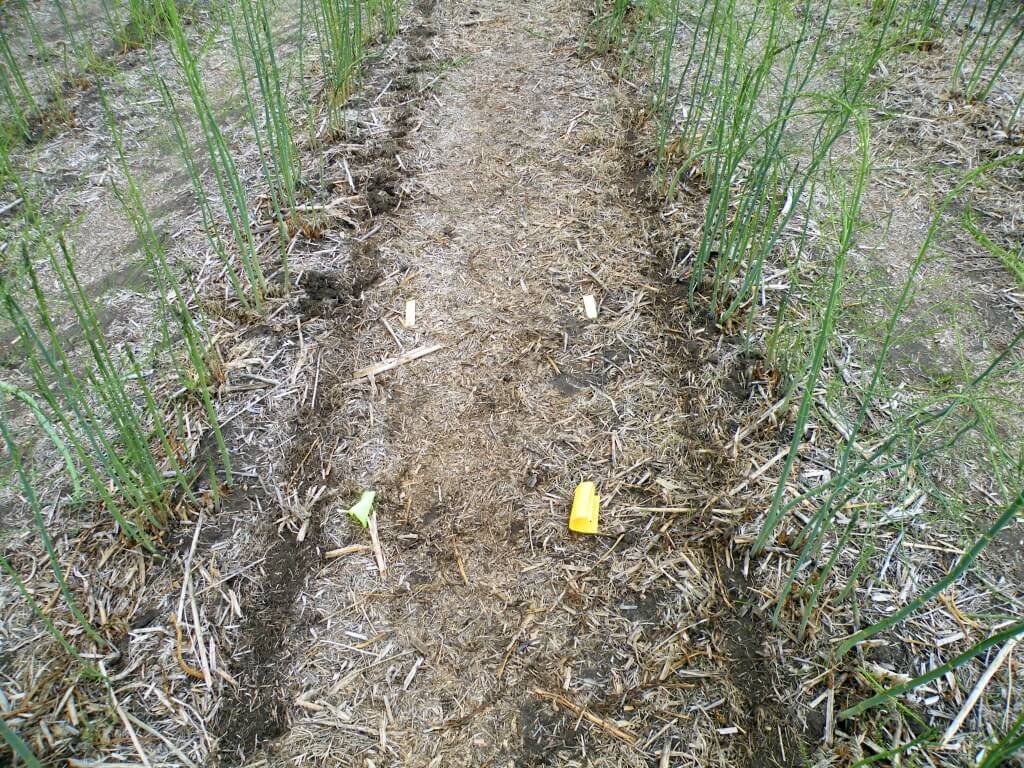
    We tested the first version by placing water sensitive paper in two positions on the ground, just inside the reach of the brushes. We had to be careful not to run them over with the centre wheel of the sprayer. We also adhered two papers to the angled inner walls to see how much, if any, spray was hitting the inside of the shroud.

    Our first pass on June 16th was at 9:00 am, 19.1 ºC (66.4 ºF) with a cross wind of 5 to 7 km/h (3.1 – 4.3 mph). relative humidity was high at 85% and travel speed was slow at 3.2 km/h (2 mph). We started with the .06 AI tip at 50 psi, but we drenched all the targets with excessive coverage because we were travelling so slow. We also found the stiff brushes were creating furrows in the soil, as shown below.

    DSCF3360

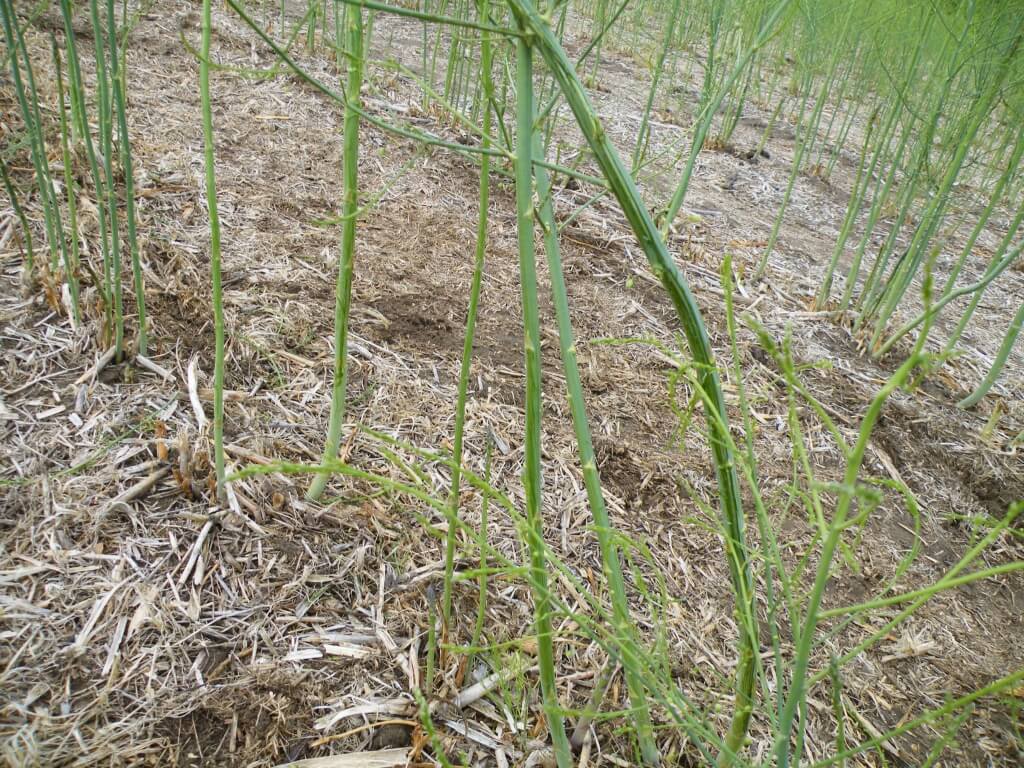
    For our second pass, we tried the .04 tip and raised the shroud while dropping the tip to keep it suspended 15 inches over the ground. We were still drenching the targets and noticed the shroud was hitting the asparagus spears, causing physical damage. The damage is shown below – note the dark green on the bent spear.

    DSCF3359

    This led to a decision to flare the side walls more aggressively, bringing them further into the centre of the alley and away from the spears (shown later in the article). This had the added benefit of angling the brushes as well to get a maximum span for weed control in the alley. For the final coverage pass we used the AI .03 tip, which gave more than 45% coverage on the ground, with even distribution, and there was no indication of spray on the papers adhered to the inside of the shroud. This coverage is more than is likely required, and the operator should be able to spray up to 6.5 km/h (4 mph) without compromising coverage.

    DSCF3364
    DSCF3365

    Since the coverage tests, the grower added additional sheet metal fenders to the the existing fenders, encasing the wheels and creating a smooth transition for the shroud to gently deflect the asparagus. The fenders were needed because the grower found the asparagus was being pushed out by the wheel fender only to bounce back in front of the shroud, which snagged the fern and damaged it. The additional fenders keep the fern spread and prevent it getting caught in front of the shrouds.

    2016_Asparagus_Hood_v2_3
    2016_Asparagus_Hood_v2_1
    2016_Asparagus_Hood_v2_2

    The grower was very happy with the sprayer’s performance and planed to build another. Why be satisfied with the status quo when you can tap into your creative side and be innovative? If you don’t think you’re imaginative enough to try upgrading equipment on your farm, here’s a simple test to prove that it’s in you. It’s easy to see the bird in the image below, but with a little concentration you’ll be rewarded with a ski-jumping rabbit.

    2016_Rabbit_Bird

    Thanks to TeeJet for donating the nozzles and water-sensitive paper and to Ray and Brad Vogel of Lingwood Farms for inviting me to participate.

    Learn more about spraying asparagus here.

  • Drop Hoses Improve Coverage in Field Peppers

    Drop Hoses Improve Coverage in Field Peppers

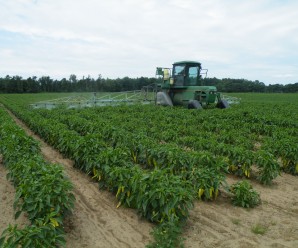
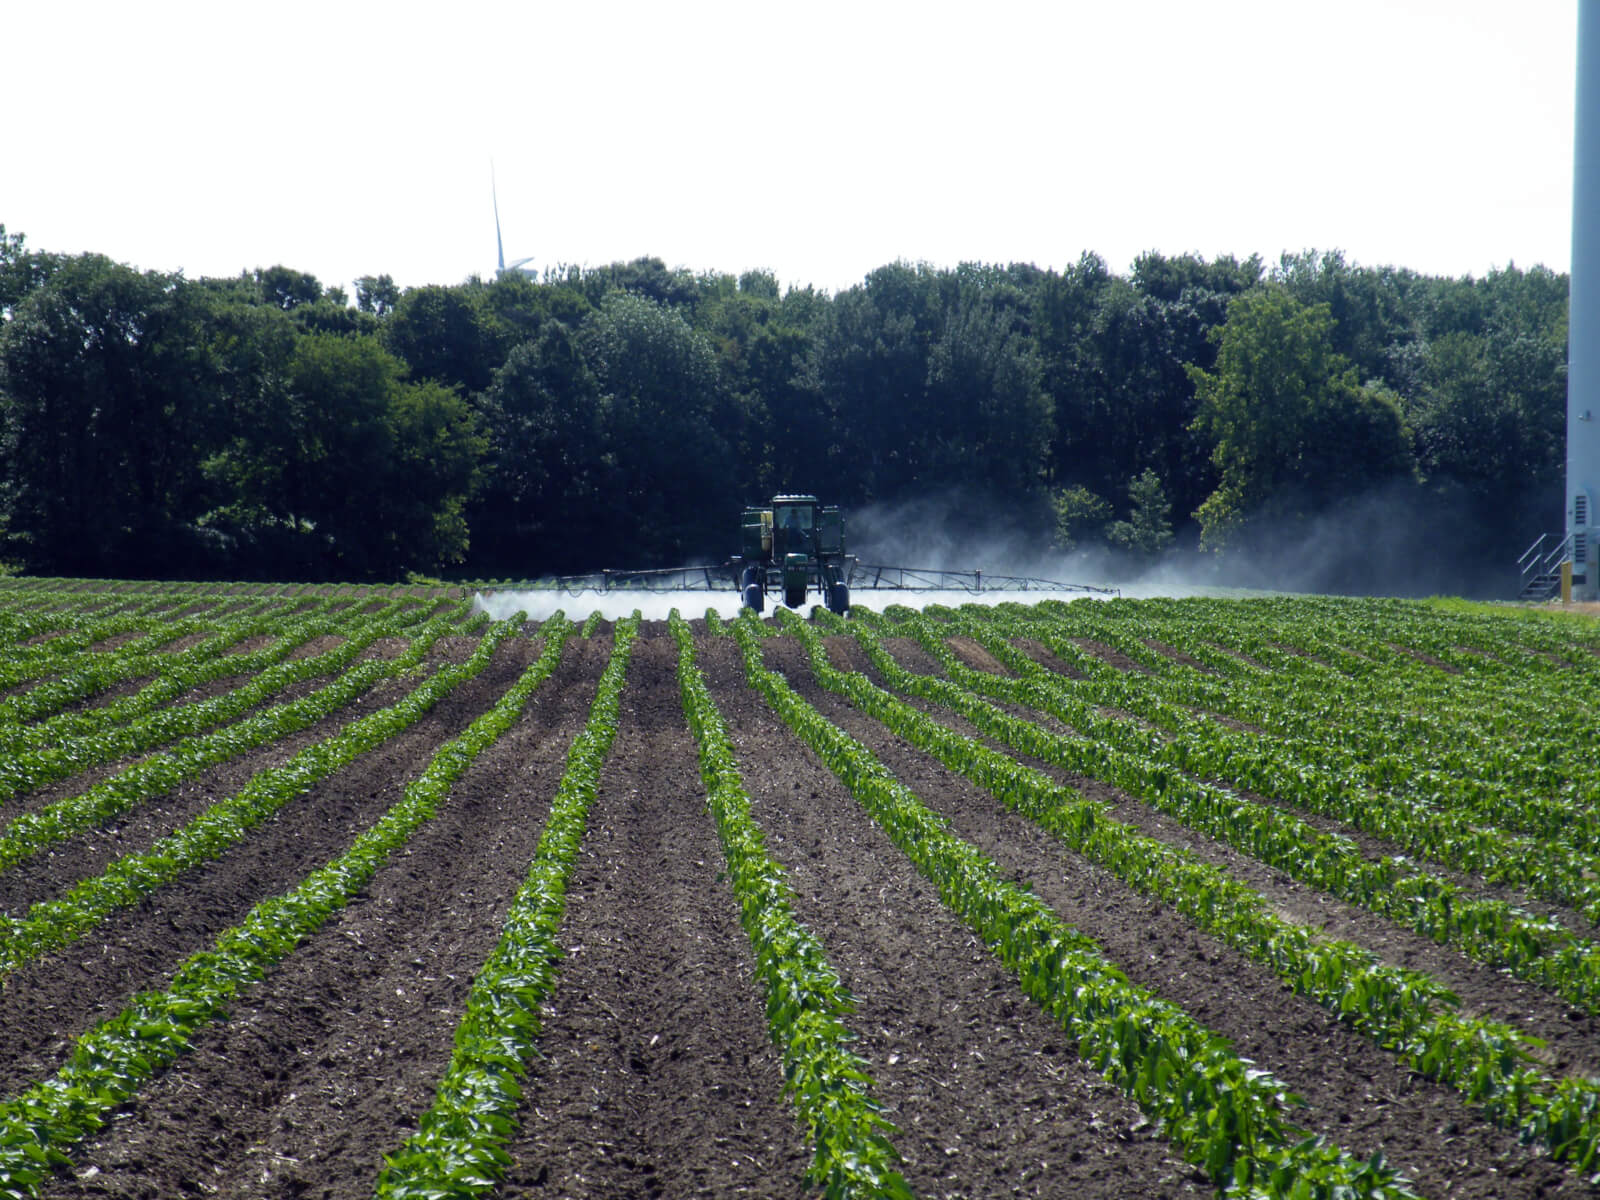
    In early July 2016, a farm supplier contacted us on behalf of a client with a history of disease control issues in his field pepper operation. He wanted us to calibrate their sprayer and diagnose spray coverage to see if there was room for improvement. Improved coverage doesn’t necessarily mean improved efficacy, but generally it’s a reliable indicator. When we arrived at the field the winds were gusting over 15 km/h, which had the potential to create a massive drift issue. We were only spraying water, so it was decided that if we managed decent coverage in those conditions, there would be no need to worry on an acceptable spray day.

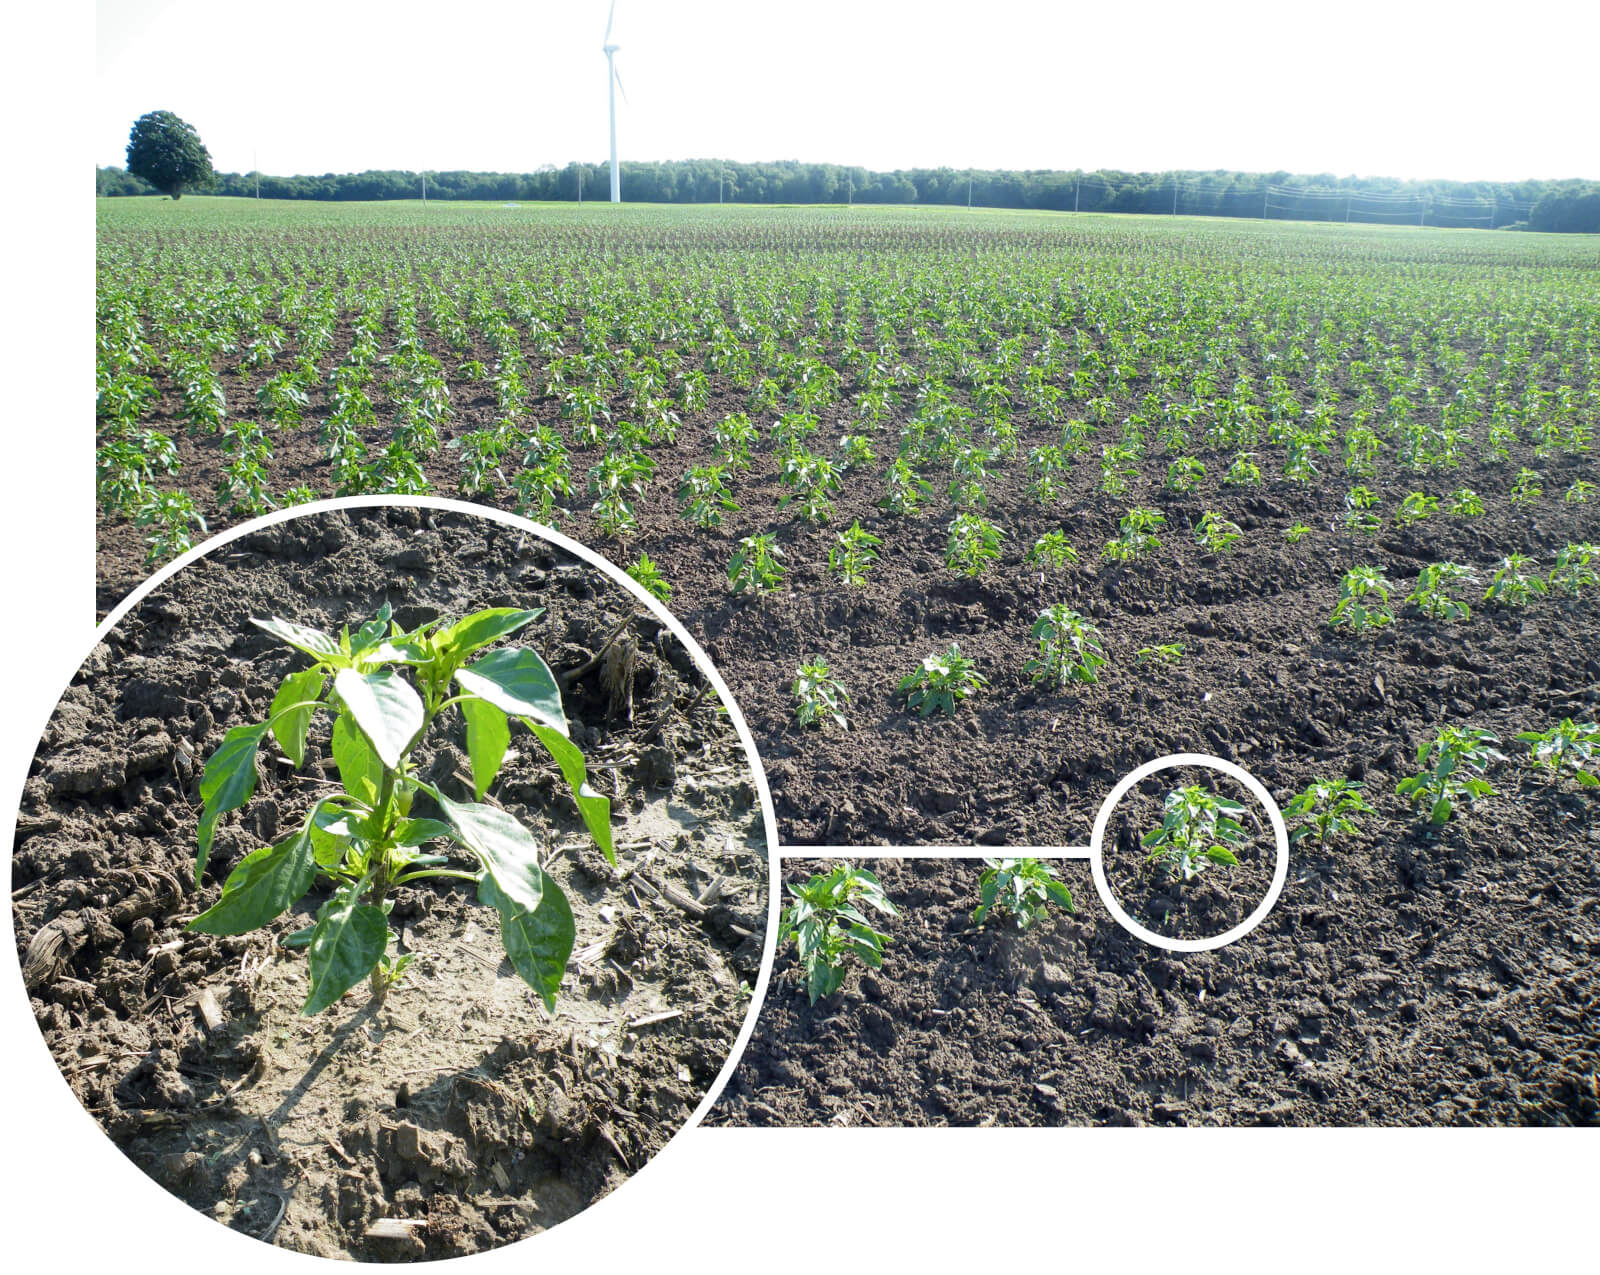
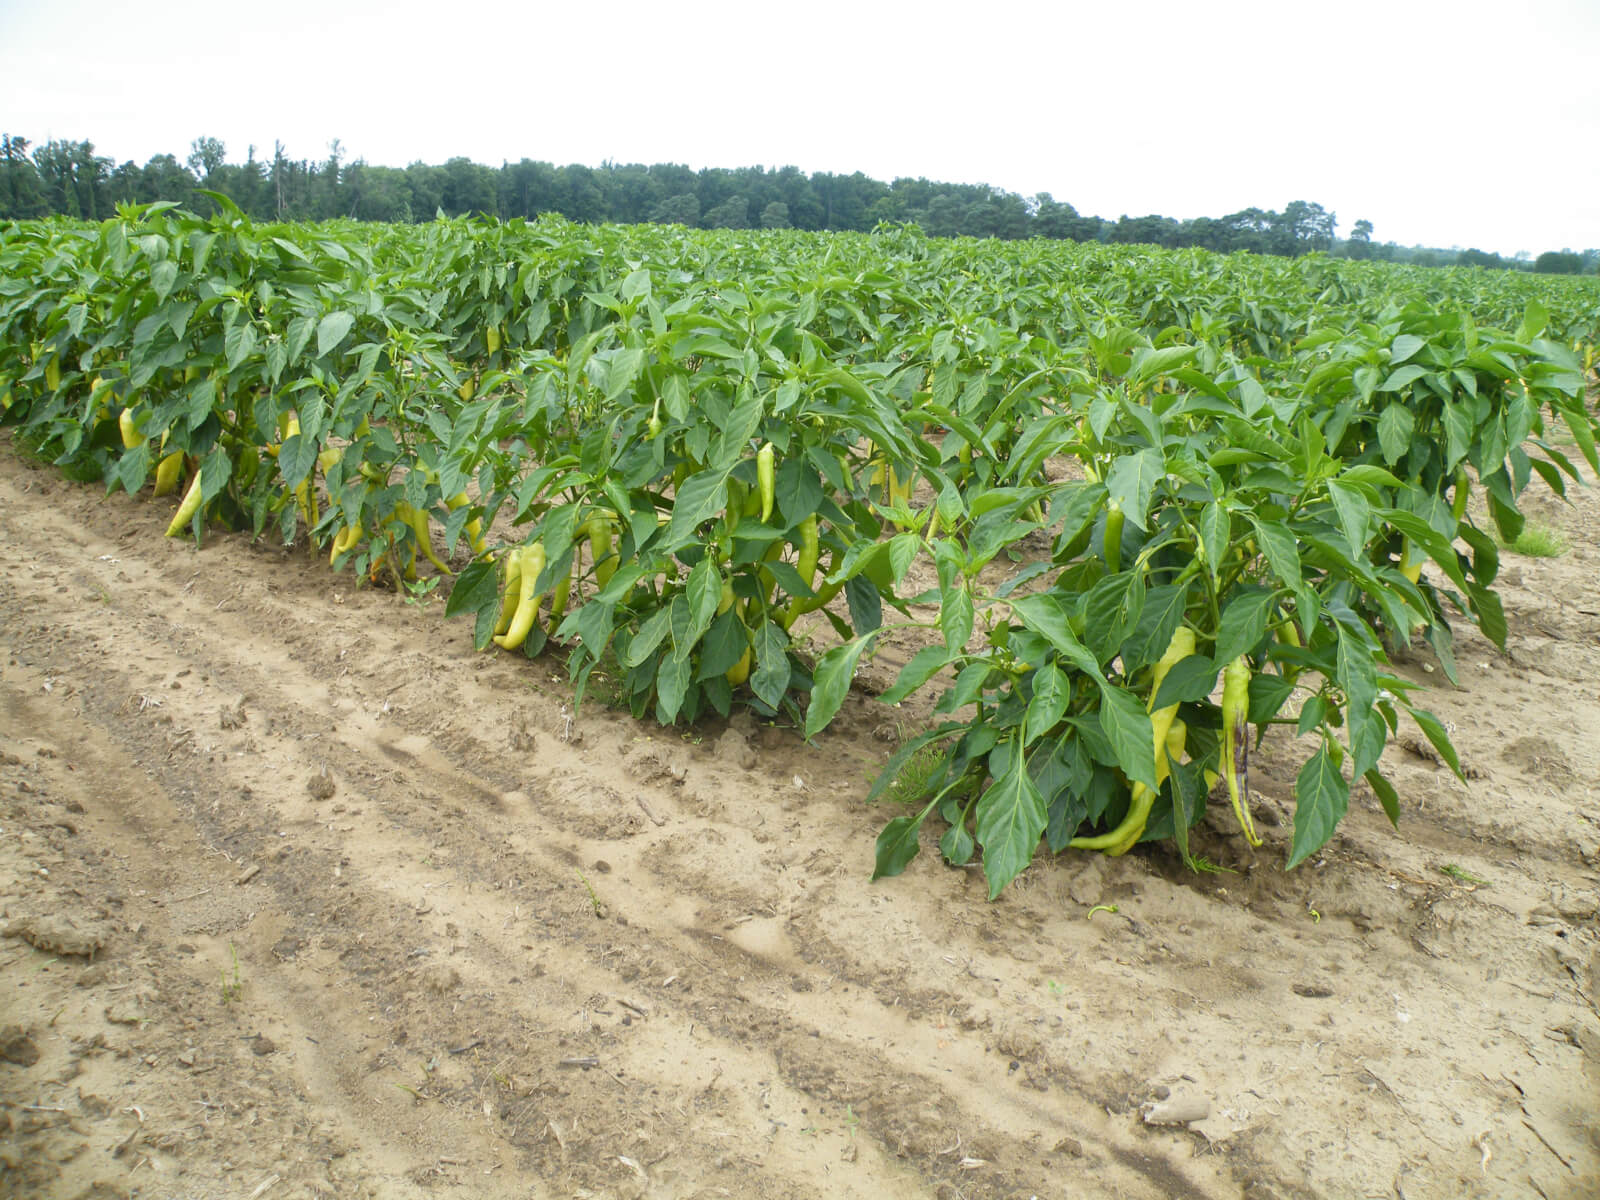
    Field pepper in Southern Ontario in mid-July
    Field pepper in Southern Ontario in mid-July

    The grower traditionally ran two different settings on his sprayer. They were relatively low volumes for a vegetable operation, but the crop was still small at this stage, so we did not propose raising the volume:

    1. TeeJet AITX 11008’s on 50 cm (20″) centres at 11.25 kmh (7 mph) and 3.44 bar (50 psi). That’s 3.35 L/min (0.89 gpm) per nozzle for a total rate of 350 L/ha (37.5 gpa).
    2. TeeJet ConeJet TXVK18’s on 50 cm (20″) centres at 7 kmh (4.5 mph) and 3.44 bar (80 psi). That’s 1.6 L/min (0.42 gpm) per nozzle for a total rate of 275 L/ha (29.5 gpa).

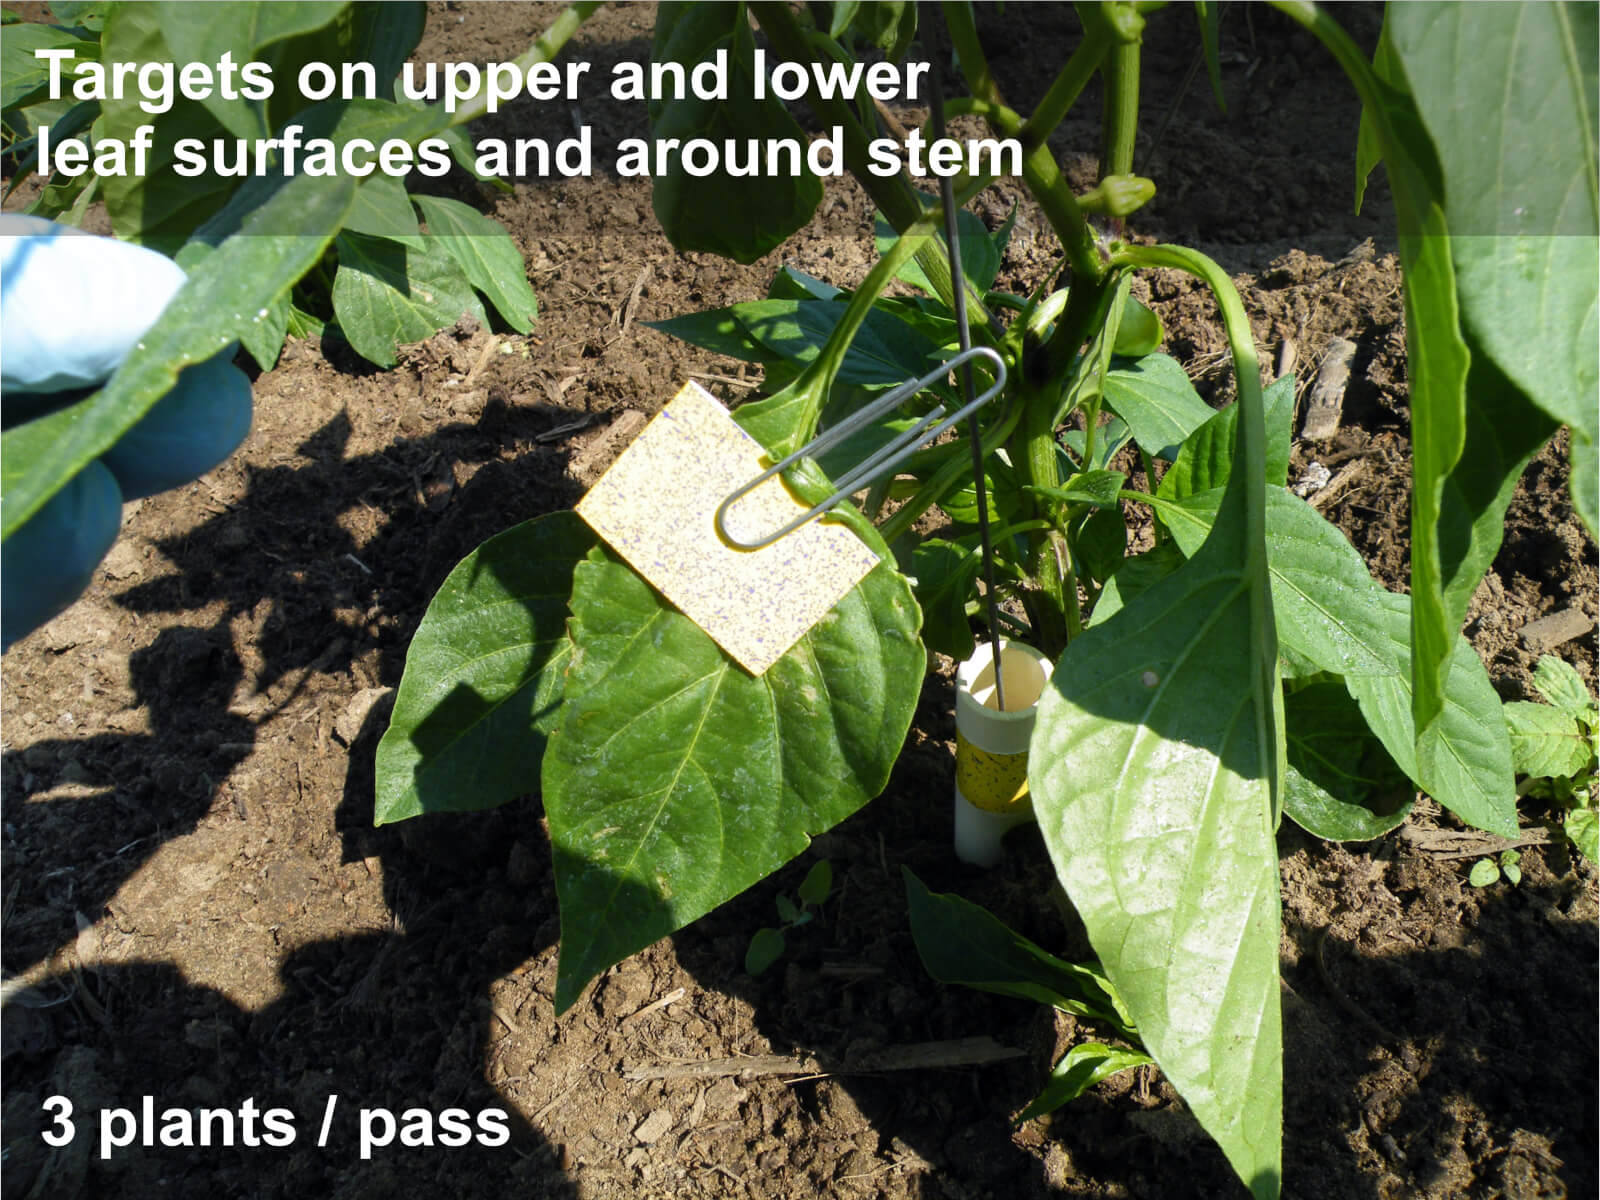
    To test the coverage with these settings, we folded a piece of water-sensitive paper over a leaf to cover both surfaces, and wrapped one around a hollow tube to mimic a plant stem (see figure). Three plants were papered for each sprayer pass. Papers were collected, digitized and analysed for percent-coverage and droplet density. When diagnosing coverage for a horticultural crop, a distribution of 85 medium deposits/cm2 and 10-15% coverage is a reasonable standard for most applications.

    Location of water-sensitive papers in situ.
    Location of water-sensitive papers in situ.

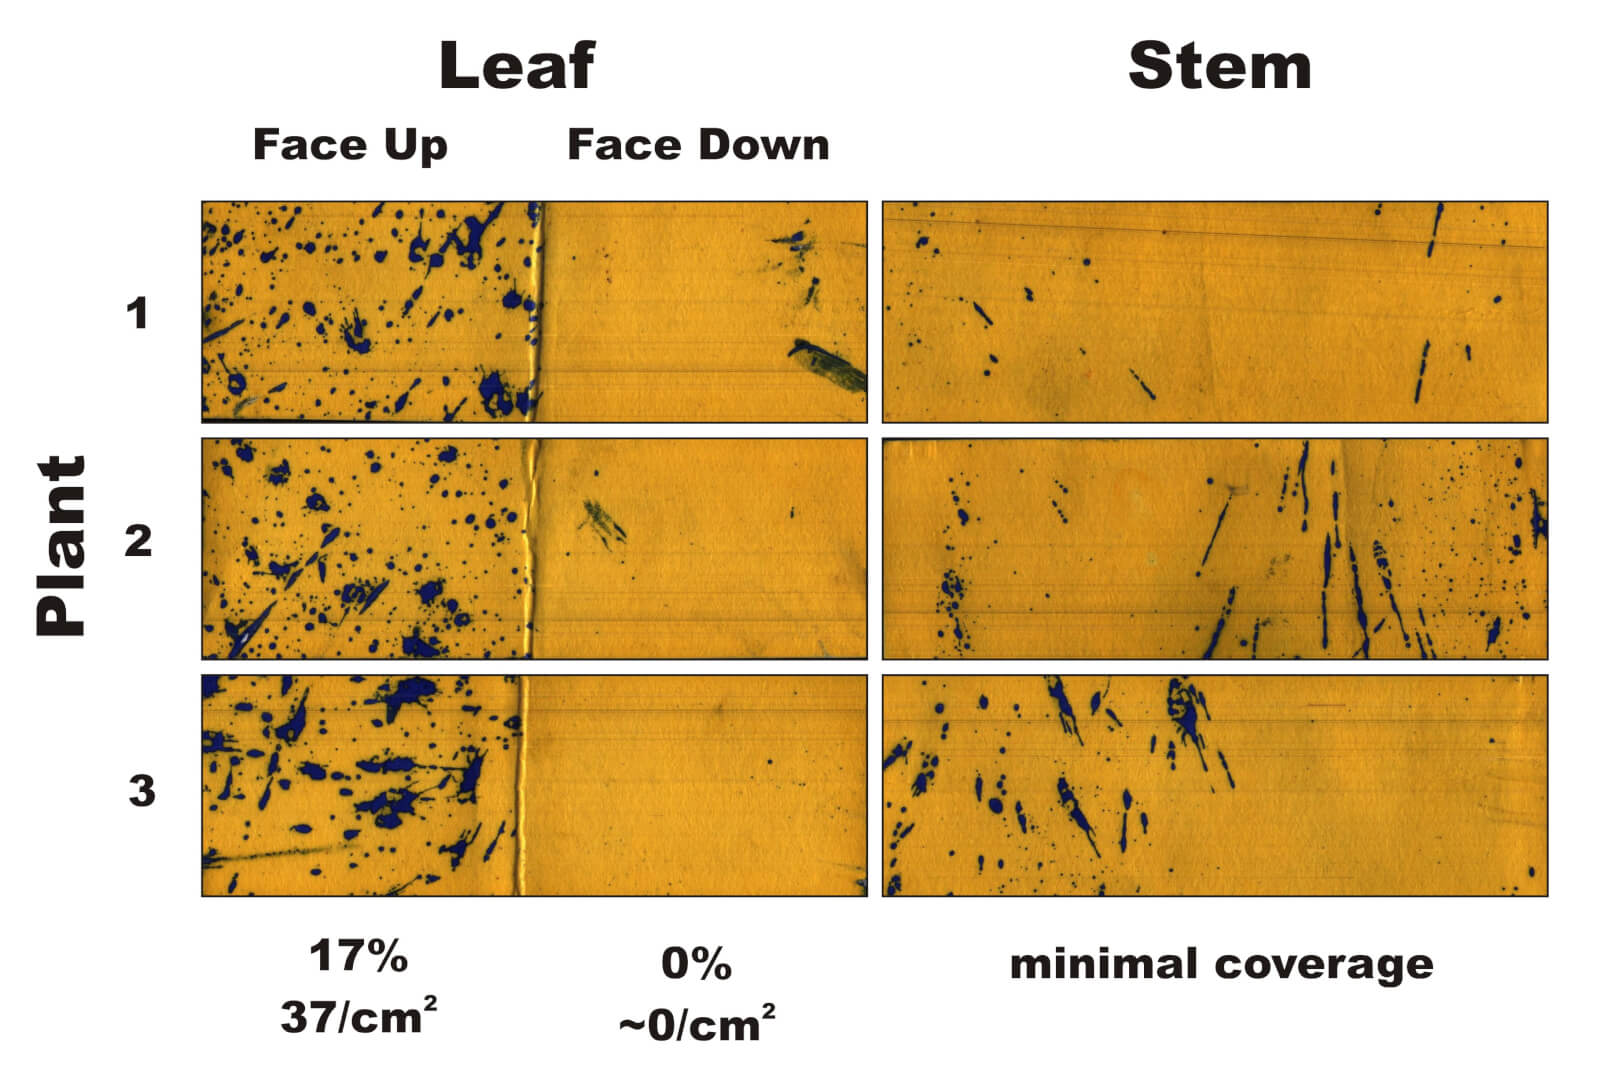
    The first condition (the AITX tips) averaged 17% coverage on upper leaf surfaces (37 deposits/cm2). These were coarser droplets at relatively low volume, so it was no surprise that we didn’t achieve 85 deposit/cm2 target. When using such large droplets, it is more important to achieve an even distribution and the 10-15% surface coverage (we achieved 17%). There were no deposits on the underside of the leaves (See figure 1), but that was also expected as coarser droplets tend to follow a downward vector that is not conductive to under-leaf coverage.

    Figure 1 - Water-sensitive papers from three plants sprayed in Condition 1. Percent coverage and droplet density are calculated for the leaves, and a visual inspection is made of the stems.
    Figure 1 – Water-sensitive papers from three plants sprayed in Condition 1. Percent coverage and droplet density are calculated for the leaves, and a visual inspection is made of the stems.

    The second condition (the ConeJets) provided better coverage. The fine droplets produced covered an average 17.5% coverage with a distribution of 99 deposits/cm2 on upper surfaces, and 23% coverage with a distribution of 185 deposits/cm2 on lower surfaces. Panoramic stem coverage was improved as well (see figure 2). This is excellent coverage, but the finer droplets were highly prone to drift (see below). With no form of drift control, this set up is undesirable.

    Figure 2 - Water-sensitive papers from three plants sprayed in Condition 2. Percent coverage and droplet density are calculated for the leaves, and a visual inspection is made of the stems.
    Figure 2 – Water-sensitive papers from three plants sprayed in Condition 2. Percent coverage and droplet density are calculated for the leaves, and a visual inspection is made of the stems.
    With no form of drift control, the fine droplets produced by hollow cones create unacceptable spray drift, even in moderate wind conditions.
    With no form of drift control, the finer droplets produced by hollow cones create unacceptable spray drift, even in moderate wind conditions.

    This led us to propose a more directed boom arrangement: We set up a hollow cone over the row (the grower’s original ConeJet) and a drop hose suspended in each alley with two TeeJet XR 8004 flat fans positioned on an angle (i.e. not vertical or horizontal to ground). This gave sufficient height to span the canopy with as little direct waste on the ground as possible. As the crop grows, the nozzles would need to be twisted into a more vertical alignment.

    ConeJet TXVK18’s alternating with drops with TeeJet XR 8004’s.
    ConeJet TXVK18’s alternating with drop hoses with TeeJet XR 8004’s.

    We did not use an air induction fan to avoid the Very Coarse spray quality and we used 80° instead of 110° to ensure the spray did not overshoot or undershoot the plant. Here are the details of the third set up:

    3. TeeJet ConeJet TXVK-18’s on 100 cm (40″) centres at 7 kmh (4.5 mph) and 3.44 bar (80 psi). That’s 1.6 L/min (0.42 gpm) per nozzle. Also, two TeeJet XR 8004’s per drop on 100 cm (40″) centres at 7 kmh (4.5 mph) and 3.44 bar (80 psi). That’s ~4.5 L/min (1.2 gpm) per drop hose. Together, set of nozzle for a total rate of 523 L/ha (56 gpa).

    This set up raised the volume considerably and aimed spray directly at the sides of the plant. Coverage was excessive and in a few cases exceeded what the diagnostic software could reliably resolve (see figure 3). Since the plants were still small at this stage, it was decided we would let them “grow into the volume” and come back to check coverage once they were at full size.

    Figure 3 - Water-sensitive papers from three plants sprayed in Condition 3. Percent coverage and droplet density are calculated for the leaves, and a visual inspection is made of the stems.
    Figure 3 – Water-sensitive papers from three plants sprayed in Condition 3. Percent coverage and droplet density are calculated for the leaves, and a visual inspection is made of the stems.

    When we returned in mid-August the plants had reached full maturity. In this final coverage trial, we added a second water-sensitive paper to each plant to span the height of the crop canopy, which had grown considerably.

    The same pepper plants ~5 weeks later had more than doubled in size.
    The same pepper plants ~5 weeks later had more than doubled in size.

    Coverage was reduced compared to how we left things in July, but appeared to be sufficient on key surfaces (see figure 4). The papers showed upper leaf-surface coverage of 63%-to-offscale and deposit distribution of 137 deposits/cm2-to-offscale. Coverage on the lower leaf surfaces was greatly reduced to 4-4.5% and 36-90 deposits/cm2. Panoramic stem coverage was present, but minimal. Applying higher volumes would likely have improved matters.

    Figure 4 - Water-sensitive papers from three plants sprayed in Condition 3, ~5 weeks later. Percent coverage and droplet density are calculated for the leaves, and a visual inspection is made of the stems.
    Figure 4 – Water-sensitive papers from three plants sprayed in Condition 3, ~5 weeks later. Percent coverage and deposit density are calculated for the leaves, and a visual inspection is made of the stems.

    When asked about the drop hoses, the grower reported “They are a bit of a nuisance because they take extra time to put on, and they get caught in the bush at the back of the field. But if they increase our coverage, then they’re worth the extra effort.”

    Final thoughts

    Adding drop hoses to a vegetable sprayer may be unconventional, but if fungicide coverage is a concern, and the drops will fit between rows, they might be worth a try. Carefully consider the volumes you use because they should reflect the size of the plant canopy you are trying to protect. Finally, water-sensitive paper provides excellent feedback to help you decide if your field volume, nozzle rates and nozzle positions are providing acceptable coverage.

  • What’s the Cost of Poor Deposit Uniformity?

    What’s the Cost of Poor Deposit Uniformity?

    We’ve heard it often: calibrate your nozzles to be sure your boom output is uniform across its entire width. The downside of poor uniformity is obvious: strips of over- or under-application causing problems with pest control or crop tolerance. A graduated cylinder held for 30 s under each nozzle is the approach of choice. Several electronic versions exist to make the job easier, for example the Spot On.

    But there’s more to the story. Nozzle calibration only ensures volumetric uniformity from nozzle to nozzle. It serves to identify worn, plugged, or damaged nozzles, and little else.

    After release, the spray is atomized and distributed across a wider area with a properly developed pattern. An operator adjusts boom height or spray pressure to generate proper overlap for a given fan angle at the target height. Unfortunately, the uniformity of this pattern can’t be measured with a graduated cylinder, so we’ve traditionally used a “patternator”, a flat collector placed under a few nozzles that uses a series of channels to show the peaks and valleys of the volumetric distribution. Both calibration and patternation are done with a stationary spray boom. Nozzle manufacturers employ both methods to ensure their products meet international uniformity standards before marketing.

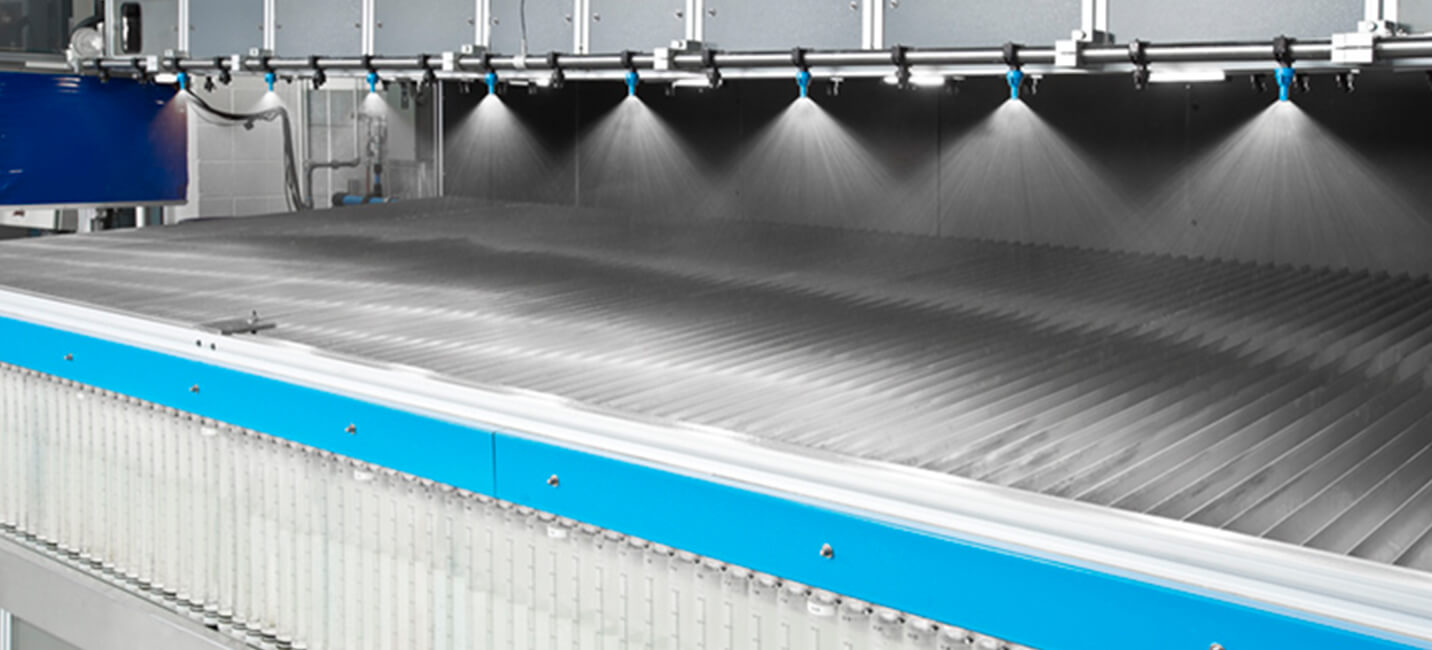
    A spray patternator determines the uniformity of a stationary boom’s spray distribution (Photo: TeeJet)

    Burt even that isn’t enough. We can have good volumetric distribution but still have inconsistent coverage in places. To identify those regions, we need a way to measure small amounts of spray deposit under a moving boom, ideally in the canopy we intend to treat. Here we have a few options. We can place a tracer (dye, salt, etc.) in the tank, and collect spray on small collectors placed throughout the area to be treated. We collect the samples, wash them, and analyze the solvent for the tracer. This requires special equipment and takes time. It’s useful, but only measures dose, not droplet size or density.

    Plastic straws can act as collectors of sprays under field conditions.
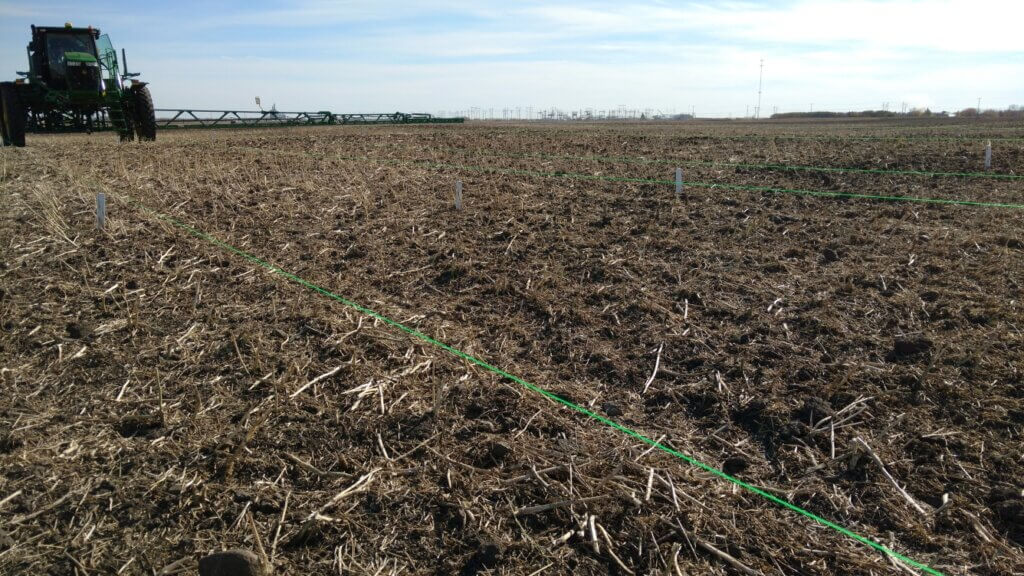
    Monofilament strings can be used to collect spray over long distances.

    A faster way is to use water-sensitive paper, about which we’ve written here and here. Using WSP is fast and easy, and it can provide additional information such as the number of droplets per unit area, or the total percent of the area covered, or even the size of the deposits, with the right equipment. We call this “coverage”, and believe this to be one of the two components of good pest control (the other being “dose”, the total amount of material deposited). Because the world isn’t fair, WSP isn’t great at quantifying dose.

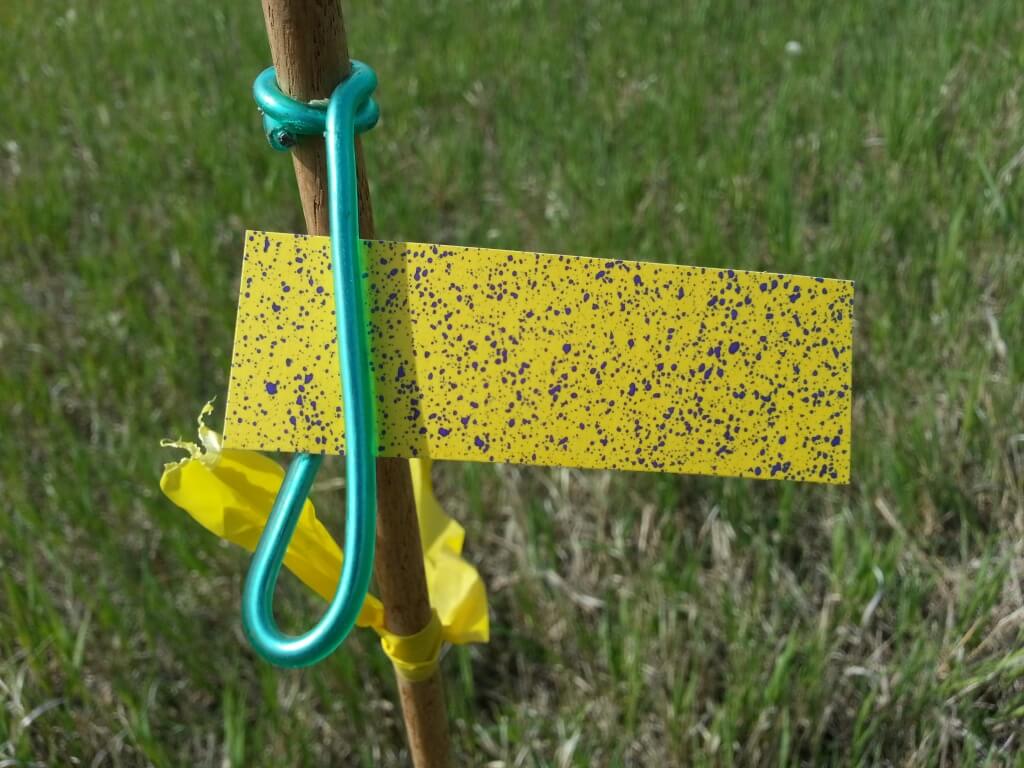
    Water-Sensitive paper provides a quick visual indication of the deposit, not just amount but also qualitative aspects such as droplet size and distribution.

    The industry has done a good job of identifying the dose required for good control, and this is reflected in the rate recommendations on a label. But there are a few gaps. They don’t tell us, for example, what “good coverage” is, despite often telling us to “ensure” it.

    Back to Deposit Uniformity

    We quantify deposit uniformity by calculating the Coefficient of Variation (CV) of a series of measurements. The CV is defined as the standard deviation of these measurements, expressed as a percent of the mean value.

    Because it’s hard to measure, it’s easy to ignore. But here are a few basics our research has told us: (In the first three examples, deposits were measured under a spray boom using petri plate or drinking straw samplers. There was no interference from a canopy. The last example was taken from within a canopy.)

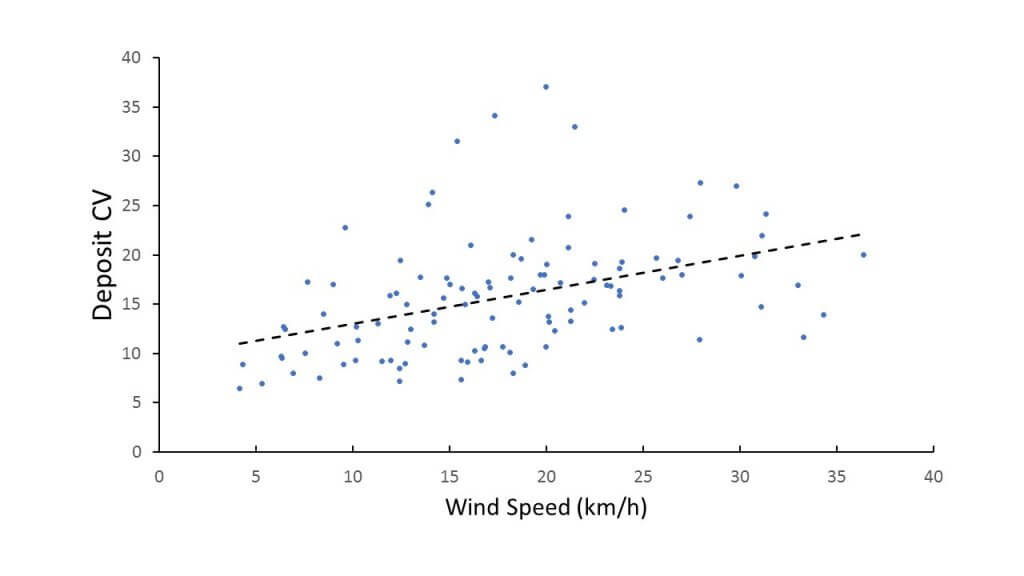
    • When measuring the deposited dose, the CV under a boom tended to rise with increased wind speed. This is no surprise, as it reflects that more wind has a greater chance to displace spray from its intended destination.
    Spray deposit uniformity, observed during various spray drift studies, tended to decrease with higher wind speeds.
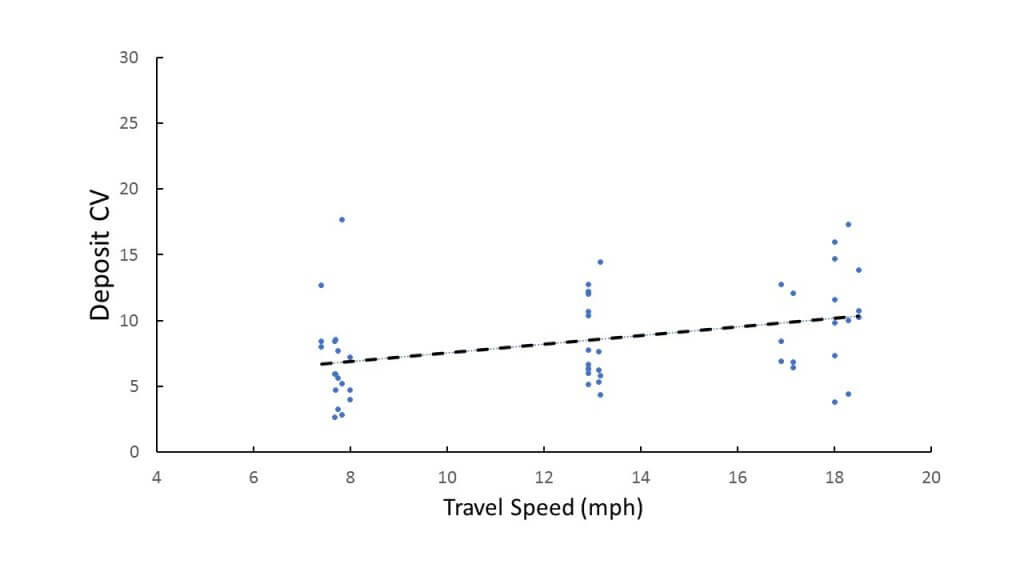
    • Higher booms and increased travel speed also tended to increase deposit CV.
    Faster travel speeds during spray drift studies tended to decrease uniformity.
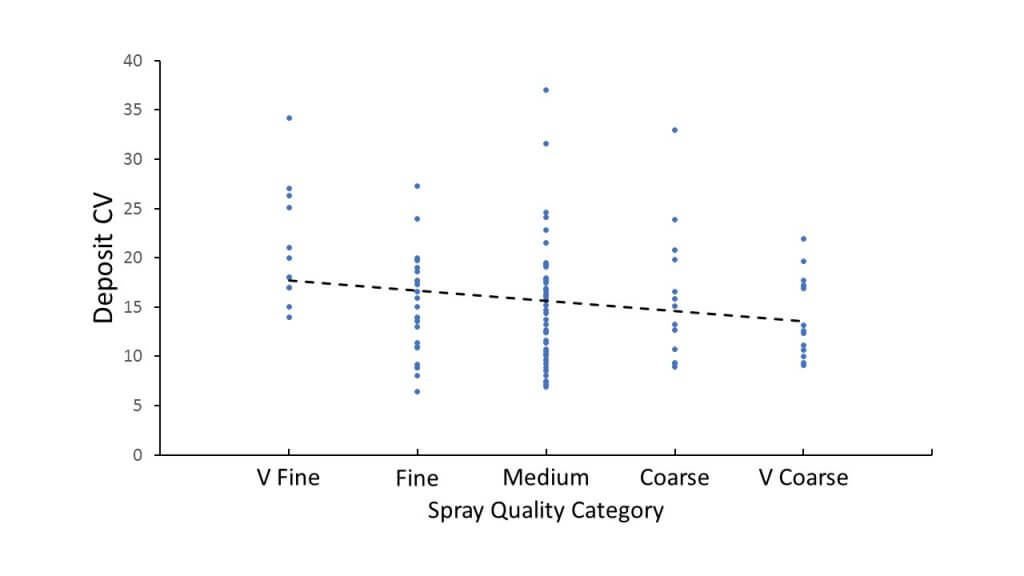
    • Finer sprays tended to increase deposit CV. This makes sense, as the finer droplets are more easily displaced by air movement.
    Coarser sprays created more uniform deposits possibly because they were more resistant to turbulent displacement.
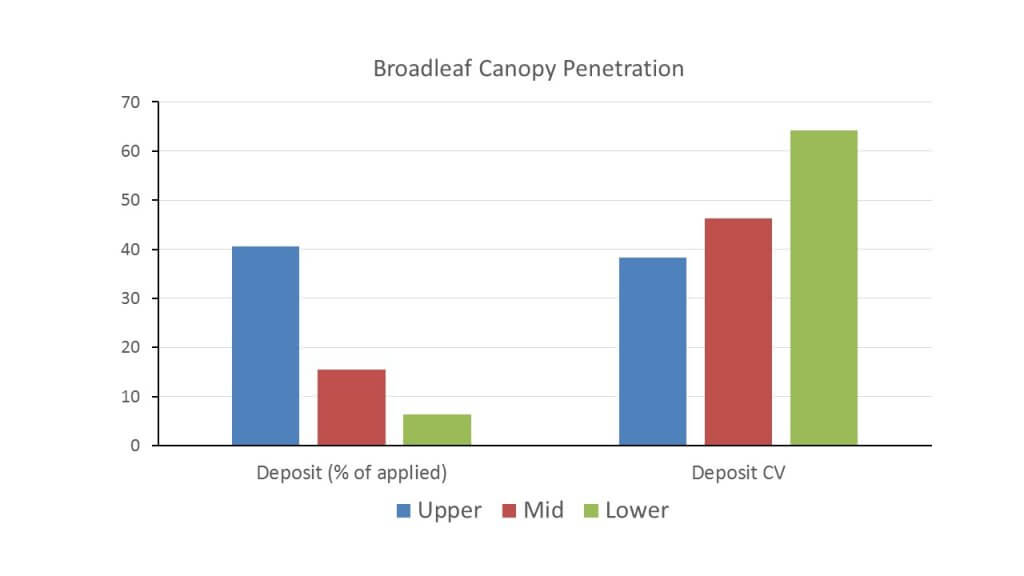
    • Deposits were reduced and became more variable deeper in a broadleaf canopy. Again this makes sense, as there are a lot of obstacles to clear and canopies themselves are by no means uniform.
    Deposit amount was lower in the canopy, as expected. But the lower deposit was also more variable.

    Also note that the CV in the canopy was quite a bit higher (40 – 60%) than for the exposed targets (10 – 20%). That’s another challenge.

    To recap, the best uniformity was achieved with low booms (as long as patterns overlap sufficiently), slow speeds, low winds, and coarser sprays. It’s easy to see that current spray practice isn’t always conducive to uniform deposits.

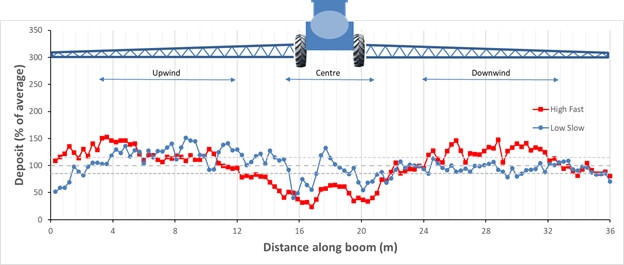
    Deposit variability as captured by a 2 mm diameter string with two sprayer configurations.

    So What?

    Why does uniformity matter? It matters because more variable deposits are less efficient. They require higher doses for the same effect as uniform deposits. Here’s why:

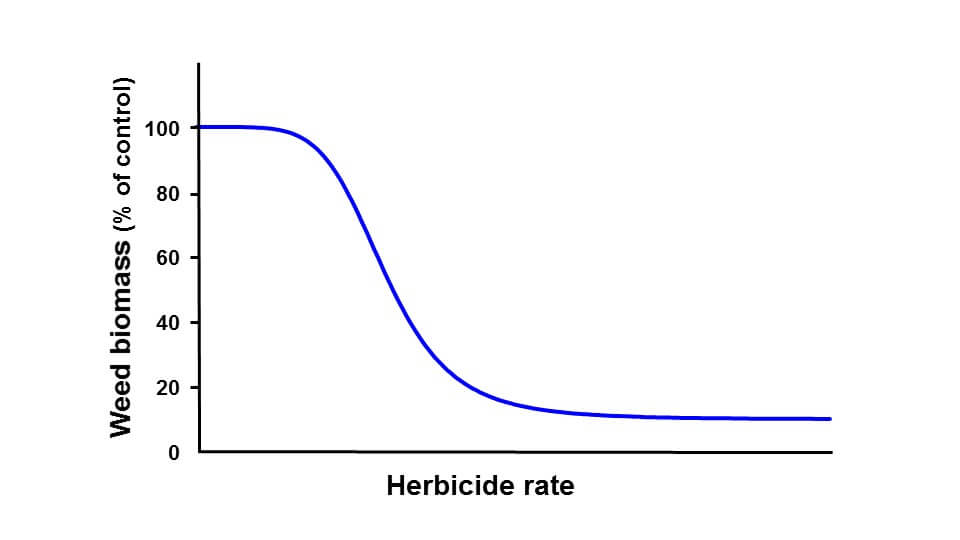
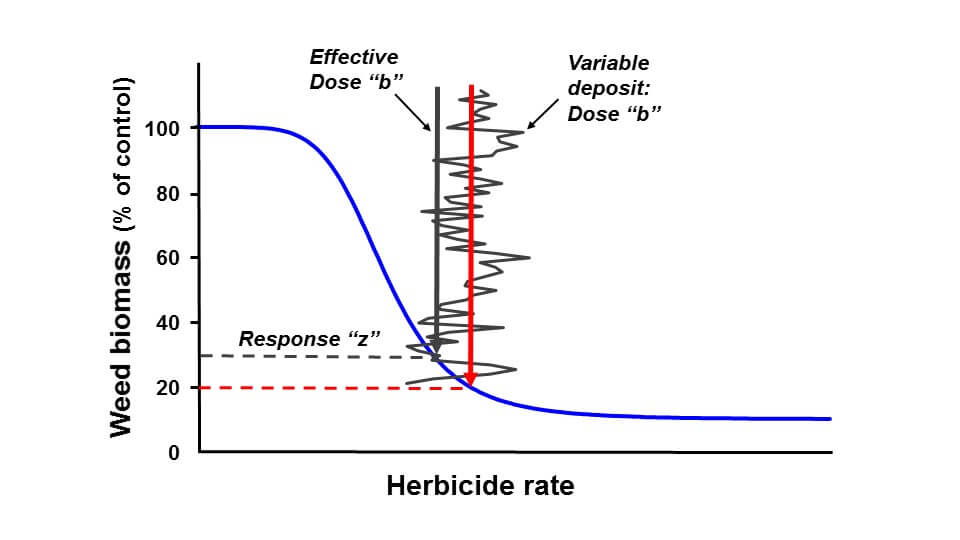
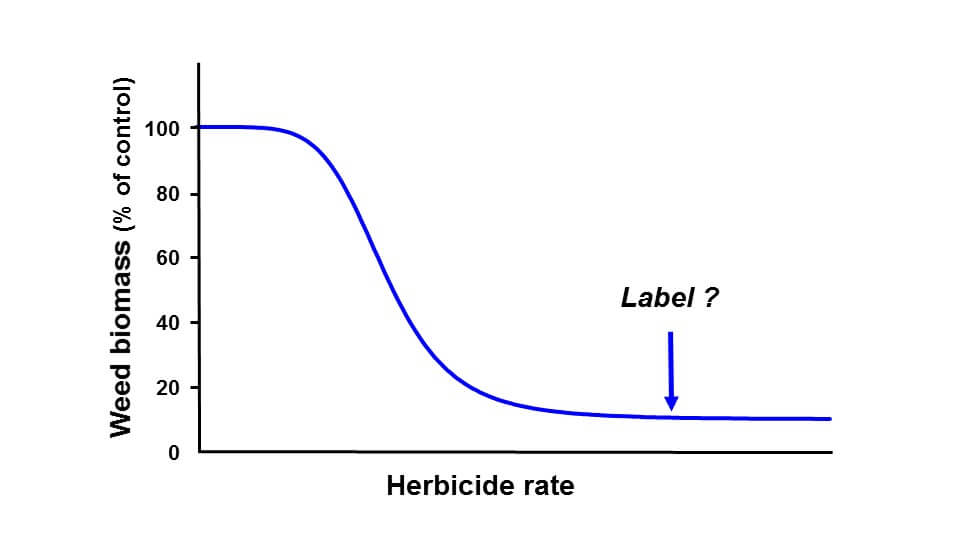
    The figure below shows a typical dose response curve for a herbicide. On the y-axis, we see weed biomass, on the x-axis herbicide dose. At low pesticide doses, not much happens. (In fact, we often see a slight increase in biomass with very low herbicide doses.) As we increase dose, biomass begins to decline, and as dose increases further, the effect begins to taper off. At a certain dose, no further biological response is possible.

    A typical dose response curve for a herbicide.

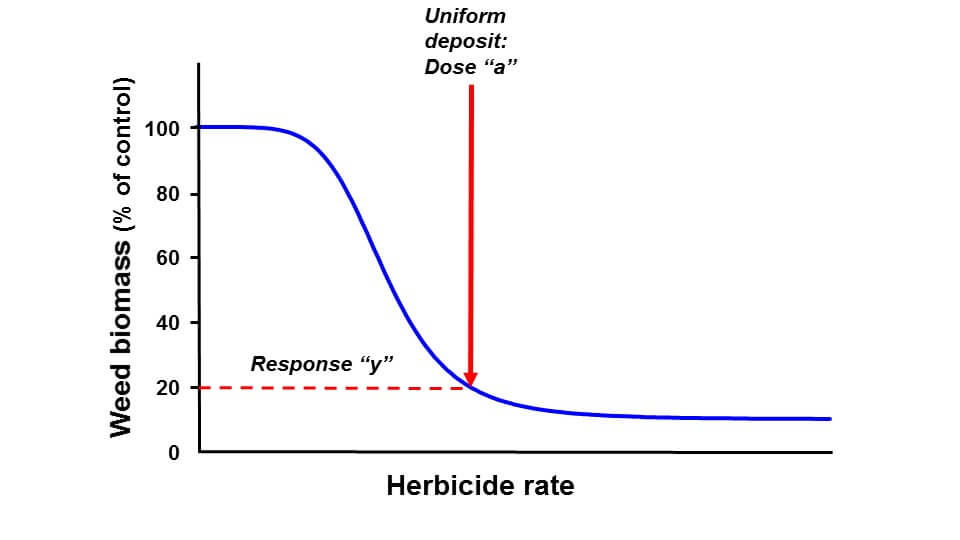
    In the next figure, we see that application of a uniform dose “a” results in biomass “y”, about 20% of untreated.

    A dose response curve represents the weed biomass that resulted from any applied dose.

    Next, we apply the same average dose, but we do it non-uniformly. At some locations under the boom, the deposit may be 40% higher or lower than average. The result is response “z”. Weed control is worse, as bad as it would have been at a lower uniformly applied dose (effective dose “b”).

    A variable dose across a field results in many individual weed biomasses because of deposit variation. The net result is lower control.

    This effect only happens when the effective dose is near the lower inflection point of the dose response curve. Perhaps we’re shaving rates. Perhaps the weather is challenging the herbicide’s performance. Or perhaps the weed is difficult to control. Under those conditions, any gain in performance with a higher dose is less than the penalty from a lower dose.

    There are two ways to correct this performance loss. One is to apply a higher herbicide rate. It’s commonly done, as insurance against – you guessed it – variability, and it’s one reason why label rates have some flexibility. The second way is to improve deposit uniformity. In effect, better uniformity allows for rate reductions.

    Label rates are typically in the flat region of the dose response curve to allow for variable conditions in weed susceptibility, weed growth stage, growing conditions, and deposit variability.

    Take Home Message

    Uniform spray deposition improves overall control. Our examples used herbicides, but the same is true for fungicides and insecticides. It’s true for field crops as well as fruit and vegetable sprays.

    Uniformity is especially important when the application is done under adverse conditions in which the pesticide performance is challenged. It’s a fundamental part of good application practice.

    It’s not always easy to improve uniformity. But at least it should be measured. Without measuring it, an applicator may never know how much product is being wasted. Have a look at the Crop Adapted Spraying approach Jason is using, it’s a template for all sorts of applications.

    What can you do? The easiest task is to record the flow from each nozzle. The results might be surprising. Ensuring proper and consistent boom height is also important. Using water-sensitive paper to visualize the quality of the job would be icing on the cake. And adjusting application method, with uniformity as a goal…that gets you a gold star.

  • Pressure Changes Spray Angles

    Pressure Changes Spray Angles

    When we consult a nozzle catalogue we are interested in the flow and droplet sizes produced at a given pressure. Perhaps we should also consider the effect of pressure on spray angle. We have several articles discussing the collective impact of spray overlap, nozzle spacing and boom height on coverage uniformity (Check here and here for example). However, we don’t really address the fact that fan angle is not a constant. This may be more relevant with the growing adoption of spot sprayers.

    To illustrate the potential for fan angle variation, we assembled a collection of red, flat fan nozzles (‘04s) from several manufacturers. We plugged each nozzle into a spray pattern table, set the regulator at a given pressure, and photographed the spray angle and flow distribution. This process was repeated for each nozzle at seven different pressures within the manufacturer’s approved range of 20-80 psi. After digitizing the photos, we measured the spray angle using a digital protractor.

    We anticipated a concomitant increase in spray angle as the pressure increased. This is not news. Anyone who has operated a sprayer has seen the spray pattern open up as the boom fills and pressurizes. Bear in mind this was only performed once (i.e. n=1), so while it illustrates trends it shouldn’t be mistaken for a rigorous scientific comparison. Further, this demonstrates a static situation and not a dynamic one where travel speed, wind conditions and the vortices from the sprayer it self will influence matters.

    We saw similar trends with nozzles other than 110˚ fans, but let’s focus on 110˚s due to their current popularity.

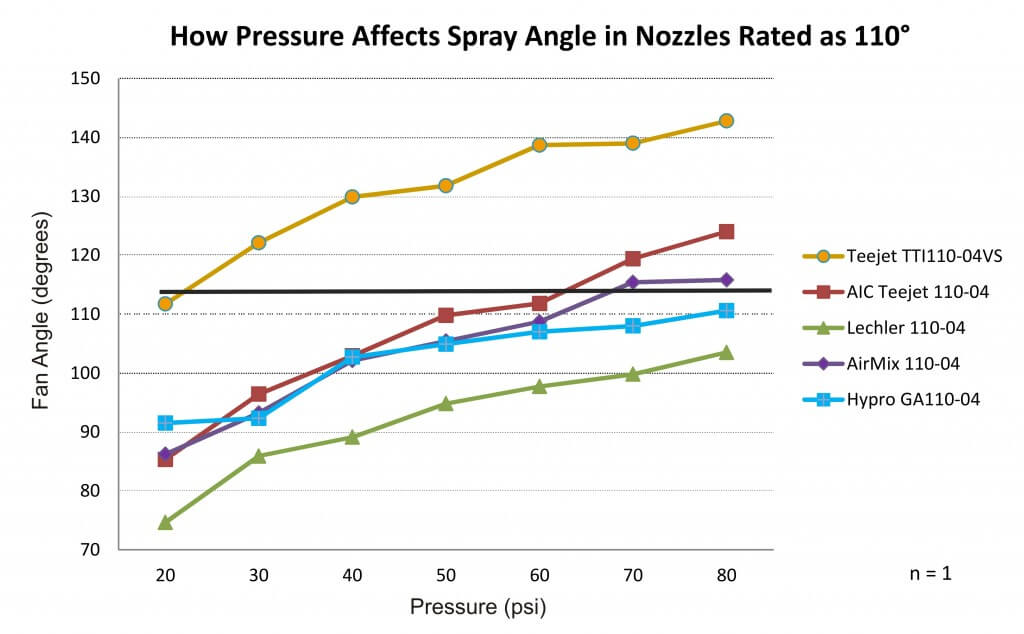
    Fan angles for five common 110 degree AI flat fans over their manufacturer-recommended pressure range
    Fan angles for five common 110 degree AI flat fans over their manufacturer-recommended pressure range

    The spray angle for 110˚ nozzles ranged from 75˚ at 20 psi to approximately 143˚ at 80 psi. One nozzle failed to reach 110˚ at any pressure. Conversely, there was another that was over 110˚ at nearly all pressures. Ideally, spray nozzles should be operated around the middle of their manufacturer-recommended operating range. Three of the nozzles tested came close to 110˚ at that median pressure, but only the TeeJet AIC110-04 measured 110˚ at the middle of its recommended range (~50 psi).

    Using that nozzle as an example, let’s look at the pressure, spray angle and subsequent distribution of flow along the swath at three different pressures. At 20 psi, the spray angle was 85˚. The yellow balls are floats that reflect flow as a series of cross sections of the swath. We see that aside from the tapered edges (which illustrate the need for 100% overlap between neighbouring nozzles) the distribution was fairly even. One of the priorities in nozzle design is to ensure a low coefficient of variability over the operating pressure range. In other words, the length of the swath may change, but the spray quality and uniformity in that swath is still within spec. At 50 psi the nozzle produced the expected 110˚ fan, and the spray distribution remained even. At 80 psi, the angle spread out to 125˚, spanning a greater distance, but it started to produce a less-even distribution.

    Photographs of spray angle and distribution for the TeeJet AIC110-04 at the extreme low, middle and highest pressures of its recommended pressure range.
    Photographs of spray angle and distribution for the TeeJet AIC110-04 at the extreme low, middle and highest pressures of its recommended pressure range.

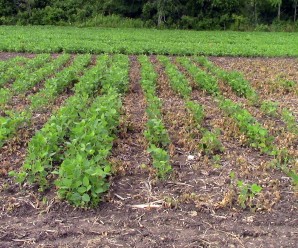
    When fan angle changes with pressure, it can have significant implications. Nozzle spacing on a boom varies from sprayer to sprayer. Generally 50 cm (20 inch) centres are the standard in North America, but we’ve seen 15″ and even 10″. Nozzle spacing and boom height collectively determine the degree of spray overlap. Excessive overlap isn’t a problem, although additional nozzles do mean added expense, cleaning time and potential for plugging. Conversely, gaps in the pattern could lead to sub-lethal applications or flat-out misses. For example, in this soybean demo plot (below) we sprayed a contact herbicide at low pressure to collapse the spray pattern. You can see the alternating stripes of hits and misses that resulted from an incomplete overlap of spray.

    Soybean demo plot sprayed with a contact herbicide using 110 degree air induction flat fans at 20 psi. The collapsed spray pattern did not overlap sufficiently to burn the entire crop down, leaving a striped pattern and demonstrating the poor coverage.
    Soybean demo plot sprayed with a contact herbicide using 110˚ air induction flat fans at 20 psi. The collapsed spray pattern did not overlap sufficiently to burn the entire crop down, leaving a striped pattern and demonstrating the poor coverage.

    Nozzle manufacturers generally recommend a 100% spray overlap for flat fans. This creates sufficient overlap when the boom sways low to the ground. It also increases the degree of droplet size homogeneity under the boom as coarser and fewer droplets are generally found at the “horns” or edges of the pattern compared to the centre. In order to ensure this degree of overlap, sprayer operators should observe and consider changes in fan angle over their typical pressure range. Otherwise, the cost of poor deposit uniformity under the boom could be high.

    • Operate nozzles around the middle of the manufacturer-recommended pressure range. However, just because a nozzle is rated over a range of pressures does not mean the angle is constant.
    • Lower pressures are a greater concern than higher pressures. 30 psi is the absolute lowest pressure for operating a 110˚ air induction flat fan; the ideal operating range for these nozzles is 50-70 psi.
    • If nozzles are not maintaining the recommended 100% overlap at your preferred pressure range, then consider switching nozzle rates, and adjusting pressure and boom height.

    This work was performed with Victoria Radaukas, 2015 OMAFRA application technology summer student.