Category: Coverage

Articles related to horizontal boom sprayer coverage

  • Comparing Water Sensitive Paper Brands

    Comparing Water Sensitive Paper Brands

    Introduction

    Spray coverage describes the degree of contact between spray droplets and the target surface area. This metric can be used to predict the success of an application. One of the easiest methods for visualizing coverage is to use water sensitive paper (WSP), which is a passive, artificial collector that turns from yellow to blue when contacted by water.

    WSP is often used to evaluate iterative changes to a spray program. Placed strategically throughout a target canopy, or directly on the ground, achieving uniform, threshold coverage translates into improved efficacy, reduced waste, reduced off-target contamination and reduced risk of pesticide resistance development. WSP were also used to develop a system that measures the area covered by the effective radial distance in an attempt to relate the area covered by a stain to a larger area where sufficient pesticide activity is taking place.

    WSP tends to underestimate the spreading effect that can occur on plant surfaces (especially when surfactants are used), but they are effective as a relative index.

    A brief history of WSP

    In 1970, a journal article described a new method for sampling and assessing spray droplets. Photographic paper treated with bromoethyl blue created a yellow surface that changed colour when it encountered moisture. The pH-based reaction was fast and irreversible, leaving a distinct blue stain to mark the deposition.

    Ciba-Geigy Ltd. made water sensitive paper commercially available in 1985 (later as Novartis in 1996 and as Syngenta since 2000). It is produced in several formats, but aluminum foil packages of 50, 76 x 22 mm (1 x 3 in.) papers are the most popular. Odds are if you’ve ever used water sensitive paper, it originated from Syngenta in Switzerland. In 2023 I noticed that the papers now say “made in Germany.”

    Change of manufacturing location?

    In recent years, two new options have been made commercially available: Innoquest’s SpotOn Paper (United States) and WSPaper (Brazil). At the time of writing, there has been no impartial comparative evaluation of these three products.

    Once dry, the blue stains on WSP are irreversible and papers can be stored for long periods of time. However unstained portions will continue to react to moisture from humidity, dew, or fingerprints, so care must be taken in their handling and storage.

    Comparing WSP brands

    The three commercially-available brands of WSP were subjected to a series of comparisons. The intention was not to rank these products, but to determine if they performed in a similar fashion and to alert users to any significant differences.

    Packaging and Appearance

    Each package was donated for the study. The SpotOn (SO) papers had a “sell-by” date of November 2023, the Syngenta (SY) papers (provided via Spraying Systems Co.) were dated February 2021 and the WSPaper (WS) was their newest formulation (white package, not silver), received June 2021. The comparison was performed on July 5, 2021.
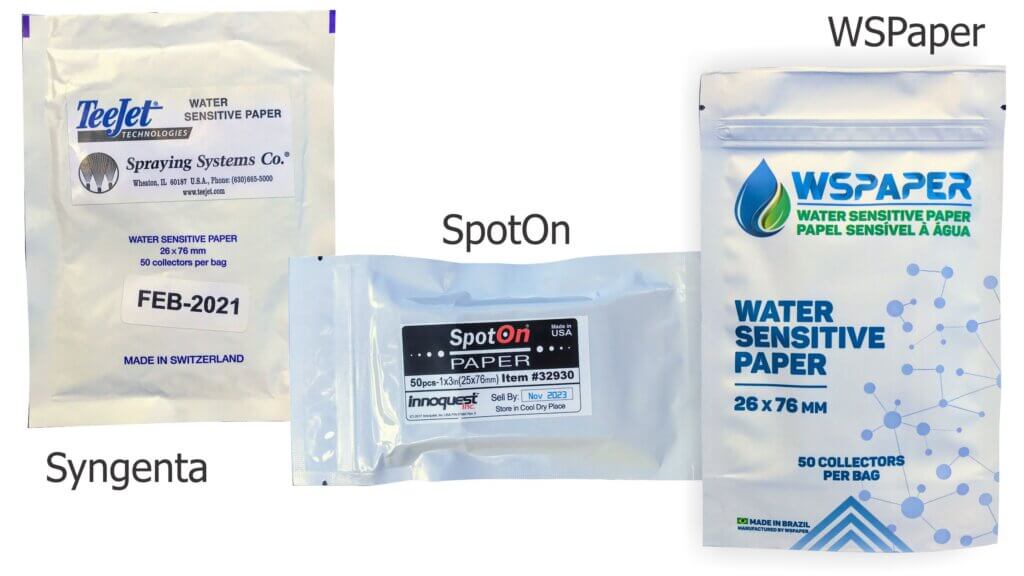
    WSP packages.

    Each product was a foil or plasticized bag of 50, 26 x 76 mm papers. SO and WS had a re-sealing feature similar to that of a sandwich bag. SO also included a package of silica gel desiccant to capture moisture and a pair of plastic forceps to facilitate handling.

    Users are encouraged to label papers to ensure they know their relative position and sprayer pass for later analysis. It was possible to write in ink on the faces of the SY and SO papers, but not WS. It was possible to write on the back of all brands.

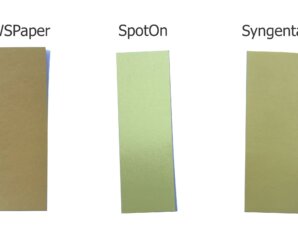
    The three papers were different shades of yellow. Further, in the author’s experience, the colour can be visibly different between batches of the same brand. In the case of larger experiments where more than 50 papers are required, it would be prudent to ensure papers are not only from the same manufacturer, but the same production batch. This would not be an issue when subjectively comparing papers, but when using software that employs colour thresholding to identify deposits, it could create artifacts. Presently, only Syngenta has a batch number (found on a sticker on the back of the bag).

    Bleed-through

    WSP is often placed in foliar canopies which are subject to dew and transpiration that can cause the papers to react prematurely. This can be particularly limiting when moisture soaks through the backs of papers. Each brand of paper was placed face-up on a drop of water to see if the water would bleed through.
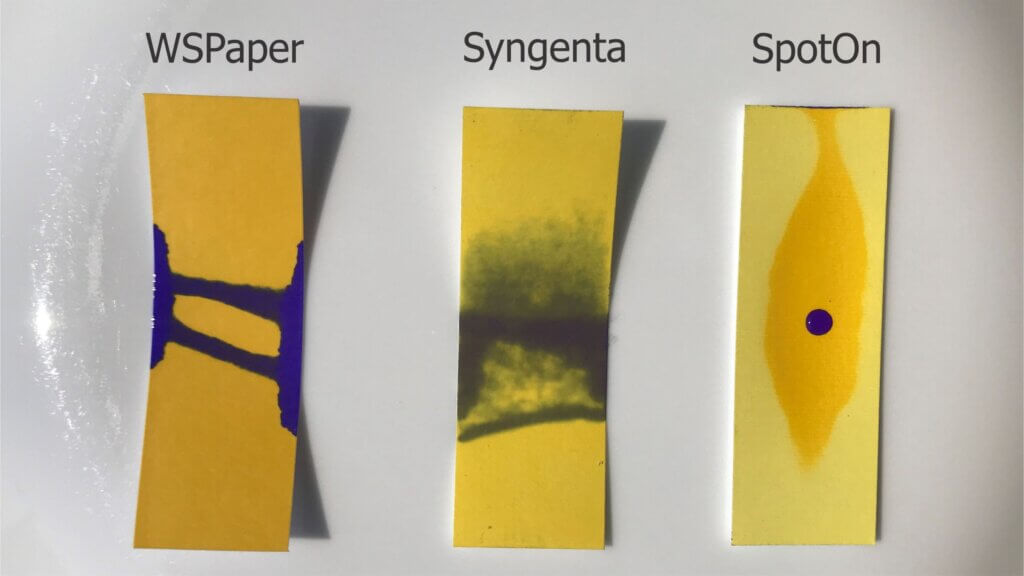
    Three brands were placed on a single drop of water. Within five minutes, WSPaper and Syngenta brands wicked the water through, causing a colour reaction. SpotOn did not, although the yellow surface darkened. When a drop of water was applied to the face, the SpotOn paper still produced a blue stain.

    WS quickly curled as the water wicked in from the edges. Within five minutes the water soaked through from the back as well. Within five minutes SY also curled, but the colour reaction was entirely due to water soaking through and not wicking along the edges of the paper. SO did not curl and there was no colour reaction save a minor wicking reaction at one edge. It did however produce a dark yellow patch. In order to see if a colour reaction was still possible, a single drop of water was placed on the face and the colour reaction was distinct and instantaneous.

    Note: Others have since replicated this experiment and reported that the response depends on the amount of water used and how long you leave it. We repeated our experiment with higher volumes and longer wait times (see image below). Ultimately, no brand of WSP is water proof from the back. Nevertheless, with small volumes of water (such as from dew) the original assessment of each brand is still valid.
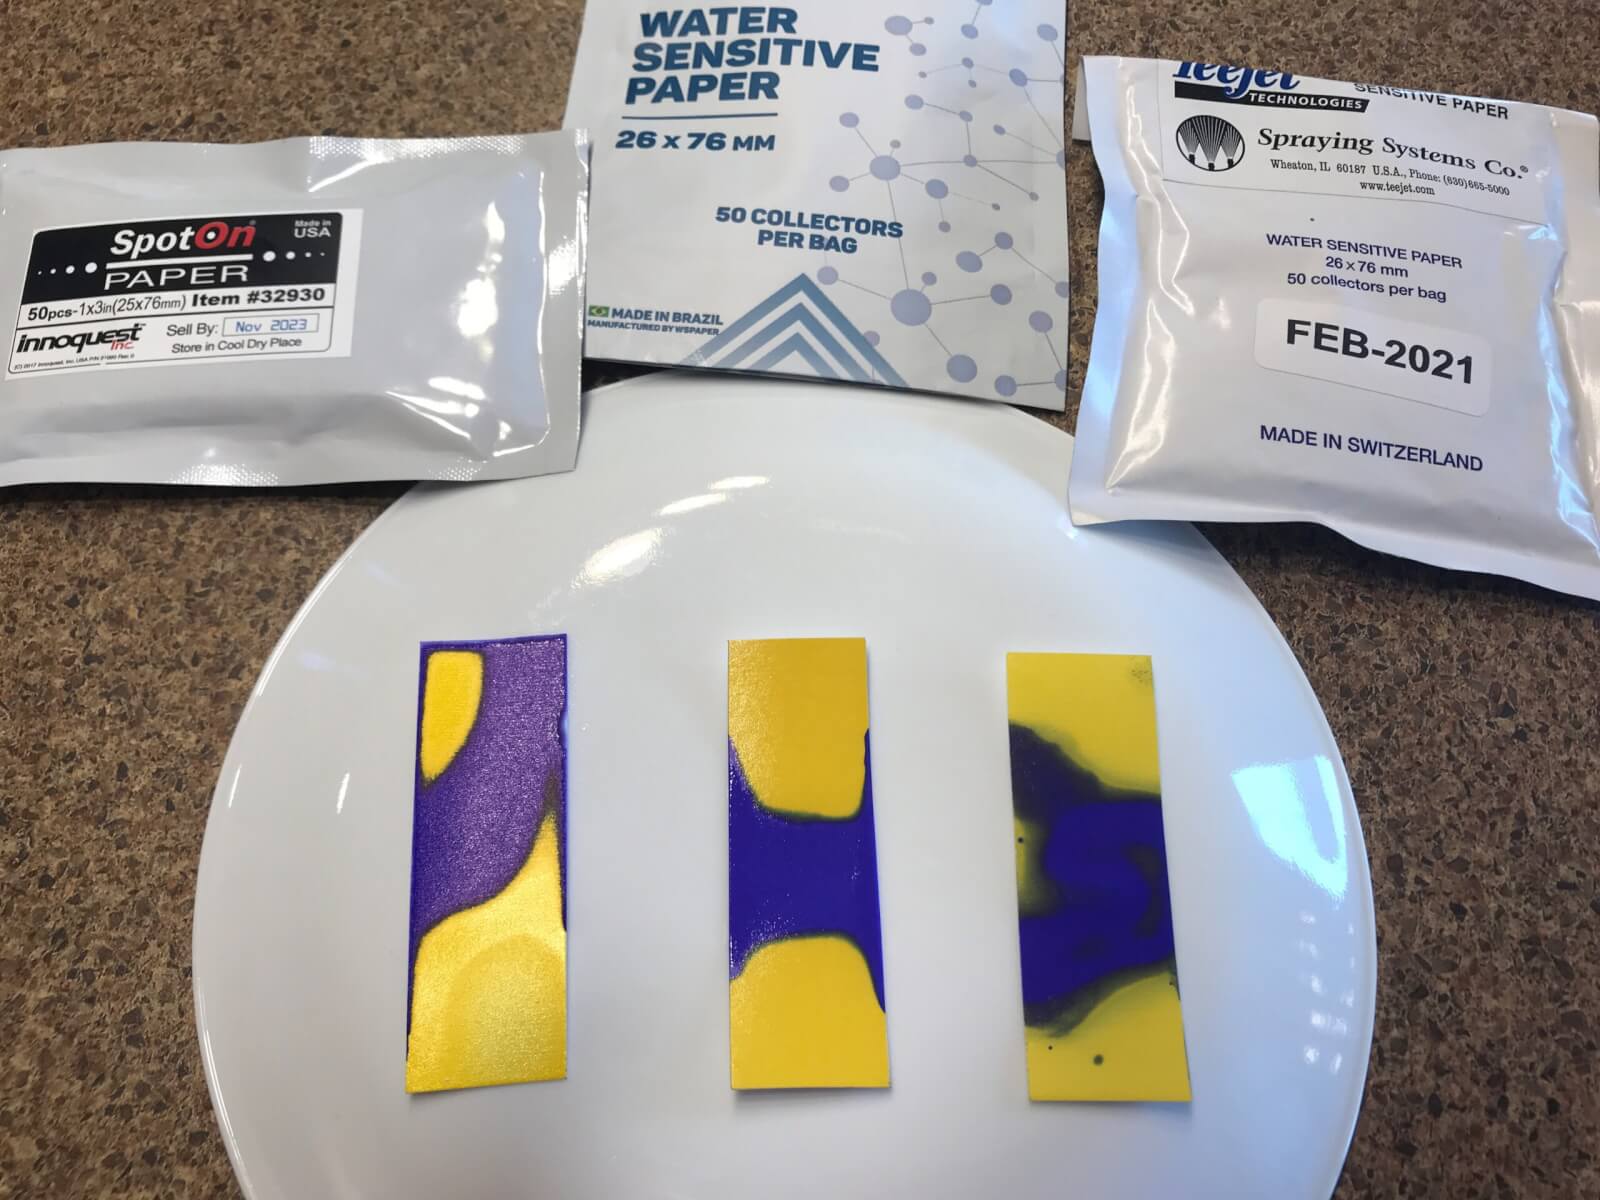
    A replication of the bleed-through experiment with the same batch of papers was performed with higher water volumes and a longer duration. Eventually, all three brands bled through. (SpotOn left, WSPaper middle, Syngenta right).

    Deformation and drying time

    Users of water sensitive paper may be familiar with its occasional tendency to curl when one side is sprayed. In extreme cases, this movement could create smears if the paper contacted other wetted surfaces in dense foliage. The degree of curling was significantly different by brand, with SY becoming convex when wet and then flexing back into a concave form once dry. WS deformed as well, but only to a minor degree. SO did not appear to deform at all. Syngenta has noted that the degree to which their papers curl depends on the batch. Their manufacturing process has changed over the years in response to regulatory requirements and minor adjustments are still occasionally made.

    Once dry, each brand of WSP tended to curl to different degrees. Syngenta curled the most and SpotOn the least if at all.

    There was no appreciable difference in the time it took for any brand to dry. This is based on attempts to smear papers every 30 seconds. All were dry in under five minutes.

    Experimental design

    While there is considerable variability inherent to spraying, every effort was made to maintain consistent conditions. Papers were sprayed in a closed room with no appreciable air currents (21.5 °C and 64% RH). Papers were paired randomly, side-by-side on a plastic sled. The sled was pulled at 2.5 kmh (~1.5 mph) through the centre of a spray swath produced by a TeeJet XR80015 positioned 50 cm (20 in.) above the targets. The nozzle operated at 2.75 bar (40 psi) to produce ~270 L/ha (~29 gpa) with Fine spray quality. Six passes were made, producing four sprayed papers for each brand.

    All papers were dry to the touch after two minutes. They were removed to a cooler, low humidity space and were digitized and analyzed using the SprayX DropScope (v.2.3.0) within an hour of spraying. We noted that while WS and SO fit easily into the DropScope port, the SY papers were sometimes slightly wider and had to be forced. Learn more about how to digitize and analyze WSP in this series of articles.

    Screen capture from DropScope’s smartphone app.

    The “ground” option was selected, and each brand of paper was processed using its specific spread factor. DropScope has a detection threshold of 35 µm. This is appropriate as the smallest droplet diameter that can be resolved by any brand of WSP is ~30 µm (Syngenta, Innoquest, SprayX – Personal Communication).

    Percent surface covered

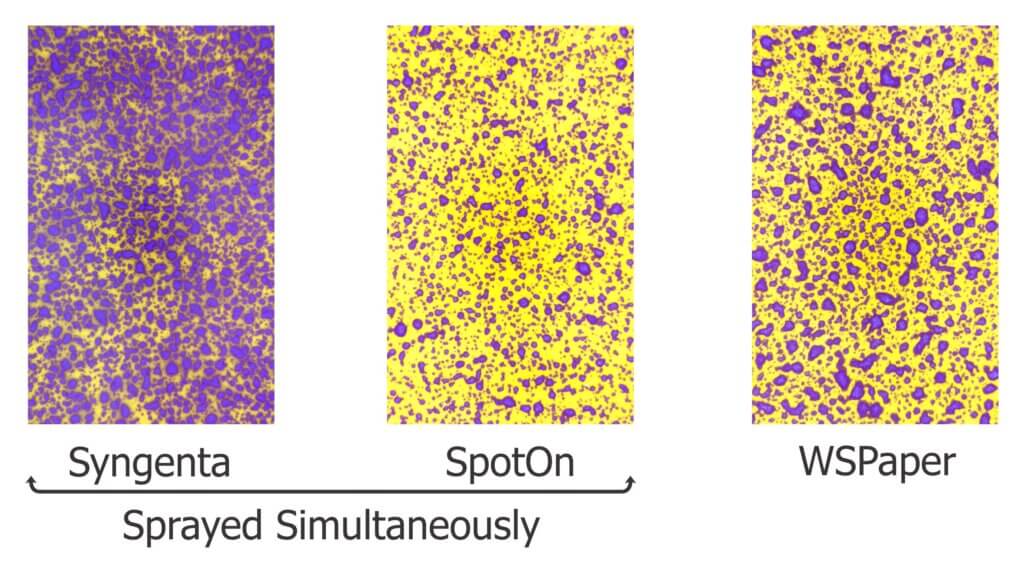
    The average percent surface covered was calculated with standard error of the mean for each paper. WS and SO produced similar values between 30 and 35%. While all three brands exhibited similar variability, SY approached saturation at approximately 80% coverage. Therefore, WSPaper exhibited a slightly higher degree of spread than SpotOn, while the Syngenta paper exhibited a significantly higher degree of spread.

    For reference, it can be difficult to determine if a stain represents a single deposit or is the result of multiple overlapping deposits. This becomes a problem when the surface of the WSP exceeds 20% total coverage. Further, it becomes increasingly difficult to distinguish a stain from the background, unstained surface when papers exceed 50% total coverage.
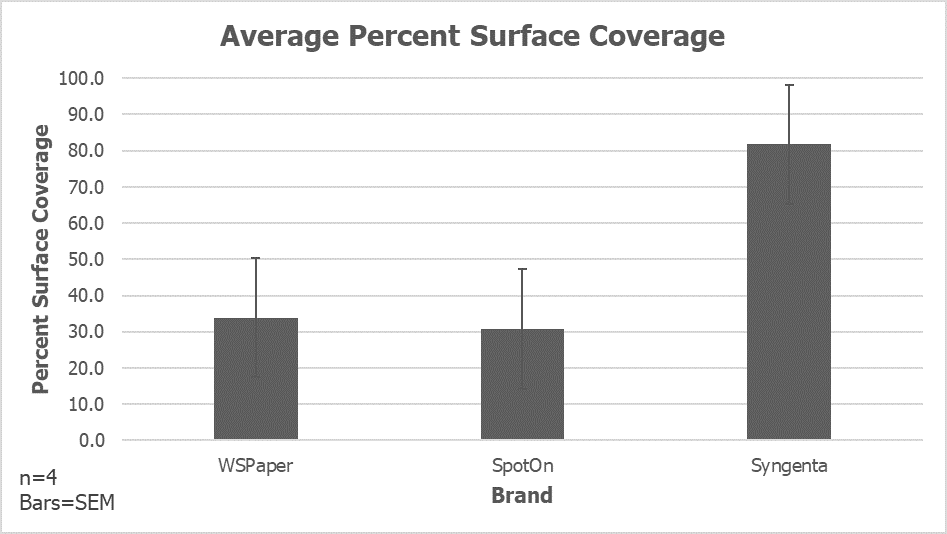
    Average percent surface coverage by brand.
    DropScope-digitized images of three brands of WSP. The Syngenta and SpotOn papers were sprayed simultaneously while the WSPaper was sprayed in a subsequent pass. WSPaper exhibited a slightly higher degree of spread than SpotOn, while the Syngenta paper exhibited a significantly higher degree of spread.

    Deposit density

    The average deposit density is a count of discrete objects (i.e. stains) per cm2. WS appeared to resolve the highest count, followed by SY and then SO. The process for determining what is a discrete object, and not the result of anomalies such as overlapping deposits, elliptical deposits or imperfections in the paper itself is complicated and computationally heavy. The algorithms employed by DropScope treated each paper consistently. So, while some differences are attributed to variations in spraying, they also reflect the paper’s innate ability to resolve individual deposits.
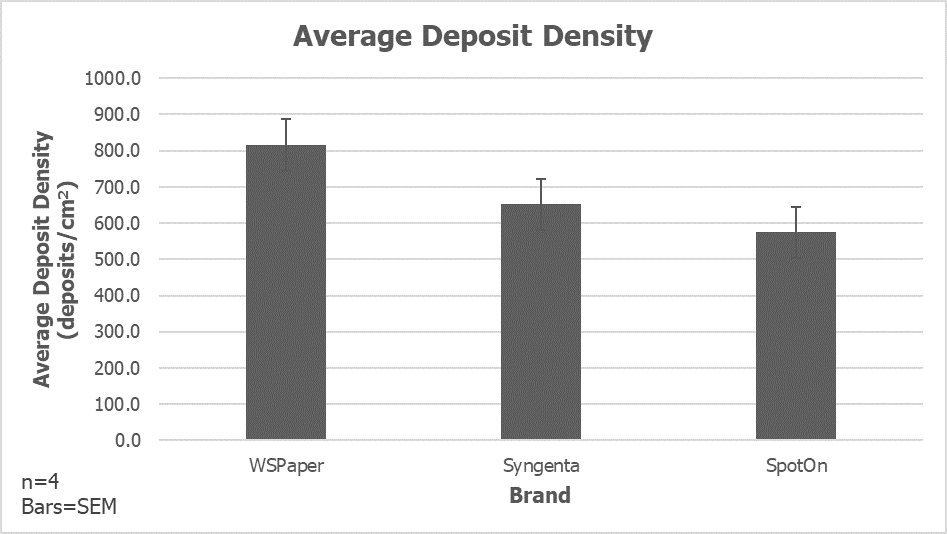
    Average deposit density was highest for WSPaper, then Syngenta, then SpotOn. Variability was similar in all cases.

    Droplet diameter

    It is not the intent of this article to determine if WSP should be used to extrapolate the original droplet size. The many assumptions and inconsistencies inherent to this process are well known. Nevertheless, some researchers do use WSP in this manner, so a comparison was warranted.

    DropScope bins deposit diameters by size to produce histograms of deposit size by count. These stain diameters are used to extrapolate DV0.1, DV0.5 (VMD), DV0.9 and NMD, which describe the population of droplets that produced the stains. DV0.5 is the Volume Median Diameter, or the droplet diameter where half the volume is composed of finer droplets and the other half by coarser droplets. Number Median Diameter (NMD) is the droplet diameter where half the total droplets are finer, and half the total droplets are coarser.

    Each brand of WSP will permit a certain degree of spread when a droplet of water contacts the surface. This spread factor is specific to the brand of paper. Further, the spread factor is not constant for all droplet sizes; Finer droplets will spread less than coarser droplets.

    When processing data using DropScope, selecting the appropriate spread factor makes a significant difference to the output. For example, here are the same four SY papers processed using the Syngenta-specific spread factor as well as the spread factors intended for SpotOn and WSPaper.
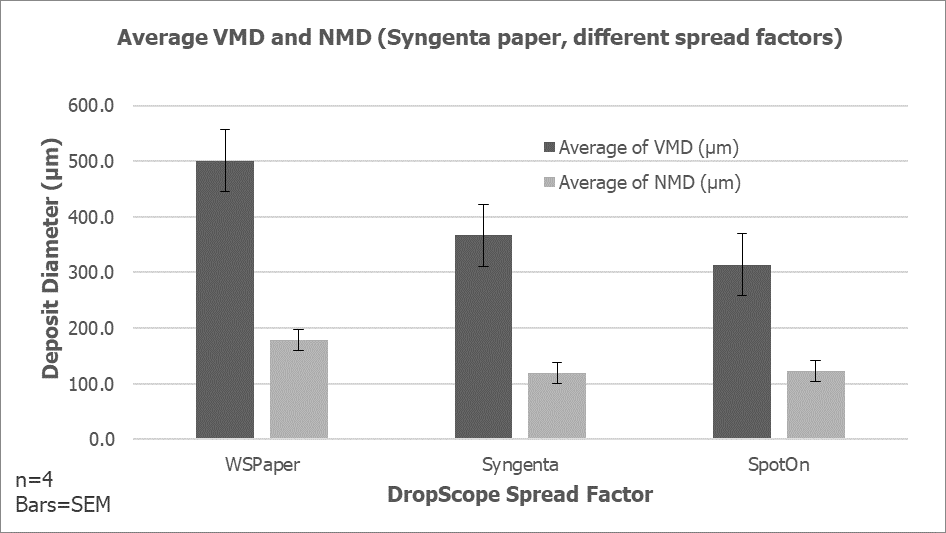
    The same four Syngenta papers were processed by DropScope using the Syngenta-specific spread factor as well as the SpotOn and WSPaper spread factors. The resulting VMD and NMD were very different.

    Therefore, each brand of water sensitive paper was analyzed using its brand-specific spread factor (according to DropScope), to produce the following graph.
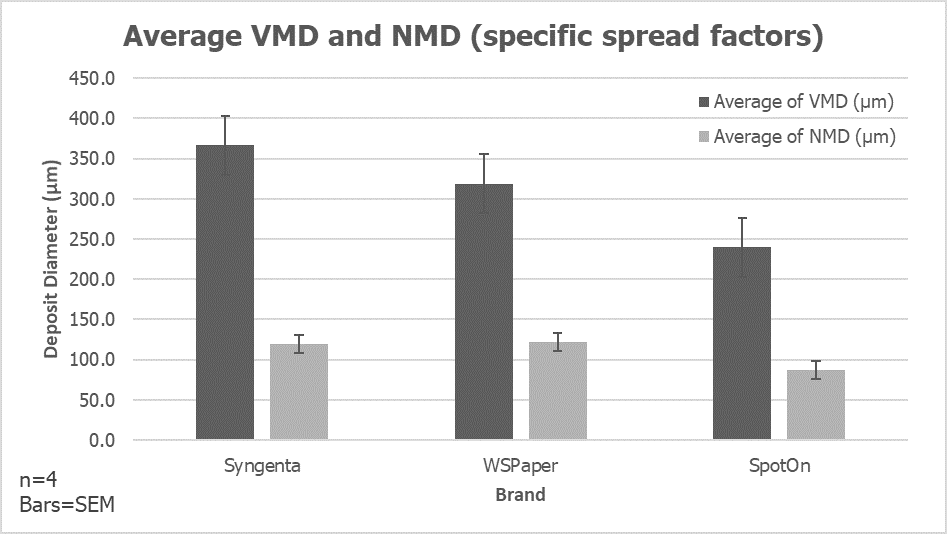
    Three brands of WSP processed by DropScope using their specific spread factors. VMD differed by as much as 30%.

    SY produced a VMD higher than that of WS, and both were higher than SO. There was less variability in the NMD, but this was expected given the high droplet count on the finer side of a hydraulic nozzle’s droplet size spectrum.

    Conclusion

    Water sensitive paper has immeasurable value in agricultural spraying. It is far more important to encourage its use than to quibble over brands. However, when these tools are used for more rigorous evaluations of spray coverage, brand-specific variability must be addressed.

    The differences in how each brand responds to moisture (i.e. discolouration and deformation) may factor into which brand is most appropriate for a given situation. Further, there appear to be significant differences in how each brand resolves coverage. Once again, this may be irrelevant for those spray operators who occasionally use WSP to inform their spraying practices, but for consultants and researchers it is suggested that they use a single brand for an experiment, with papers produced in the same batch run.

    Syngenta, Spraying Systems Co., SprayX, WSPaper and Innoquest are gratefully acknowledged for their contribution of materials and time informing this article.

    2026 Update

    If there’s one thing that stays the same, it’s that nothing stays the same. Formulations and manufacturing processes change. According to SprayX, manufacturers of the DropScope, all three of the papers described in this article (written in 2021) have changed in recent years. Some have improved and others can create potential errors in digitizing coverage. The following points may require a deeper understanding of how WSP is digitized and analyzed. Refer to this series of three articles.

    Be aware of the following best practices when using WSP:

    • Be aware of package expiration dates. Expired paper will work differently from new paper, creating an artifact in analysis.
    • Papers with bright, reflective surfaces can cause an underestimation of deposit counts (specifically the smallest deposits).
    • Best results are obtained when using water for testing. Adjuvants and pesticide co-formulants have minor impacts on spread, but can also change the how the paper changes colour, making thresholding difficult.
    • Beware papers that create stains with bright borders and faint (hollow) centres (see image below). This can lead to an underestimation of volume median diameter. If your camera or scanner permits, examine the coverage in binary (e.g. black and white) for more accurate results.
    • Do not sample the edge of the WSP (leave at least a mm) to avoid edge effects such as wicking and partial impacts. Some scanners have a setting, or you can select the area manually.
    • Note the physical shape of the paper itself. Inconsistencies in the length and width (cutting errors) can make papers difficult to use in certain scanners, and curled papers cause changes in perspective and focal distance that can lead to errors.
    • When not using a sealed camera or scanner (e.g. DropScope or flatbed), changes in the camera angle, shadows, lighting conditions, and make/model of cellphone camera will affect the results. Be consistent.
    Stains with faint centers may not register correctly with some software. This could be due to adjuvants in the liquid, or issues with the coating itself. Other issues might include inconsistent coatings that are either too thick or to thin affecting the reaction to water.
  • Angled Spray Nozzles in Wheat

    Angled Spray Nozzles in Wheat

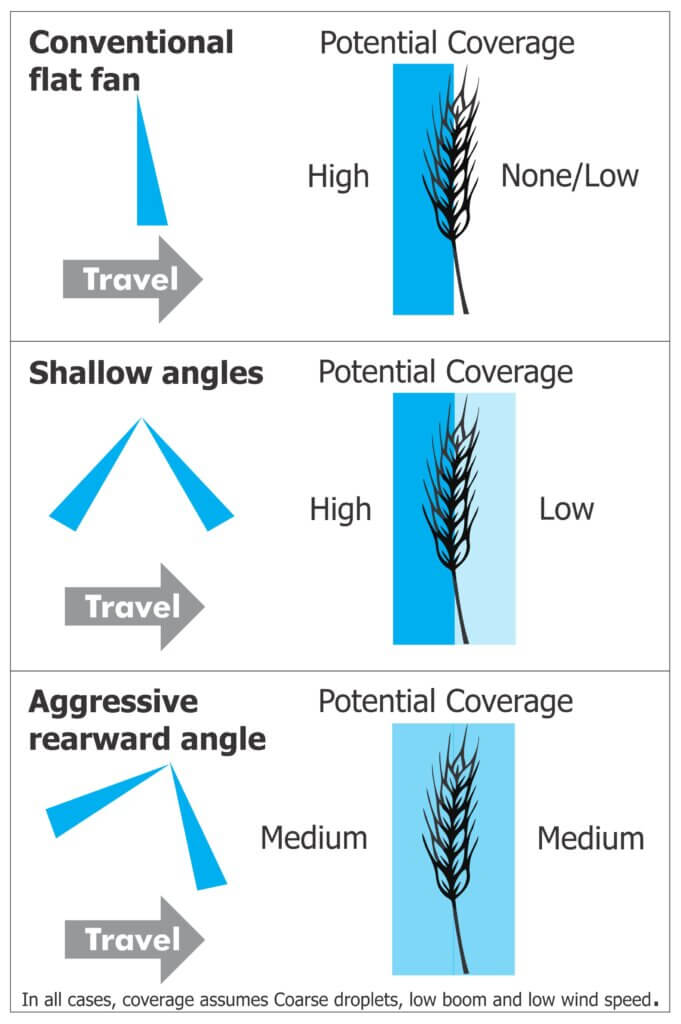
    When T3 wheat rears its head, the first rainy day brings questions about spray angles. Let’s begin with a graphic that illustrates how angled sprays cover a vertical target like a wheat head. Assuming moderate wind and sufficiently large droplets, this is a simplified depiction of what we would expect to see.

    But is this how the nozzles actually perform? Are dual angles really better than a single fan with an aggressive angle? We hoped to answer these questions when we demonstrated a selection of dual fan nozzles at Canada’s Outdoor Farm Show in 2013. But it was a very windy few days and what we saw was that regardless of the nozzle, most of the spray tended to deposit with the wind.

    A 10 km/h wind will easily deflect Medium-and-smaller droplets and at 20 km/h all but the coarsest spray is deflected. This leads to non-uniform deposits and unacceptable levels of drift (yes, even through it’s a fungicide and you have lots of acreage.) To learn more, we turned to the literature to review studies performed in Ontario and Saskatchewan.

    Wolf and Caldwell

    In 2002, Dr. Tom Wolf and Brian Caldwell experimented with fan angles. They evaluated the impact of nozzle angle, travel speed, and droplet size on the “front” (facing the sprayer’s advance) and “back” (sprayer’s retreat) of vertical targets. They ran three laboratory experiments: spray configuration (single vs. double fan), travel speed (7.6 and 15.2 km/h) and spray quality (conventional versus air-induced droplets) using TeeJet XR’s and Billericay air bubbles at a rate of 175 L/ha. Here’s what they observed:

    • Larger, air-induced droplets produced higher average deposits than smaller, conventional droplets.
    • Twin fans improved overall average deposit compared to single fans.
    • Building on the first two points, twin air-induction fans improved overall average deposit versus conventional twin fans, and also improved deposit uniformity (i.e. coverage on the front versus the back of the vertical targets).
    • Higher travel speeds improved overall average deposit, but at the cost of reduced uniformity as the rear-facing target received reduced coverage (particularly in the case of conventional droplets).
    • Spray angle did not impact coverage from conventional tips, but increasing from 30 to 60 degrees improved coverage for AI tips.

    While the coverage data was compelling, growers were not reporting improved efficacy with the improved coverage. The authors felt there were confounding variables like crop susceptibility, disease pressure and product effectiveness. Their conclusion was that applicators should strive for improved coverage, but only after integrated pest management (IPM) criteria such as product choice, crop staging and application timing are satisfied.

    Hooker and Spieser

    In 2004, Dr. David Hooker (University of Guelph) and Helmut Spieser (OMAFRA) started exploring nozzle configuration and sprayer set-ups to optimize Folicur applications in wheat. For several years they ran field trials exploring panoramic wheat head coverage. That is, not only the front and back of the wheat head, but the sides as well. Ten different nozzle configurations were used:

    • TurboTeeJets mounted in dual swivel bodies (backwards and forwards)
    • AirMix air induction nozzles mounted in dual swivel bodies
    • Air induced Turbo TeeJets mounted in dual swivel bodies
    • Single Turbo TeeJets angled forward or angled backwards
    • Single Turbo FloodJets angled forward or angled backwards
    • TwinJets
    • Single Hollow cones
    • Turbo TeeJet’s mounted in Twincaps
    • Turbo TeeJet Duos
    • Single Turbo FloodJets alternating forward and backwards

    They explored boom height (0.5 m and 0.8 m above the crop), travel speed (10 km/h and 20 km/h) and application volume (93.5 L/ha and 187 L/ha). Here is a summary of their findings:

    • Travel speed did not appear to impact overall coverage.
    • Spraying higher volumes improved coverage.
    • Lowering the boom improved coverage.
    • Coverage from conventional flat fans and TwinJets gave ~15-18% coverage and 22-26 mg of copper was deposited per m2, but alternating Turbo FloodJets gave ~29% coverage and deposited ~37 mg copper per m2.
    • The highest percent coverage was obtained using Turbo TeeJets or the AirMix tips mounted in dual swivels (~26% coverage), or single Turbo Floodjets alternating forward and backwards (34% coverage) as long as the spray was not obstructed by the boom structure itself.

    Hooker and Schaafsma

    A few years later, Dr. Hooker and Dr. Art Schaafsma worked with OMAFRA to explore efficacy. DON is a mycotoxin that may be produced in wheat infected by Fusarium Head Blight (FHB) or scab. There is an indirect relationship between wheat head coverage of fungicide and the reduction of FHB and DON: The higher and more uniform the coverage (with the right timing) the lower FHB and DON.

    In two field experiments they performed in 2008, DON values in the untreated checks were around four parts per million. DON was reduced by an average of 22.5% using a single flat fan, 23.0% using a TwinJet and 41.5% using alternating Turbo FloodJets when averaged across two fields, two fungicides and four reps (n=16). They all reduced DON significantly. There was no statistical difference between singles and twins, but control from the alternating Turbo FloodJets was significantly better.

    The Return of Wolf and Caldwell

    Then, in 2012, Tom and Brian evaluated the new asymmetrical twin fan nozzles from TeeJet. The marketing claimed they could improve overall coverage at higher travel speeds because they decrease the contribution of the front-facing fan and increased the angle of the back. Tom and Brian’s lab-based experiments determined that:

    • Asymmetricals increased overall deposit amounts and uniformity versus single fan and symmetrical twin fans.
    • Nozzle orientation (alternating or not) seemed unimportant.
    • As suggested earlier, boom height was a big factor in coverage. Nozzle angle didn’t improve coverage when the boom was too high, but spray deposit increased significantly when the boom was lowered.
    • Coarser spray droplets have more momentum, so they can travel greater distances on their original vector. A coarser spray quality is the best choice for any angled fan.

    Water volumes and FHB

    Let’s address the notion that high water volumes might increase Fusarium Head Blight (FHB). This is a hypothesis that seems to have resonated with growers. Dr. David Hooker ran trials where he tried to favour FHB by spraying 40-50 gpa of water multiple times per day (even up to 100 gpa). There was no pathological impact (personal communication).

    Consider that 1″ of rain is the equivalent of 2,715 gpa of water. Raising your carrier volume from 15 gpa to 20 gpa is the equivalent of 0.000184″ of rain. Admittedly, it’s all aimed at the wheat head, but it’s still a tremendously small volume. While studies have shown a diminishing return in coverage at 30 or 40 gpa, spraying with 20 gpa appears to be a safe way to improve coverage significantly.

    Learn more about early morning spraying here, and a more in depth discussion of spraying when there is dew here.

    PWM

    What if you’re running a PWM system? Sizing for PWM requires the tip be sized about 20-40% more than if you were running a conventional sprayer. In other words, at expected travel speeds, the pulsing duty cycle should be approximately 60-80%. Nozzles that are permitted on PWM sprayers are limited and the angled fan selection for PWM is, at the time of writing, more so. It requires some experimenting. The following list uses the JD Exact Apply as an example system, and it is not exhaustive. We’re always looking for new ideas.

    1. 3D90 (the original 3D is arguably too misty) in the A or B positions, alternating front and back <or> in both A and B positions. This tip may not be readily available in North America.
    2. LDT (Low Drift Twin) which is two LD tips installed in a Twincap (twin 30° angles) in position A or B.
    3. LDM (Low Drift Max) which is two LDM installed in a Twincap in position A or B. This tip only goes down to an 03.
    4. The Deere 40 degree angled adaptor (developed for See and Spray) can be used to convert any PWM-compatible nozzle into an angled spray.
    5. GAT (GuardianAir Twin) is an air-induced tip, running in conventional “A” mode or in Auto Mode but sized for “B”. Avoid operating in A and B to prevent pattern interference.
    6. Wilger Wye Adaptor with SR nozzles. This does cause tips to drop below the boom frame but is a versatile option.
    7. Wilger Dual Angle Max. More compact than the wye adaptor, this asymmetrical assembly (30° fore and 50° aft) prioritizes Coarse spray.
    8. TeeJet Accupulse TwinJet.
    9. Greenleaf Blended Pulse Dual Fan Assembly.

    Summary

    So here’s what we can say based on all this research:

    • Higher volumes improve coverage (significantly up to ~200 L/ha or 20 gpa). Can you go to 30 gpa? Yes, and it will likely improve coverage, but it’s a diminishing return and at some point you will incur run-off.
    • When using angled sprays, coarser droplets improve vertical coverage. Compared to finer droplets, they move faster, survive longer (i.e. resist evaporation) and are less likely to be deflected by wind.
    • Maintaining the lowest operable boom height improves coverage from angled sprays. We want 100% overlap at target height, and with angled sprays that means getting pretty close. Aim for the highest wheat heads and not the tillers. If you’re 2′ away, you’re likely too high.
    • Symmetrical fans with shallow angles (e.g. 30°) improve coverage uniformity on vertical targets versus single fans, and a steeper backward-facing angle (e.g. 70°) improves coverage even more on the sprayer-retreat side.
    • Travel speed may or may not affect coverage, but slower speeds do facilitate lower booms, which do improve coverage.
    • Timing, weather and product choice are likely the most critical factors.

    Angled sprays may offer some advantage in other situations, but they are primarily intended for panoramic coverage of vertical targets.

    Short videos about dual fans

  • Beluga Drop Hoses in Corn: Utility and Return on Investment

    Beluga Drop Hoses in Corn: Utility and Return on Investment

    In 2019 we evaluated the spray coverage from nine application methods on corn silks. The results showed that a directed application from drop hoses (aka drop pipes, drop legs) suspended in between the rows gave significantly higher deposits. The results led us to wonder if the superior coverage from a directed application translated to improved yield.

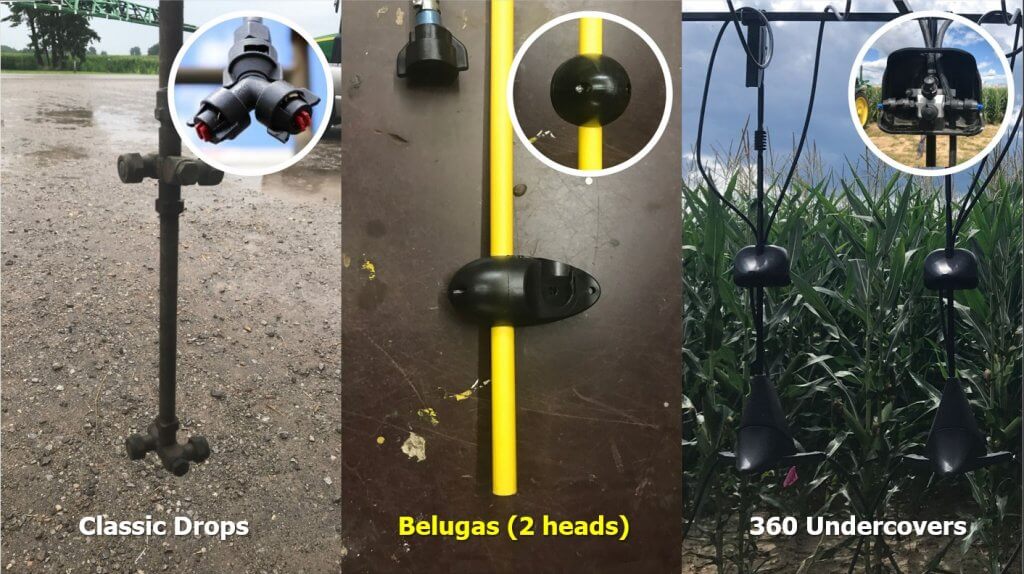
    Around this time we started considering the Beluga Drop Hose developed by Agrotop (Germany) and distributed by Greenleaf Technologies (USA). Originally designed to apply neonicotinoids in canola, we found that the stiff-but-flexible hose did not tend to deflect or sway during an application. Further, their unique low-profile nozzle body had less potential to cause mechanical damage or otherwise snag in dense canopies. Unlike homemade drop pipes or other commercial solutions such as the Y-Drop with 360 Undercover, the Belugas were lightweight, simple to install/remove, and did not need a break-away section to prevent damage.

    Three examples of directed application systems. Left: Homemade drop pipes and a TeeJet QJ90-2-NYR split nozzle body (inset). Centre: Beluga drop hose with streamlined nozzle body (inset). Right: Y-Drop side-dress drop pipes with Yield 360 Undercover option (inset).

    In 2021 we initiated a four-year trial with the Beluga drop hose system in Port Rowan, Ontario. Our objective was to evaluate return-on-investment based on yield using two pesticide regimes. Treatments were established for conventional overhead technology, directed applications (i.e. the Beluga) and unsprayed checks.

    Construction and Installation

    We ordered 150 cm (60″) drop hoses with two nozzle bodies each so we could customize them. The instructions were in German, but after running them through translation software we were confident in how to proceed (download the translated copy here). We started by determining the hose length.

    Hose Length and Boom Spacing

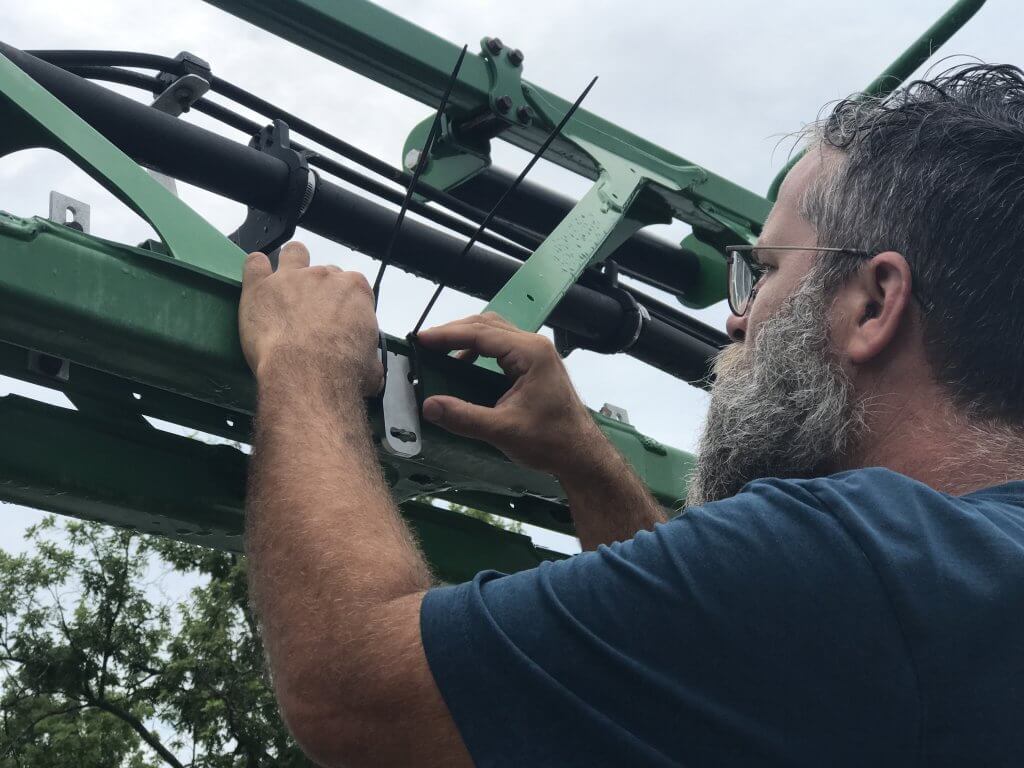
    We started by temporarily fixing the mounting plates to the boom using quick ties because we wanted to ensure they did not interfere with boom folding. The drop hose quickly and easily “keys” into the plate allowing it to swing freely and find plumb. The corn was planted on 76 cm (30″) spacing so we aligned the plates with the alleys to permit the drop hoses to move between the planted rows. Each hose is plumbed to the nearest nozzle body via a quarter-turn quick-connect coupler.

    Temporarily attaching mounting plates every 30 inches to correspond with corn alleys. The Beluga keys into the mounting plate and is then plumbed into the sprayer via a quarter-turn quick-connect coupler that attaches to the nearest nozzle body.

    The drop hose had to clear the ground but still be long enough permit nozzle bodies to span the target region in the canopy. We later learned to cut the excess hose closer to the lowest nozzle body. This eliminated a source of pesticide collection (like a boom end) and prevented them touching the ground and “walking” as occasional contact would cause them them to flex and leap forward.

    Target Zone and Nozzle Body Spacing

    Before we could permanently install the nozzle bodies on the drop hoses, we had to decide what our target was. This required us to establish a primary coverage zone within the corn. Dr. David Hooker (University of Guelph) experimented with directed sprays (triazoles) and leaf disease control in the 2010’s. Dr. Hooker noted that leaf diseases were controlled above the ear to the flag leaf, and postulated it may be due to xylem mobility (i.e. acropetal movement) of the fungicides used at the time. This concept warrants further investigation with modern fungicides, especially with the need to control tarspot and reduce DON risk in SW Ontario.

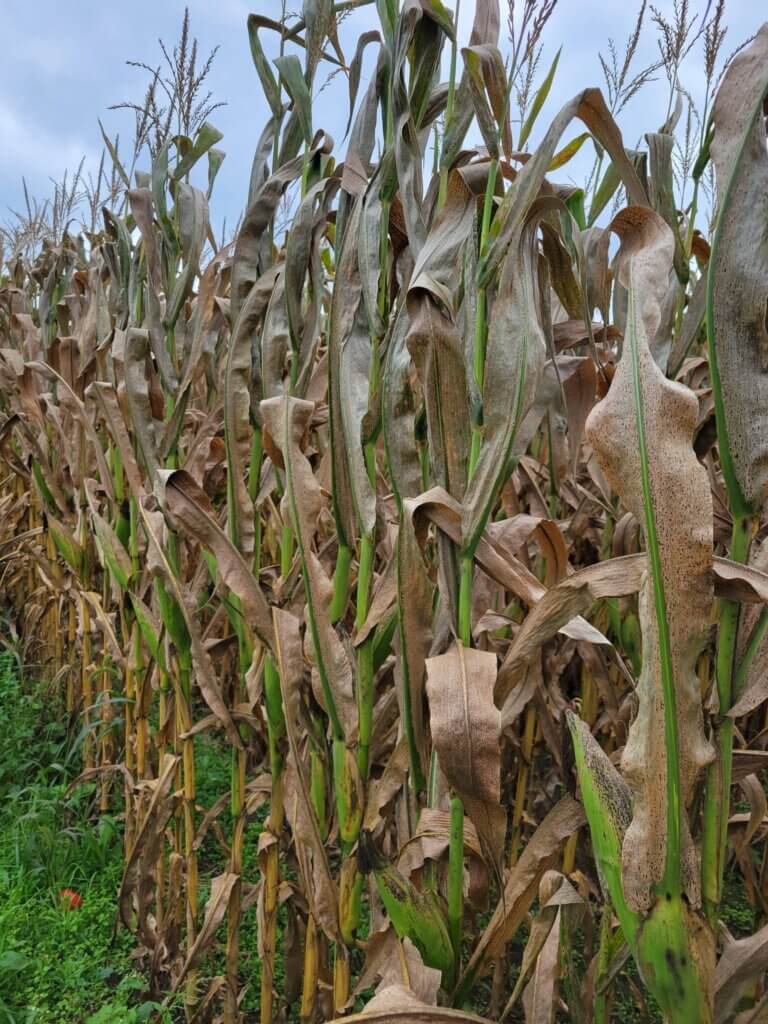
    Tarspot in corn – Southwest Ontario, 2023

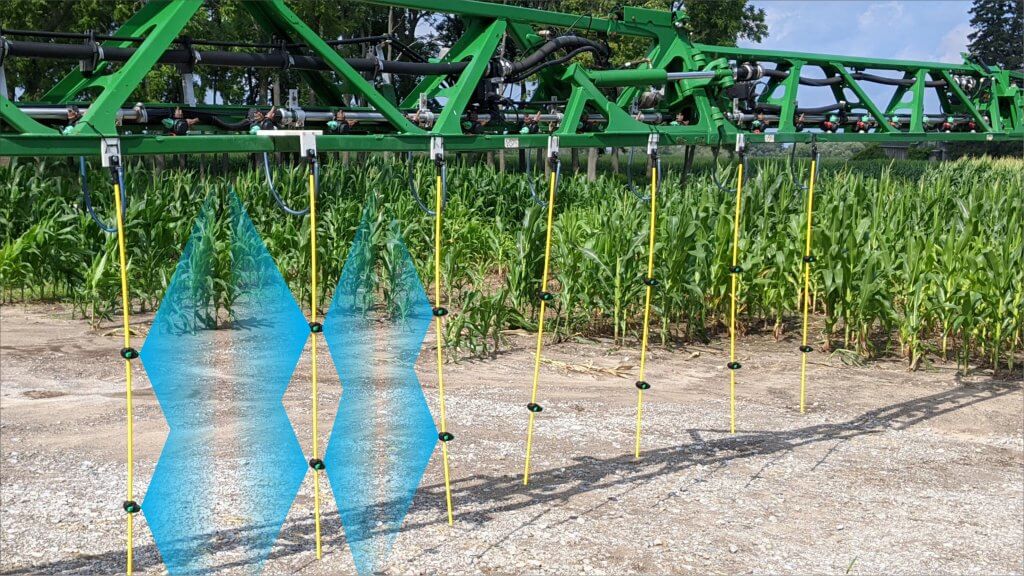
    Given that the nozzles would be about 38 cm (15″) from the stalk, we elected to use 110° flat fan nozzles on two nozzle bodies spaced 50 cm (20″) apart to increase the swath. Our objective was to protect against foliar disease, so the bottom nozzle was aimed approximately at the ear (for silk coverage) and the upper nozzle covered the higher foliage without being so high as to spray out of the canopy. Between gravity, the wake of the drop hose, and the initial angle of the spray, all surfaces received some degree of spray coverage no matter their orientation or depth. This was later confirmed using fluorescent dye.

    It has been suggested that this target zone may not be ideal for all hybrids, and that an overhead component should be included. However, we felt this was the most efficient distribution of the spray given Dr. Hooker’s observations and the results from the 2019 spray coverage work referenced earlier.

    Each drop hose was suspended on 76 cm (30″) spacing to correspond with the centre of each alley. Nozzle bodies were spaced 50 cm (20″) apart to cover the primary target zone within the canopy. The outer two drop hoses only had inward-facing nozzles to contain the treatment. We later cut the excess hose closer to the lowest nozzle body.

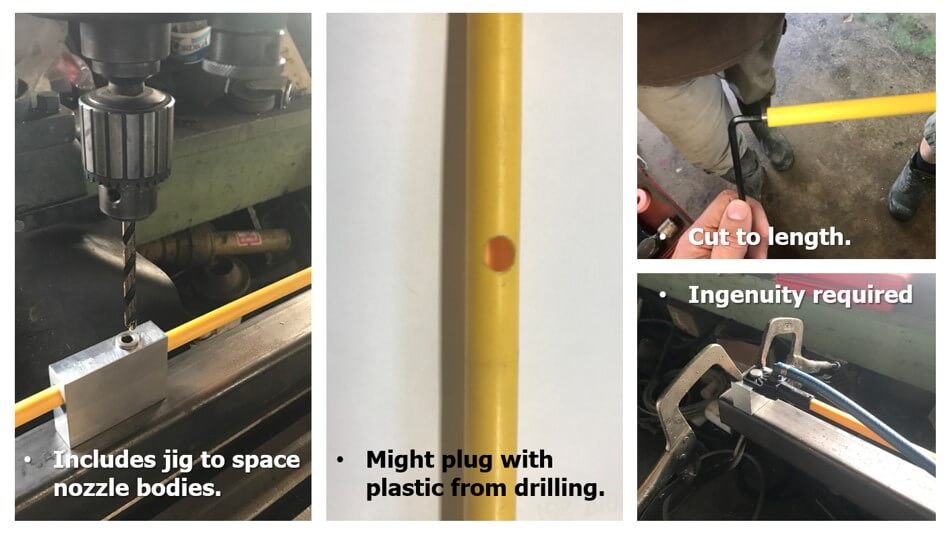
    Using the jig provided, we drilled holes for the two nozzle bodies. Then we blew-out the hoses to clear them of any plastic shavings that could plug nozzles. The hoses were cut to length and the end plug was installed with a hex key. Once we found a rhythm, the assembly went quickly and easily. Expect assembly and mounting to take a day.

    Customizing the hose length and nozzle spacing. We built our own clamping jig to hold the pipes steady.

    Plot Design, Sprayer Set-up and Chemistry

    The study took place on 11.3 ha (28 acres) spanning two fields. The corn variety was Pioneer P0720AM, which has a Gibberella Ear Rot rating of 4. Four overhead treatments, four directed treatments and four unsprayed checks were arranged in a random block design for each of two fungicide regimes (n=8 for each treatment per year). Each treatment area was between 1.05 and 1.10 acres..

    The sprayer was a self-propelled John Deere R4038 with a rear-mounted 36.5 meter (120′) boom. Treatments were eight corn rows wide, so the boom was nozzled to permit all three treatments in a single pass. Travel speed was between 8.85 – 11.25 km/h (5.5 – 7 mph) and the application volume was 225 L/ha (20 gpa).

    Nozzle choice is indicated in the following table. Note that after the first year, we elected to use a smaller droplet size on the Belugas; This gave the advantage of higher deposit density with little or no risk of drift from inside the canopy.

    YearBroadcast (Overhead)Directed (Beluga)Unsprayed Check
    1TeeJet AIC11005’s on 15″ centres4 Airmix 110015’s per drop on 30″ centresNozzles blocked
    2,3,4TeeJet AIC11005’s on 15″ centres4 Spray Max 110015’s per drop on 30″ centresNozzles blocked
    Treatment nozzles by year

    Two tank mix regimes were applied each year, as indicated in the following table. Tank Mix 1 was used each year. Tank mix 2 changed based on pesticide availability and the farmer cooperator’s preference. The insecticide “Delegate” (50 g/ac) was also included in each tank mix. However, there was very little evidence of the target pest (Western Bean Cutworm), so the impact of Delegate will not be discussed. Further, to keeps matters simple, we will not be discussing the relative efficacy of each tank mix in this article. Instead, the results are combined and only the application method and total cost of fungicides will be compared in this study.

    Tank Mix (Year)ProductRate (/ac )
    Tank Mix 1 (all)Miravis Neo405 ml
    Tank Mix 2 (2021)Headline AMP + Caramba303 ml + 405 ml
    Tank Mix 2 (2022)Veltyma + Proline202 ml + 170 ml
    Tank Mix 2 (2023)Veltyma DLX202 ml + 405 ml
    Tank Mix 2 (2024)Veltyma DLX202 ml + 405 ml
    Tank mix treatment rates by year.

    Qualitative Results

    Leaves

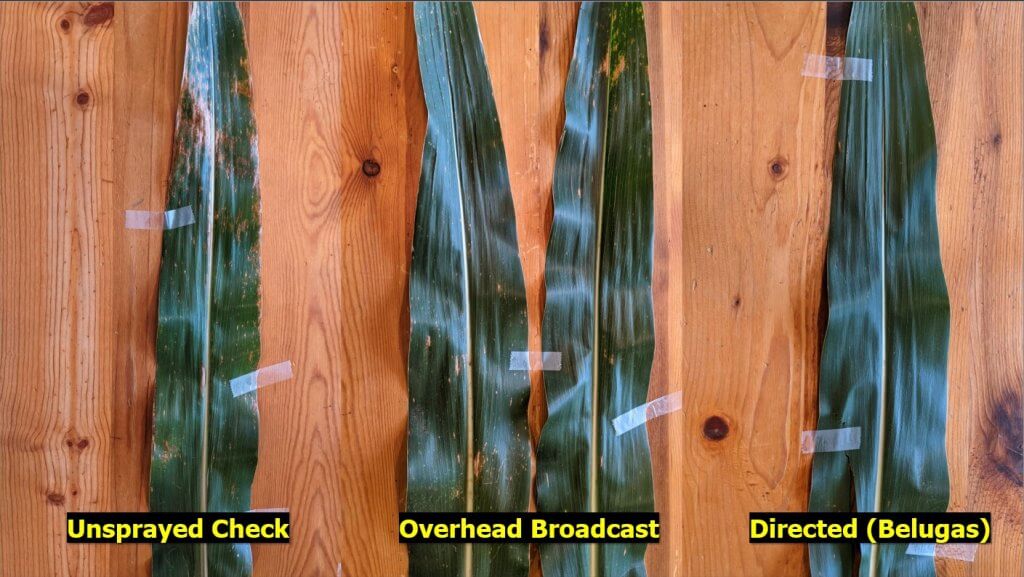
    In all four years, a qualitative comparison of randomly-selected ear leaves showed less evidence of disease in the fungicide treatments compared with the unsprayed check. Generally, there was also less evidence of disease in the Directed application treatments versus the Overhead broadcast application treatments.

    A typical random sampling of ear leaves were selected from multiple locations in the treatments. Leaves appeared cleaner in the fungicide treatments versus the unsprayed checks. Leaves from the Directed applications seemed cleaner than the Overhead broadcast applications.

    Cob Size / Quality

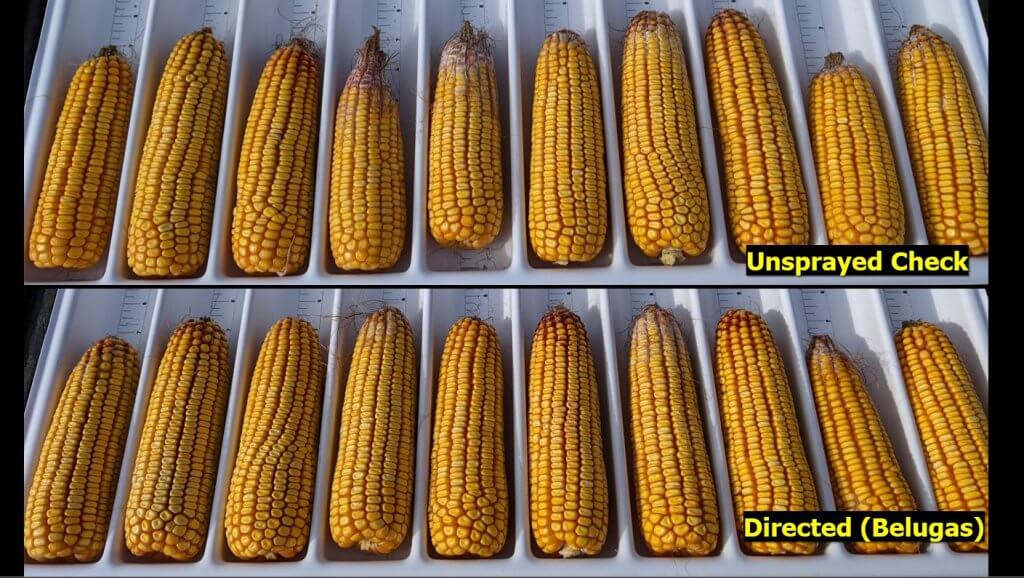
    In all four years, preliminary samples showed evidence of disease and tapered-ends in both fungicide treatments and the unsprayed checks, but trends indicated improved size and quality of the cobs from fungicide treatments. It was difficult to discern any difference between Overhead and Directed application at this stage.

    Typically, preliminary sampling showed less incidence of disease in the fungicide treatments but no obvious difference between methods of application.

    Quantitative Results

    Net Revenue

    Each treatment yielded corn with different moisture levels, so we chose not to compare bushels per acre harvested. Instead, we calculated net revenue for each year based on the current market values in the Port Rowan area. We normalized the treatment yields by moisture level and calculated their relative drying costs. Then we accounted for the other inputs (see list below) using the following formula:

    Net Revenue (CDN) = Seed Yield × Corn Sale Price – Drying Cost – Treatment Cost

    Item2021 ($)2022 ($)2023 ($)2024 ($)
    Corn Sale Price (/bu)6.008.006.506.00
    Custom Spray Cost (/ac)12.0012.0015.0015.00
    Drying Cost based on Moisture Levels (/bu)0.58-0.640.60-0.690.49-0.560.47-0.54
    Tank Mix 1 (/ac)16.6618.2418.5018.86
    Tank Mix 2 (/ac)15.7528.5222.0922.49
    Net revenue input costs and prices by year in Port Rowan, Ontario

    Averages were calculated for the eight replications for each treatment. These average yields (bu/ac), moistures and ROIs ($/ac) are presented for each treatment, for each year, in the table below. The average values of all four years are also presented in this table. With few exceptions, it always paid to spray, and the directed application produced a higher yield than the conventional overhead treatment.

    YearTreatmentYield (bu/ac)Moisture (%)Average ROI ($/ac)
    1Broadcast vs. Check-2.26+0.58-0.49
    1Directed vs. Check+3.48+0.60+20.93
    1Directed vs. Broadcast+5.74+0.01+21.42
    2Broadcast vs. Check+9.79+0.22+52.48
    2Directed vs. Check+14.56-0.04+89.14
    2Directed vs. Broadcast+4.77-0.26+36.66
    3Broadcast vs. Check+8.40-0.20+23.70
    3Directed vs. Check+22.7+0.20+117.10
    3Directed vs. Broadcast+14.4+0.40+93.40
    4Broadcast vs. Check+45.7+1.00+244.37
    4Directed vs. Check+43.7+0.80+232.09
    4Directed vs. Broadcast-2.10-0.20-12.28
    AllBroadcast vs. Check+13.40+0.40+69.07
    AllDirected vs. Check+19.60+0.40+107.00
    AllDirected vs. Broadcast+6.200.00+37.93
    Final accounting. Bold indicates a desirable outcome, while italics signify an undesirable outcome (n=8 per year).

    Return on Investment

    Given that costs changed each year, it’s not ideal to average the final costs. However, doing so gives a relative indication of the value of spraying versus spraying with overhead systems versus spraying with directed systems.

    • Directed (Belugas) vs. Unsprayed check: Profit of $107.00/ac CAD
    • Directed (Belugas) vs. Broadcast (Overhead): Profit of $37.93/ac CAD
    • Broadcast (Overhead) vs. Unsprayed check: Profit of $69.07/ac CAD

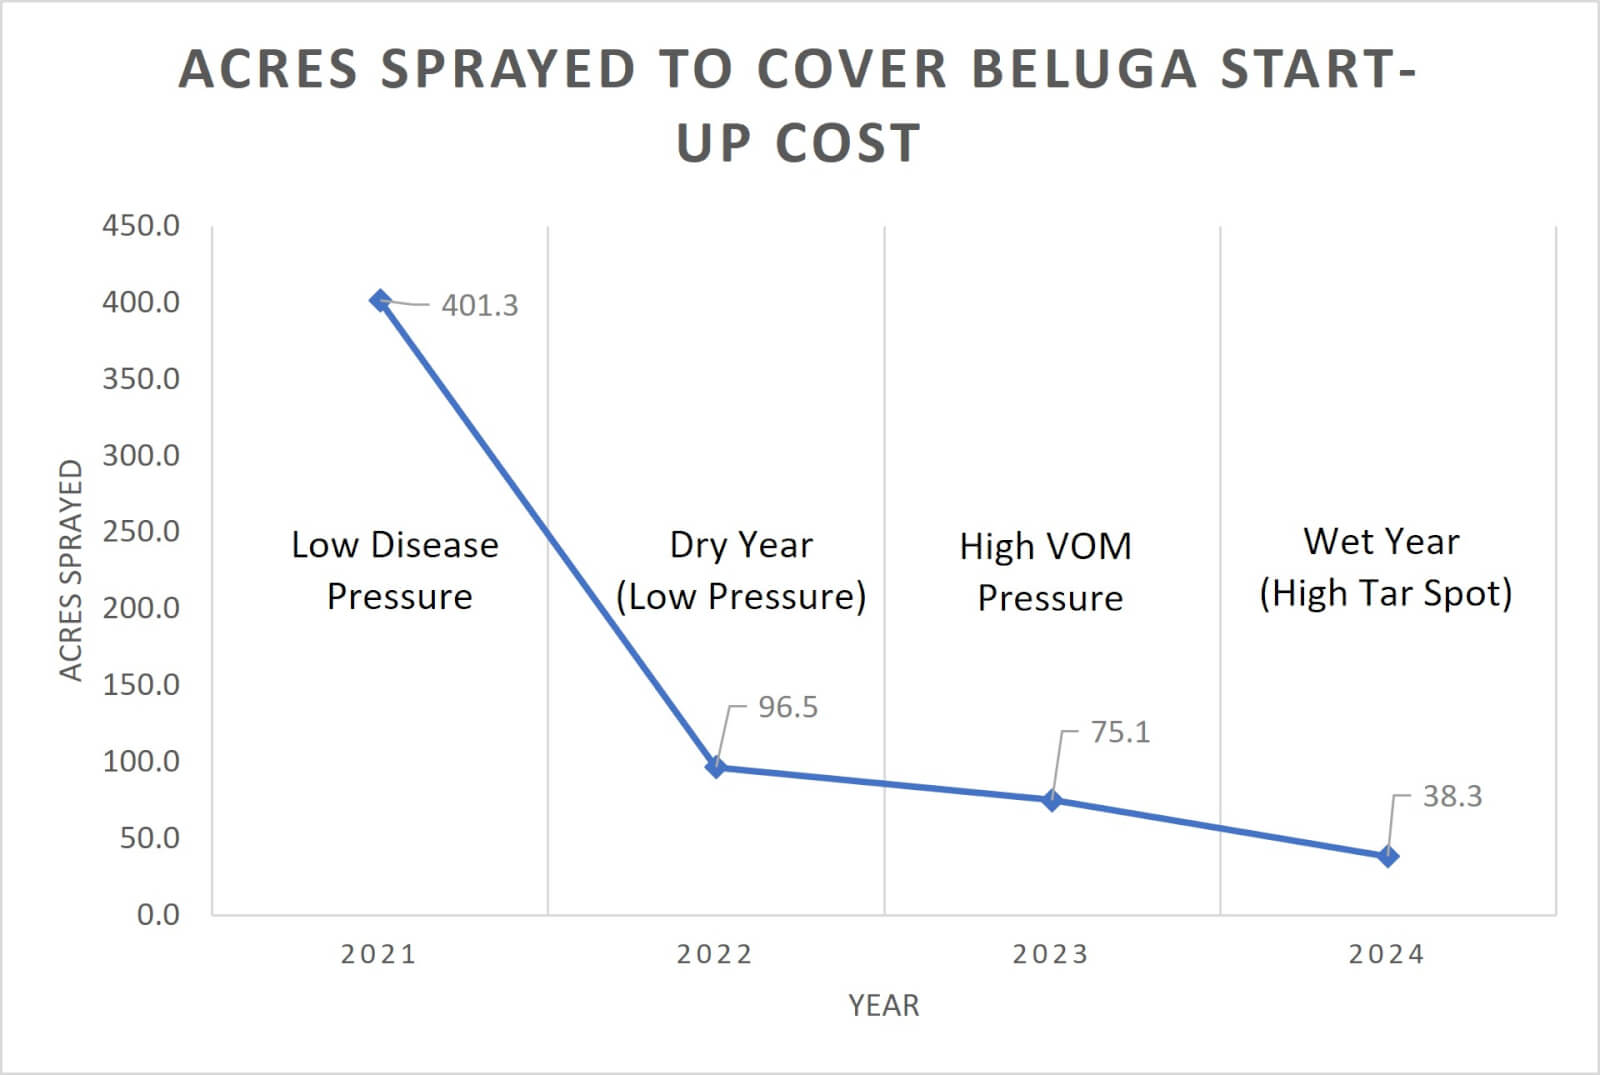
    Perhaps a more realistic review of the ROI is to calculate how many acres were required to pay for the Beluga system each year. In other words, how many acres would a grower have to spray for the profit to offset the cost of purchase? This value was different each year due to changes in costs and relative disease pressure.

    In 2021, 48 Belugas on (30″ centres) and 192 110 degree flat fans was $8,400.00 CDN. 2022: $8,600.00. 2023: $8,800.00. 2024: $8,890.00. Perhaps it was demand, or a change in dealers, or perhaps it was tariffs (or both) but in 2025: $13,500.00. Note that the break even point spanned from roughly 40 to 400 acres, but on average was less than 100 acres.

    Corn acres required to offset start up costs of the Beluga system from 2021-2024. A broad description of growing conditions and disease pressure in the test fields is noted for context. n=8 each year.

    While now a little out of date, the following video filmed by Real Agriculture discusses the return on investment based on 2021 and 2022 data.

    Mycotoxin Assays

    We submitted samples for lab analysis of mycotoxins for each treatment, annually. However there are many factors that influence ear mould pathogens, and we did not see any clear correlations between the fungicide, application method, or even the unsprayed check with the level of Deoxynivalenol (DON aka vomitoxin) or zearalenone detected.

    The Drop Hose Experience

    While cost and efficacy are key considerations, we felt it was also important to describe the utility and user-experience. This study focusses on the Port Rowan trials, but over the years several other Ontario farmers have adopted the Beluga system and reported on their experience. We have included their observations:

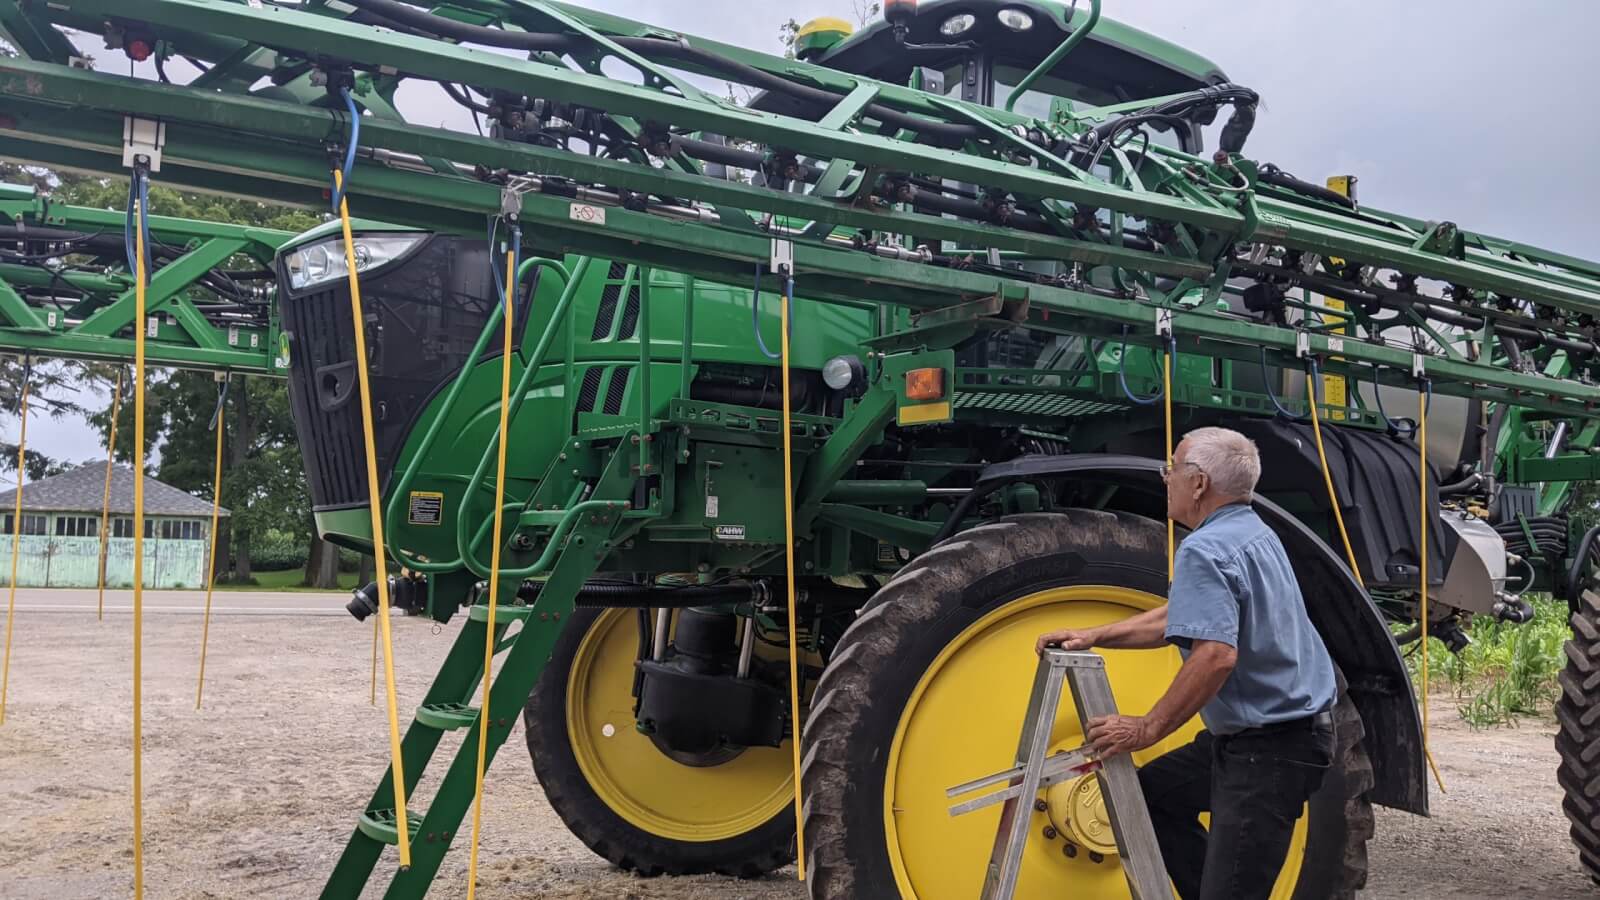
    • Installing and uninstalling the drops took roughly 90 seconds apiece, including moving the ladder.
    • Deflection was minimal, even when they were dragged perpendicular to the rows through headlands.
    • The factory mounting bracket permits the drop to be “keyed in” from either side, however this may have led to drop hoses occasionally detaching in shorter corn stands and on sharp turns. The weak point may be the plastic hose barb, which can be damaged if the drops detach from the mounting plates. Rather than the current slot positions of “9:30 and 2:30”, “11:00 and 1:00” may prevent detachment. One dealer, however, has redesigned the mounting plate and linkage to compensate.
    • Initially, it was a little unnerving not being able to see the spray but the operator quickly got used to it (see video below).
    • There was no issue folding the boom or driving between fields with the drops installed. They did note that the lugs on the front tires did contact the drops on tight turns, but adjustments were made.
    • There were issues with other sprayer types (e.g. New Holland Guardian) when folding the booms. Drops did not hang plumb during transport. One dealer developed new linkages to account for differences in boom design.
    • The drop hoses rinsed as easily as any nozzle. One dealer developed new hose-end plugs to facilitate rinsing.
    • There were initial concerns that using 015’s nozzles to maintain the target 20 gpa might cause plugging issues, but none occurred.
    • The drops were resilient. The operator bent the hoses by lowering the boom and then dragged them along the ground. They returned to plumb and appeared undamaged. One operator elected to use a NutraBoss Y-Drop mount to stiffen the top few inches of the Belugas (image below) but no other user found this necessary.
    • Once removed, the drops stored compactly and easily on a utility shelf, repacked in their original box or hung on the shed wall.

    Beluga drop hoses mounted on a NutraBoss frame

    Custom Operators

    Some custom operators have also begun to use the Beluga system and have reviewed it positively, but others question the fit. The latter feel this technology makes more sense for a home farm operation where the drops can be cut to a size that aligns the nozzles for a specific combination of boom height and corn variety. The concern is that a custom operator would have to adjust boom height (if not already maxed) or swap drop hoses to configurations that align correctly with the client’s crop. However, four years in, early adopters have collectively sprayed more than 20 different corn varieties with multiple sprayers and have had no issues reaching the target zone.

    Additionally, our study has focused on 20 gpa where some custom operators would prefer 15 gpa. Reducing volume necessitates a change in travel speed (may not be practical) or a reduction in operating pressure (may increase average droplet size). It would be inadvisable to drop from 015’s to 01’s (think plugs and misty spray).

    Both limitations translate to additional cost (currently about $2.00 CDN per acre) to a client. The value proposition becomes the added cost for an efficacious application versus the potential losses should conventional application methods fail to control devastating diseases such as Tar Spot and Northern Corn Leaf Blight.

    Adoption in North America

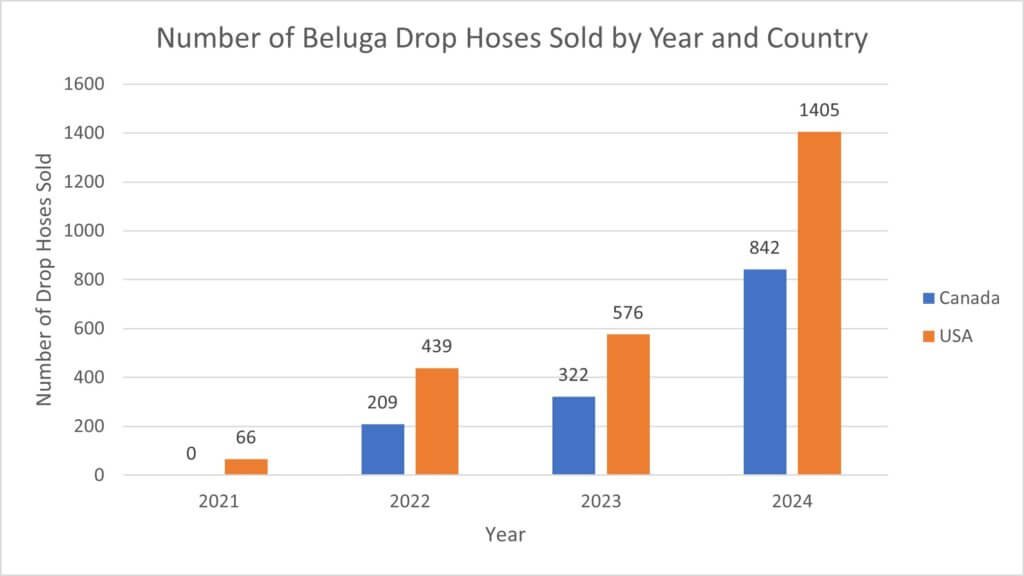
    Beluga drop hoses are distributed by Greenleaf Technologies in Covington, Louisiana and resold through dealers in the USA and in Ontario. It is not possible to determine how many sets have been sold, but if a boom is 100′ to 120′ and drops are placed every 30”, then a set would be 40-48 hoses. We started reporting on their value in corn protection in 2021. The following sales figures are annual sales (i.e. not cumulative) from Greenleaf Tech. This includes the 36″ hoses, which may or may not be used in corn. These figures will be updated annually:

    Conclusion

    With the exception of 2024, which was essentially parity between Overhead and Directed methods, we saw an annual increase in mean net revenue from corn sprayed using a directed application. The low price point, ease of use, and high rate of return make this an attractive proposition in corn production.

    Thanks to Petker Farm Ltd. and other early adopters for participating in the study. Thanks to Corteva and Syngenta for contributing the pesticides used.

  • How to Succeed with a Soil Drench Application in Strawberries

    How to Succeed with a Soil Drench Application in Strawberries

    In 2016, Ontario berry growers were surveyed to determine the typical spray volume they used to apply unspecified crop protection products. For strawberry growers (day-neutral and June-bearing), the results spanned 50 to 1,000 L/ha (~5 gpa to ~100 gpa). In an earlier survey (2013), respondents specified 250 to 650 L/ha (~26.5 to 70 gpa) for fungicides, herbicides and insecticides. Miticide applications were as high as 750 L/ha (80 gpa).

    This rather wide span of carrier volumes shouldn’t be surprising. No matter the horticultural cropping system, the choice of carrier volume reflects the operation’s unique pressures and priorities. These variables include, but aren’t limited to, operation size, spray equipment, crop varieties/staging, geography, and pest profiles. The ultimate goal is to achieve threshold coverage (i.e. efficacy) while maximizing productivity.

    However, even the highest carrier volume reported did not reach the volumes required for those crop protection products intended to drench the soil. These products can span a range of 1,200 to 2,000 L/ha (~128 to 214 gpa). Experienced matted-row strawberry growers employ different methods to apply soil drenches, and we will discuss them later in the article. But first let’s address three common factors that must be considered:

    Know the target

    If (for example) the target is white grubs in the root zone, or phytopthora root rot, then the spray should be focused at the base of the plant in a banded application. Performing a broadcast application that covers the alleys as well as the plant rows may represent wasted spray. Knowing the target can help make the most efficient use of carrier.

    Know the soil

    Soil that is compressed or has high clay content won’t soak up water as quickly as drier, looser or sandier soil. If the beds are raised and resist absorption, much of the volume will run off into the alleys. This may not be desirable if the target is the raised bed itself. The following basic water movement principles come from the Manitoba Agriculture, Food and Rural Initiatives Soil Management Guide.

    • Water flows more quickly through large pores (sandy soils) than small pores (clay soils); water is held more tightly in small pores (clay soils) than in large pores (sandy soils).
    • Water moves from wet areas to dry areas (not necessarily by gravity) due to forces of adhesion and cohesion. This is called matric flow.
    • Water will not move from small soil pores to large soil pores unless conditions are saturated.

    Know the weather forecast

    Spraying on a hot, dry day means a higher rate of evaporation. As the carrier evaporates, the product will have less opportunity to infiltrate the soil. Conversely, applying product just before a heavy rain can result in a much diluted product being rinsed too deeply into the soil and beyond the target area.

    Consider that one millimetre of rain on one hectare of land is 10,000 litres. That seems like a lot, but how deeply does it infiltrate into soil? One way to know is to use calculations based on soil porosity and bulk density. From these calculations it can be generalized that 25 mm of rain will infiltrate 45 mm into dry, sandy soil, but only 32 mm into dry clay soil. Remember, that 25 mm of rain represents 250,000 L/ha!

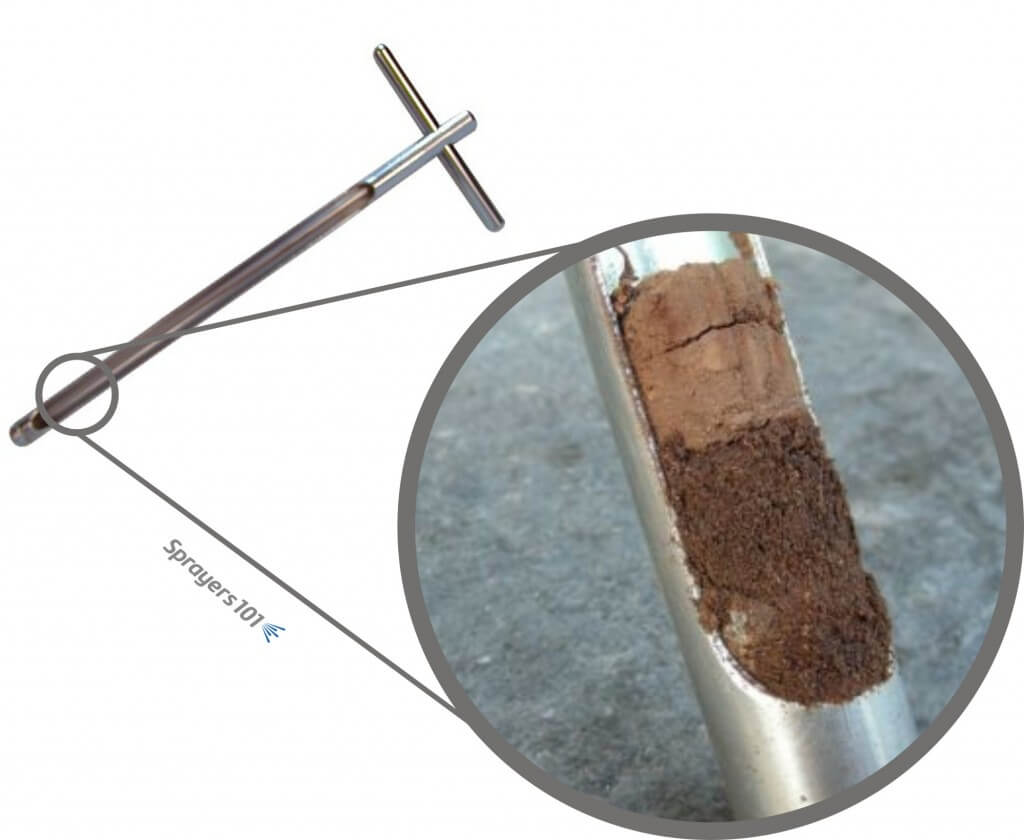
    Perhaps the best way to know how far water will infiltrate the soil is to use a soil probe (aka soil sample tube). They can be purchased from local dealers for about $100.00 CAD, or they could be borrowed from whomever provides soil sampling services in the area. For the best results, perform this test in multiple locations in the field.

    The soil probe. See how far water infiltrates soil by taking core samples.
    The soil probe. See how far water infiltrates soil by taking core samples.

    So what methods do strawberry growers employ to apply a drench? Here are the top three:

    1. Slow down

    Some growers elect to use their existing sprayer setup, but they slow down to get more volume on per hectare. For example, if the grower normally applies 500 L/ha (53.4 gpa) driving at 5 km/h (3.1 mph) they would have to drive 1.25 km/h (0.78 mph) to achieve the 2,000 L/ha some labels require. If the sprayer tank held 1,500 litres (~400 US gallons) that would mean doing 0.75 hectares (1.9 acres) to a tank compared to the normal 3 hectares (7.5 acres). That would be four times as long, without considering the time for the extra refills.

    Alternately, but related to slowing down, is double-pass spraying. In this case the tank is mixed at half-rate and the operator makes a pass through the field. Then, a second half-rate tank is applied immediately afterwards, ideally driving from the opposite direction. This effectively gives a full rate of product in a higher volume of water.

    2. Re-nozzle

    When slowing down is not enough (or not an option), some growers elect to re-nozzle. It may be tempting to increase the operating pressure to increase output on existing nozzles, but that makes finer droplets which tend to drift off target. The largest hollow-cone nozzles will only emit ~870 L/ha at 5.0 km/h (93 gpa at 3.1 mph) and that’s at 125 psi, which many trailed sprayers cannot manage. Further, many labels indicate a need for Coarse droplets in a drench, and hollow cones cannot produce such large droplets.

    There are a limited number of flat fan nozzles that can achieve sufficiently high rates, and even then they must be used at slightly slower travel speeds. For example, the TeeJet AI11008 used at 70 psi will apply 145 gpa (~ 1,350 L/ha) with a Very Coarse spray quality at 4 mph (6.4 km/h). Driving slower can rise those volumes considerably. Alternately, streamer nozzles (e.g. TeeJet’s 5 or 7 hole StreamJets) require lower pressures (up to 60 psi) to emit as much as 2,310 L/ha at 5.0 km/h (247 gpa at 3.1 mph). The grower can maintain their travel speed, but will still have to refill more often.

    3. “Wash In” the spray

    Still another choice is to apply the product using the existing sprayer set-up, using a typical carrier volume, just prior to a rain event or sprinkler (not drip line) irrigation. For example, if the grower normally applies 500 L/ha (53.5 gpa), they would continue to do so. If the grower is relying on rain to wash the product in, it should be sufficient precipitation to move the product to the desired soil depth. Where sprinklers are an option, this can be controlled, and the depth of infiltration tested with a soil probe. Washing in the spray should take place as soon after application as possible to ensure the product is distributed evenly into the soil.

    Thanks to Pam Fisher, former OMAFRA Berry Crop Specialist, and Anne Verhallen, former OMAFRA Soil Management Specialist, for their contributions to this article.

  • Evaluating Wheat Head Coverage from Two New Nozzles

    Evaluating Wheat Head Coverage from Two New Nozzles

    We’ve written extensively about angled flat fan nozzles and their ideal operating parameters (i.e. pressure, boom height, droplet size, volume and travel speed) for spraying wheat heads. Generally, coverage on the sprayer-approach side of a wheat head (aka the advance side) is easier to achieve because droplets from a conventional flat fan geometry tend to follow a downward-forward vector. Imagine dropping a ball from the window of a moving car. An outside observer would see it travelling forward as it fell.

    The back of the wheat head (aka the retreat side) and the sides are harder to hit. When we introduce a rearward angle to coarser, fast-moving droplets, the high momentum and downward-rearward vector deposits spray on the retreat side of the wheat head after the sprayer passes over. Mythbusters produced a cool video segment that illustrates this concept by matching the rearward velocity of a soccer ball to the forward velocity of a truck; the ball falls straight down. Of course, in our case we want it to shoot backwards.

    A great deal of independent research has determined that low booms coupled with dual fans that produce coarser spray and higher volumes will optimize coverage on any vertical target. Asymmetrical nozzles that have a more aggressive rearward angle perform better still. Of course both of these claims assume a “reasonable” wind speed, because the finer droplets in the spray experience a comparatively lower degree of inertia. Inertia is a property of matter that describes the resistance of an object to changes in its state of motion and it’s related to the object’s mass. What this means is that smaller droplets slow quickly, are easily deflected by wind, and tend to deposit on the windward side of the wheat head.

    So, maybe you already knew all that. What’s new?

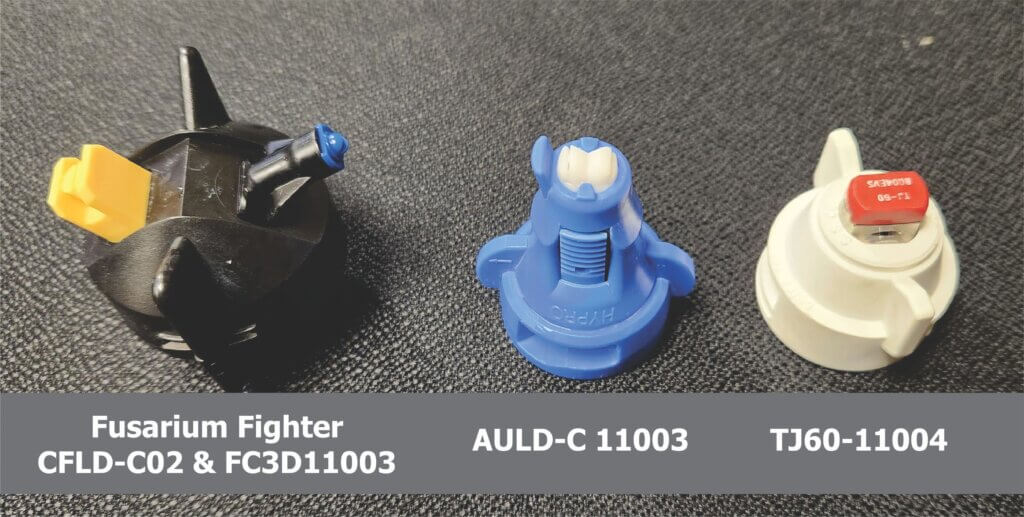
    Two asymmetrical tips have been introduced in recent years and we wanted to characterize their coverage (Figure 1).

    The first is the “Fusarium Fighter” which is a combo-tip developed by Nozzle Ninja in Stettler, Alberta. It combines Pentair Hypro’s FC-3D100 (a non-AI tip with a 2 star rating from LERAP and a 100° wide fan) with ASJ’s, Compact Fan Low-Drift Coarse with its 120° wide fan. The 3D already has a 55° angle from vertical and the twin cap brings that to a very steep 65°.

    The second is Pentair Hypro’s Asymmetric Ultra Lo-Drift AI Ceramic. This is the same as the Lechler IDTA where the front angle is 120° wide, angled 30° forward from vertical and sprays 60% of the spray volume. The rear fan is 90° wide, angled 50° back and sprays the remaining 40%.

    Finally, and only to illustrate how symmetrical fans and finer droplets are perhaps not ideal for reliable wheat head coverage, we ran TeeJet’s TwinJet Twin TJ60-110VS. This is two 110° flat fans and the angle between them is 60° (30° fore and 30° back from vertical).

    Figure1. Evaluating coverage from three nozzles in winter wheat.

    For each treatment, five nozzles were positioned mid-boom on a Deere 410R to minimize any turbulence from the sprayer wheels and chassis and to reduce the degree of yaw. Extensions were used on all tips to ensure the spray did not impact the boom itself. All other nozzles were turned off. Nozzle bodies were on 50 cm (20″) centres and positioned 50 cm (20″) above the average wheat head. Travel speeds were selected to achieve 187 L/ha (20 gpa) at a pressure ideal for the tip in question and this is recorded in Table 1. Contractors and other such custom applicators may find these speeds low and the volumes high, but in this study we chose to emulate usage in smaller operations. The effect of travel speed on coverage is debatable but likely quite minor. More can be found on the subject in this article.

    NozzleSpray QualitySpeed Pressure
    AULD-C 11003C6.6km/h (4.1mph)483kPa (70psi)
    FF (CFLD-C02 & FC3D11003)VC & M8km/h (5mph)207kPa (30psi)
    TJ60-11004F8km/h (5mph)207kPa (30psi)
    Table 1. Operating parameters for three nozzles applying 187 L/ha (20 gpa) to wheat heads.

    The weather was 25°C, 40% R.H. and there was a very light and consistent tail wind of 2-4 km/h (1.2-2.4 mph). These were ideal conditions because it was not hot or dry enough to evaporate finer spray appreciably, and not windy enough to deflect the spray.

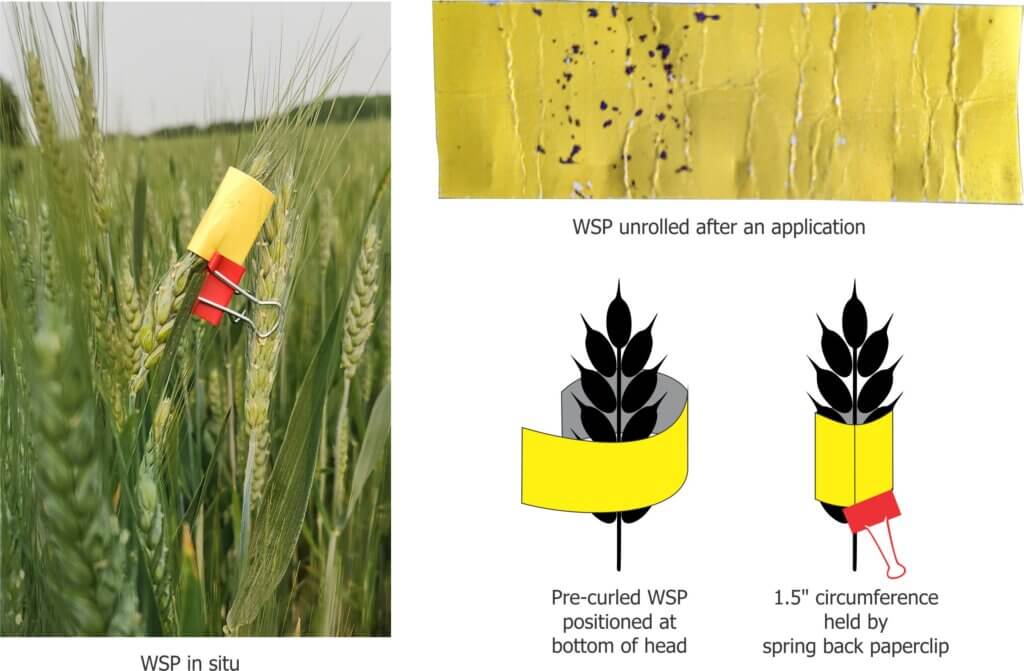
    Water sensitive paper (Syngenta) was wrapped around the wheat head and held by a paper clip (see Figure 2). This gave a panoramic representation of coverage. Two more were mounted nearby on a length of rebar at wheat head-height; One faced the sprayer advance and one faced the retreat. Three such sets were positioned inline, spaced about 1 m apart and centered on the swath produced by the five nozzles. This was repeated 2x for each nozzle. Papers were retrieved, digitized and analyzed per the method described in this article.

    Figure 2. WSP wrapped around a wheat head.

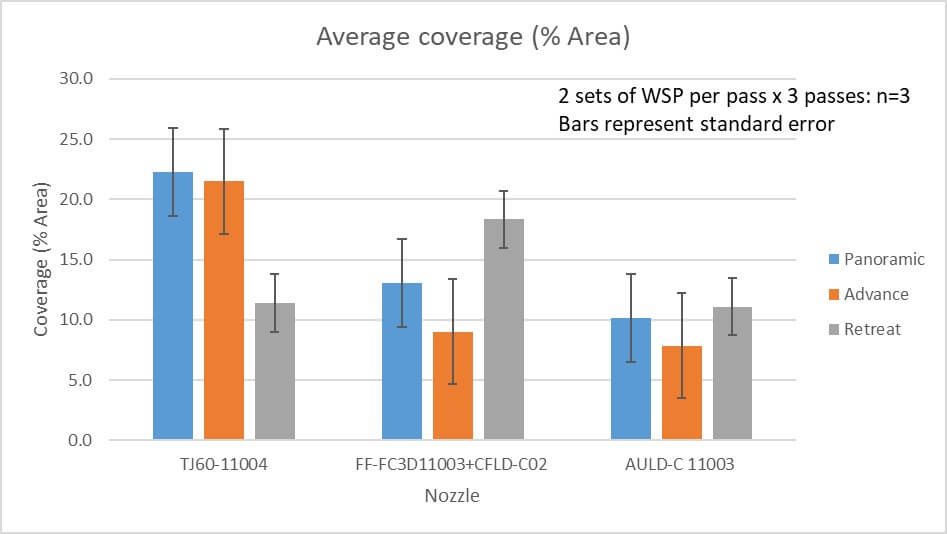
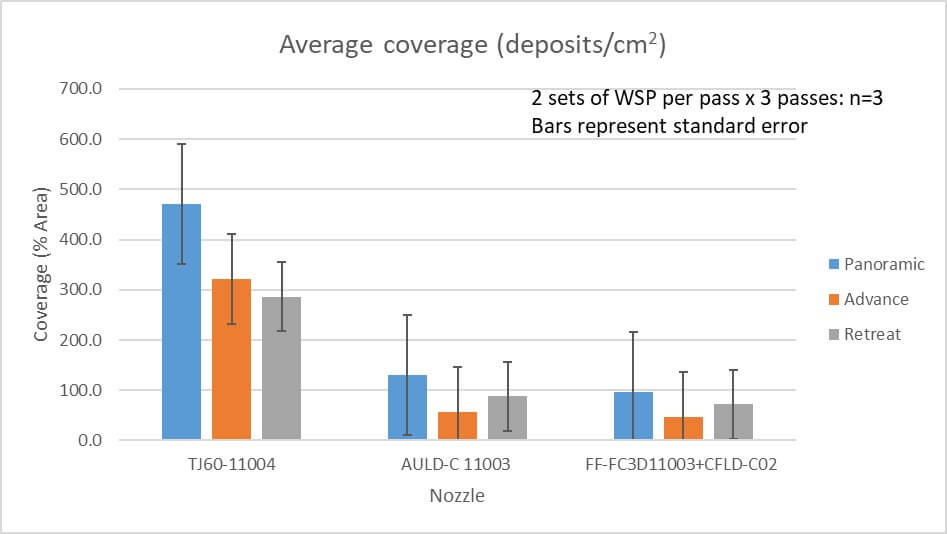
    The resultant coverage is recorded in Table 2 and graphed in Figures 3 and 4.

    NozzlePanoramic:
    Area covered (%)
    & deposit Density (#/cm2)
    Advance:
    Area covered (%)
    & Deposit density (#/cm2)
    Retreat:
    Area covered (%)
    & Deposit density (#/cm2)
    AULD-C 1100310.2%
    130.4 deposits/cm2
    7.9 %
    56.1 deposits/cm2
    11.1%
    87.7 deposits/cm2
    FF (CFLD-C02 & FC3D11003)13%
    97.5 deposits/cm2
    9.0%
    46.9 deposits /cm2
    18.3%
    72.4 deposits/cm2
    TJ60-1100422.3%
    471.0 deposits/cm2
    21.5%
    320.9 deposits/cm2
    11.4%
    286.1 deposits/cm2
    Table 2. Average coverage from three nozzles applying 187 L/ha (20 gpa).
    Figure 3. Comparison of average percent area covered for three nozzles.
    Figure 4. Comparison of average deposit density for three nozzles.

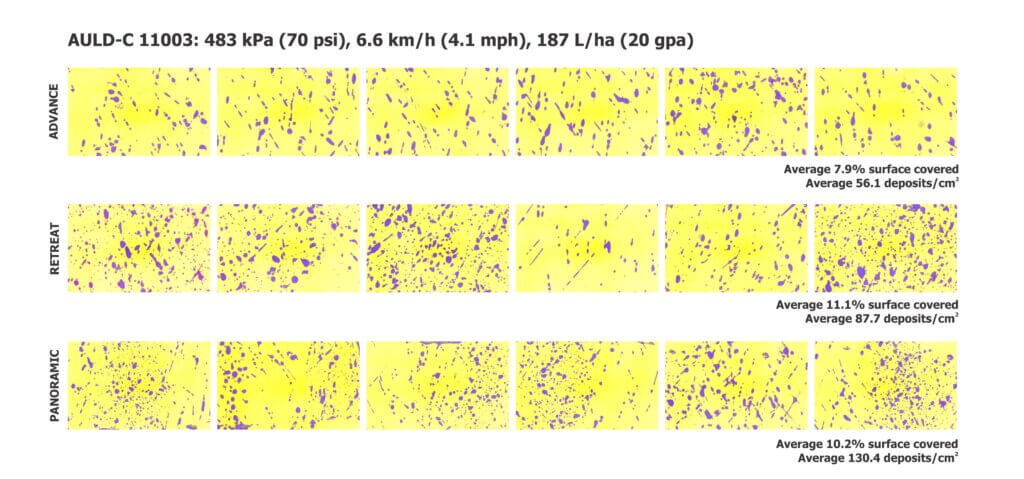
    Unless you are experienced with interpreting coverage data, these numbers and graphs may not convey what coverage truly looked like. And since we saw some unexpected results, we felt it would be best to digitize the papers from each nozzle and create graphics to support our observations and opinions on how they performed. Each image shows six replications of each orientation. We’ll begin with the AULD in Figure 5.

    The AULD was operated at a relatively high pressure to create the Coarse droplets recommended by the nozzle manufacturer. The steep rearward angle produced a higher degree of coverage on the retreat side compared to the advance. The streaky or tear-drop shaped deposits indicate a droplet that “scuffed” along the paper surface, almost but not quite in parallel. On the panoramic targets they tend to correspond with the sides of the paper, where the droplets are not aimed directly at the surface as in the “advance” and “retreat” surfaces. All in all, this nozzle performed well and created droplets large enough that we feel they would stay on course in a higher wind and not get tied up on the awns of the wheat head.

    Figure 5. Digital scans of water sensitive papers from the AULD nozzle. Spray quality was C.

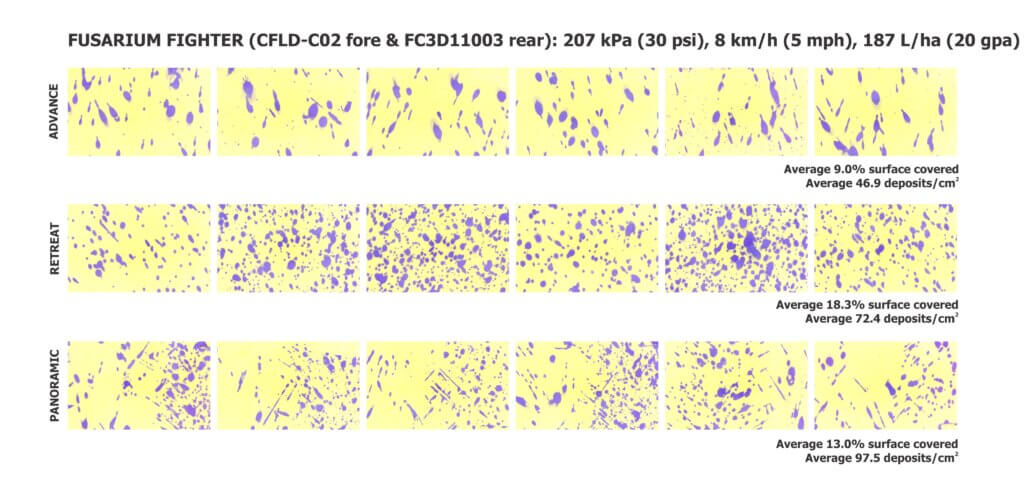
    Next is the Fusarium Fighter. This nozzle was developed in Western Canada where, on average, sprayers tend to travel faster than they do in Ontario. Certainly this isn’t the case for all Ontario fields, but we chose to emulate usage in home farm operations where fields may be smaller and less level. This is relevant because faster travel speeds permit the use of a larger 3D nozzle to achieve 20 gpa, which in turn produces a coarser spray quality. In our trials, we traveled more slowly and that necessitated a smaller 3D that produced only a Medium droplet size. We hypothesized that those smaller droplets may not stay on course, but the papers show otherwise (Figure 6).

    Figure 6. Digital scans of water sensitive papers. Spray quality was VC and M.

    Coverage on the retreat side was very good and far outstripped the coverage on the advance side. In fact, the Very Coarse spray quality from the CFLD-C may be too large. Dropping from VC to C would create more droplets and a higher deposit density on the advance. We did see some gaps in the panoramic papers that likely reflect the lack of finer droplets which tend to move more erratically and contact the sides. Recall that we said weather conditions were ideal. It is still questionable how well a 3D producing a Medium spray quality would perform in windier conditions or on the boom ends where yaw tends to lift tips well above the ideal operating height.

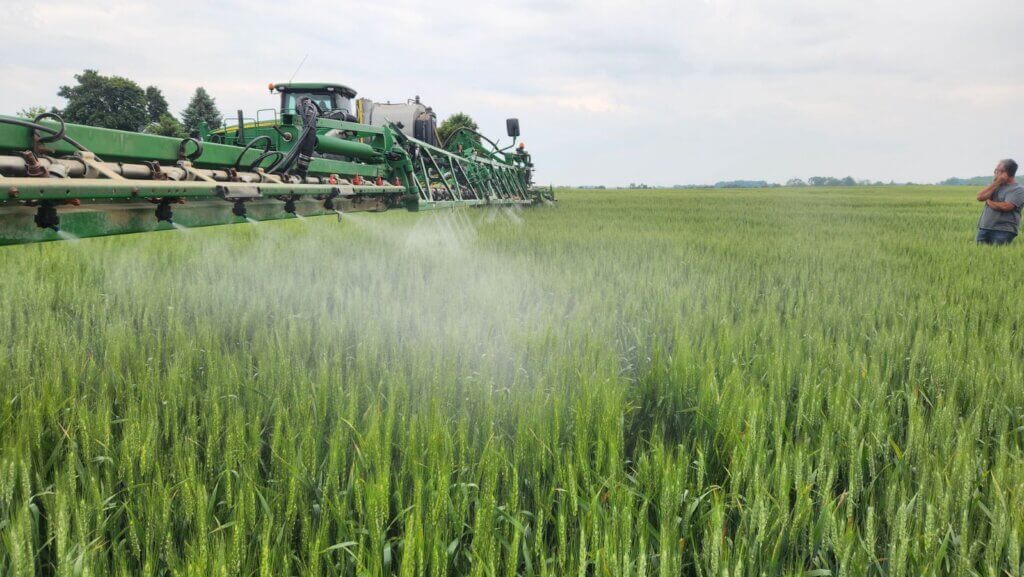
    Figure 7. All three tips operating on a stationary sprayer at 40 psi. The Fusarium Fighters (foreground), the TwinJets (middle) and the AULDs in the background.

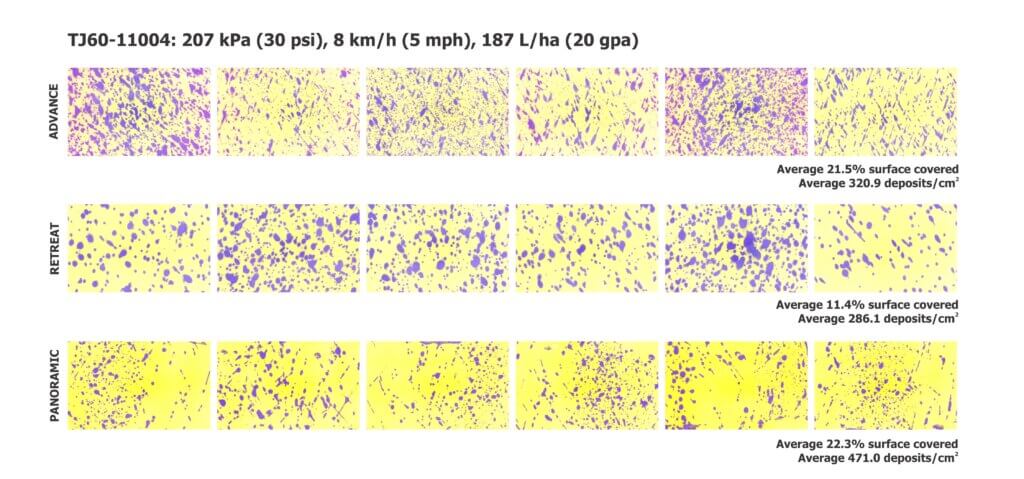
    Finally, the TwinJets (Figure 8). We used this nozzle only to demonstrate how the lack of an aggressive rearward angle and a Fine spray quality was not conducive to reliable wheat head coverage. Many studies have demonstrated that such a nozzle outperforms a single, conventional flat fan, but it is not the best choice of angled nozzles. Once again recall that these nozzles were positioned centre-boom where yaw and sprayer-induced turbulence were not an issue and in absolutely ideal environmental conditions.

    We saw tremendous coverage on the advance side and while we saw comparatively less on the retreat side, it still performed well compared to the other nozzles. The panoramic targets also indicated suitable coverage, both as percent area covered and deposit density. BUT, if we have some questions about how the Medium spray from the 3D would perform in more challenging conditions, we are far more concerned about the fines from this tip. Having used this nozzle in past demonstrations we are well aware of how non-uniform and erratic coverage can be, and that translates to poor efficacy and increased drift. However, sometimes circumstances conspire to create exceptions, and the coverage we saw in this trial is hard to fault.

    Figure 8. Digital scans of water sensitive papers. Spray quality was F.

    This trial was not intended to rank nozzles, but to explore the merits of a few new designs and evaluate their respective coverage. If anything the results reinforce the need to operate angled sprays correctly and in appropriate weather conditions. Water sensitive paper remains a quick and easy method for sprayer operators to evaluate their own coverage and inform any corrective actions to improve results in their own unique circumstances.

    Thanks to Dan and Paul Petker (Petker Farms) and Don Murdoch (Simcoe Research Station, University of Guelph) for providing the fields and operating the sprayers. Nozzle Ninja is gratefully acknowledged for the donation of AULD and Fusarium Fighter nozzles, and Spraying Systems Co. for the TwinJet nozzles and water sensitive paper.