Category: Speciality Sprayers

Main category for all sprayers that are not horizontal booms

  • How Much Horsepower do I Need?

    How Much Horsepower do I Need?

    How much horsepower (HP) do you need (really) when pairing a tractor and a towed sprayer or any other PTO powered implement? This important question should be asked BEFORE purchasing any towed implement. Surprisingly, there’s not much guidance out there, so you might hear answers like:

    1. Whatever my tractor has must be enough… whatever that happens to be.
    2. What?
    3. The right amount of HP is what I can afford. Erma, grab that milk can full of egg money… 
    4. MOAR! (Yes, we know how “more” is spelled, but memes are funny).
    Skeletor knows horsepower

    Rating Tractor Horsepower

    If you thought there was only one way to rate the horsepower of a tractor, well, you’d be wrong. At its simplest, horsepower is:

    (torque × engine revolutions) ÷ a constant

    We’ll expand on this later. The rub comes in how you define each of these factors and where you measure the power. Let’s start with something simple like engine speed, which is expressed in Revolutions Per Minute or RPM’s.

    Engine Speed

    So, if horsepower is the result of torque times engine speed, what speed do the manufacturers plug into the formula? One of two values are used:

    1. Power Take-Off (PTO) Engine Speed

    This is the engine RPM’s that produce the rated operating speed on the PTO. When the PTO is engaged, the engine is directly and mechanically connected to the PTO shaft. Therefore, maintaining the engine at the rated PTO speed, typically between 1,500 and  2,300 RPM depending on if it’s gas, diesel, turbocharged or not, will keep the PTO spinning at a uniform 540 or 1,000 RPM (the two typical PTO speeds) regardless of the driving speed.

    2. Maximum Engine Speed. 

    This is the engine’s maximum intermittent operating speed… just shy of destroying said engine. An engine rated using the maximum speed gives you a false sense of security, because to get that horsepower you’ll be burning a ton of diesel, over-speeding your PTO implement, and wearing your tractor out very, very quickly. You wouldn’t drive your car around town in low gear because you’d redline the engine. Why would you do it to your tractor?

    In the speedometer/tachometer (above the steering wheel) on this beautiful old tractor, the first black bar is the PTO rated RPM. The second is PTO Max. Operating with the PTO engaged above PTO Max can be damaging to the implement and to the tractor, and dangerous for the operator.

    Horsepower Basics

    OK, now we are ready to dig in a little deeper into defining tractor horsepower. What does it mean if, for example, your tractor is rated at 65 HP? We’ll skip the history lesson on watching the output of horses over an average day and move to the modern definition. Horsepower from a rotating shaft (such as the output of an engine) is:

    Horsepower = [Torque in foot-pounds × Engine speed in Revolutions Per Minute (RPM)] ÷ 5,252
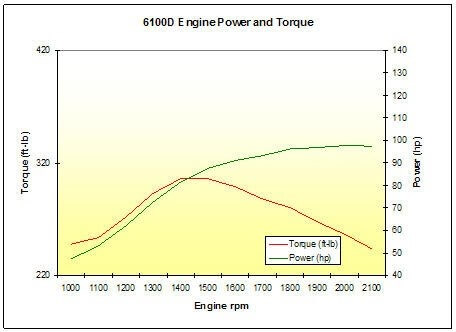
    Here is a typical tractor torque curve. Notice how after peak torque, RPM’s climb quickly but net HP doesn’t. Unless specified, we can assume this is Engine Horsepower, not PTO Horsepower. If the above Torque/HP curves were your tractor, the PTO speed would likely be 1,500-1,600 RPM. According to the graph that would equate to about 82 HP. Running the engine up by 40% (2,100 RPM which is the max speed in this case, gets you about 98 horsepower. That’s only a 20% improvement. Remember, this is engine horsepower, not PTO horsepower, so this may not all be available for you to use. Image from JD.

    Total Versus PTO Horsepower

    Perhaps our tractor’s 65 HP rating describes Engine Peak Horsepower. This is what the engine would produce on a test stand, and it likely uses the maximum engine speed. This rating is a bit disingenuous. Not only because you will probably operate it at rated PTO engine speed, but also because some power is lost to internal processes, like the power steering pump, automatic transmission pump, alternator, auxiliary hydraulics, et cetera. So peak engine horsepower isn’t usually a very useful number unless you are in marketing and like big numbers.

    A more accurate and useful rating is the Power Take-Off (PTO) Horsepower. This is the amount of horsepower available to do work at the PTO shaft. This may be at the rated PTO engine speed or the PTO Maximum speed. Estimating power using either speed offers a much more realistic rating of what you have to work with. As previously noted, PTO Rated Speed is usually near the speed where the engine creates the highest torque per revolution. This is often called the Power Band. Operation in this engine speed range will use the least diesel and result in the greatest amount of life in the machine. 

    Another important thing about PTO Horsepower is that this is the total amount of power available to do work. This could all go to PTO when the tractor is standing still, but both locomotion and the horsepower required to run the implement need to be subtracted from this number. So if your tractor is indeed 65 PTO horsepower, that’s the actual amount of horsepower you likely have to work with in real life. 
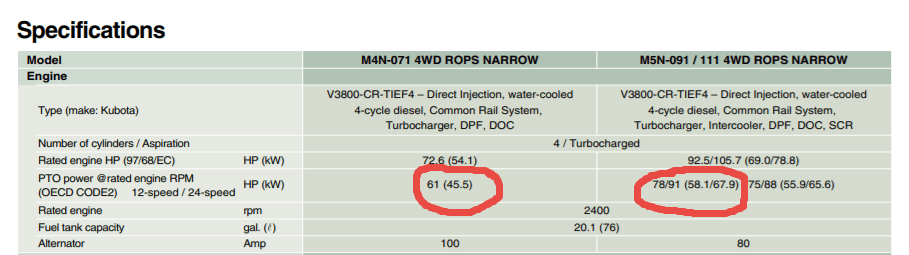
    In this excerpt from a Kubota Spec sheet, you see that the Rated Engine horsepower is quite a bit higher than the PTO horsepower. A 72 HP “rated” tractor really has 61 horsepower for you to work with. The 106 horsepower version on the right really has 91 PTO horsepower.

    The Horsepower that Matters

    To sum things up, PTO Horsepower is the number you really need to care about. All this up to now just to describe the nuances of how horsepower is expressed. No wonder HP is a topic that’s avoided. If you can find or download the manual, now you at least have the tools to get to how much horsepower you have to work with.

    Maximum Load

    In order to answer the question of how much HP you need, you must consider your operation. You need to size your tractor for the biggest load it will ever be used for, even if you only do that thing once a year. Typically this would be a sprayer, rotavator or a brush flail. The rest of the year you won’t burn much extra diesel if you aren’t using the power in a bigger tractor, but you can’t draw on horsepower that isn’t there in a smaller one. 

    Though it’s not common, you can have too big a tractor.  You need only watch “Clarkson’s Farm” for ample evidence (and a chuckle).

    The enormous and infamous Lamborghini tractor that starred in “Clarkson’s Farm” on Amazon Prime is a good example of taking horsepower a little too far.

    The Basics of Estimating Load

    Now that you have the extremes in mind, let’s get to scratchin’. There are three things you must know to determine the maximum load: 

    1. Locomotion – The power needed to move the tractor and implement
    2. Implement Power – The power needed to operate the implement
    3. Safety Factor – This is a buffer that gives us a little extra just in case.

    For the following guesstimates let’s assume you are doing orchard and vineyard work with a compact/narrow tractor. There really aren’t any hard and fast equations for this, but these will get you in the ballpark. If you are a nut grower with full sized tractors or a vegetable/field crop grower, you may need to scale up. 

    Locomotion

    People discount it, but the power required just to move the tractor and the implement around is substantial. If the implement is a fixed tower sprayer with a 500 gallon tank, this might require 15-20 HP on flat, dry land. If your topography includes hills, or your terrain includes mud or tall grass, you may need to double that requirement. 45 HP just to move around before you even engage the PTO. Speed matters, too; If you are driving 5 mph, you’ll need twice the HP versus driving 2.5 mph.

    C’mon Tom! Faster! Redline those RPM’s! Image from www.pigtailpals.com

    Implement Power

    The manufacturer of the implement should be able to tell you how much horsepower the implement requires. Small, three-point hitch airblast sprayers may only require 10-15 PTO HP. Larger tower sprayers may require 40-50 PTO HP. Brush flails may take 25-45 HP.

    This is where things can get sticky and you need to make sure you’re both talking the same language. Some manufacturers will tell you how much power the implement takes, others will skip all the steps in this article and go right to recommending the size tractor they think you’ll need. If you’re unsure, ask. Be sure to factor in the locomotion requirements discussed earlier, the dealer may not understand your conditions in their general recommendation but usually can provide some clarity with a little more information from you.

    Safety Factor

    It’s always a bad idea to run at 100% of your power capability. Most of you reading this article are likely working with mid-life or older tractors with a few thousand hours on them. Ol’ Bessie loses some of the pep in her step over time. After engine break-in, the tractor will slowly lose power capability over its life. The harder you work it, the faster this occurs. Enthalpy happens (now that’s a great tee-shirt idea).  Plan for it. Once you have an idea of your worst-case locomotion and implement power needs, add them up and give yourself another 15% (That is, multiply by 1.15).

    Summing It Up

    Now we can finally answer the question. In order to determine how much tractor horsepower you need, follow these steps:

    1. Understand the real PTO horsepower of the tractor you are considering. This is the only thing that matters. You should be able to find online documentation for this if it doesn’t come with the tractor or you’ve filed it somewhere that you’ll never forget…
    2. Establish the maximum load you are likely to encounter. Calculate this by multiplying the sum of Locomotion and Implement Power requirements by a 1.15 Safety Factor.
    3. If you are still unsure, discuss these factors with your trusted local tractor dealer, ensuring you are both speaking the same language. It is better to err on too much tractor than not enough, but do so within reason.

    Looking at our original orchard application with a 500 gallon tank and a larger tower type sprayer, travelling around 3 mph:

    35 HP for locomotion, 40 HP to run the sprayer and 15% safety puts us at 35 + 40 + [0.15 × (35+40)] = 86.25 PTO HP

    Wishing you all MOAR POWER and perfect spraying weather.
  • Assessing Water Sensitive Paper – Part 3

    Assessing Water Sensitive Paper – Part 3

    This is the final part of our three-part article discussing methods for digitizing and processing water sensitive paper. You can read part one here and part two here.

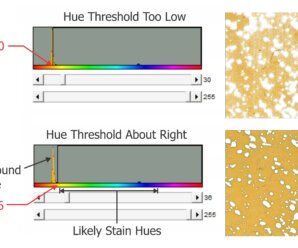
    Morphological operations

    We can now move on to the larger shapes, or “morphology” of the objects in our binary image. Our goal is to quantify deposits by interpreting these shapes. Once again, these operations are powerful processing tools, but we must acknowledge three overriding limitations:

    1. Inconsistent stains

    Sometimes deposits do not create a consistent blue colour – they can get lighter or take on a greenish-yellow hue towards the perimeter of the stain. During thresholding, the outer edge can be accidently eroded, leaving behind an object with a jagged edge. This may lead us to underestimate the percent area actually covered. In the case of tiny stains, it might eliminate them entirely and lead us to underestimate deposit density.

    2. Overlaps

    It can be difficult to determine if an object represents a stain from a single droplet or is the result of multiple, overlapping deposits. This becomes significant when the surface of the WSP exceeds ~20% total coverage. The resulting objects may or may not have hollow centres where droplets do not overlap entirely. Misidentifying overlaps leads us to falsely conclude that an object is the result of a single, coarser droplet rather than multiple finer droplets.

    3. Ellipses

    Non-circular stains are formed when droplets scuff along the surface. Two droplets with the same volume encountering a paper at different angles can create stains with significantly different areas. We may wrongly conclude that the droplets that created them were coarser than they truly were. One approach is to use Feret’s Diameter (aka Caliper Diameter) by measuring the widest spans on the X and Y axes and taking the average. Another approach is to interpret the ellipse as a series of circular stains. Or we can decide to only acknowledge these objects when calculating percent area covered, but omit them when calculating deposit density or predicting original droplet size. Each strategy is a compromise, so it is important to be consistent and transparent when reporting results.

    Three common problems when analysing water sensitive paper.

    We’ll explore two morphological operations that can help us separate fact from fiction: Granulometry and Dilation-and-Erosion. We’re introducing these operations as part of the processing and detection step, but they may also overlap with the measurement step in our three-step process.

    Granulometry

    We can estimate the range of object sizes and get a sense of how they are distributed on the paper by filtering or “sieving” the image. Imagine pouring a mixture of sand and rocks through a series of ever-finer sieves. Doing so allows you to separate particles based on size exclusion. A granulometry function compares each object to a series of standardized objects with decreasing diameters. This isolates objects of a similar size and bins them in that size range. This is a powerful operation, but accuracy is lost when stains overlap to form larger objects. In this case, we move on to Dilation and Erosion.

    Dilation and Erosion

    Think of dilation as adding pixels to the boundary of an object. This makes tiny objects bigger, fills in any interior holes and can cause objects to merge. The number of pixel-wide dilations required to make objects contact one another can be used as a measure of deposit density.

    Erosion removes pixels from the outer (and sometimes inner) boundaries of an object. This eliminates tiny artifacts that may not actually represent stains. It can also split non-circular objects into multiple parts before shrinking them into multiple nuclei (aka centroids). These last-remaining points are not necessarily the centre of a stain, but the pixels furthest away from the original boundary.

    When a non-circular shape has more than one nucleus, they likely represent individual droplets that combined to form the larger stain. We can then use these nuclei to measure deposit density, such as in a Voronoi partition which triangulates each nucleus in relation to the two closest neighbours.

    Many image processers use both these operations sequentially. When an image is eroded and then dilated (a process called “Opening”), smaller objects are removed, leaving the area and shape of remaining objects relatively intact. Dilating and then eroding (a process called “Closing”) fills in small holes and merges smaller objects, once again leaving the area and shape of remaining objects relatively intact. We can use both of these functions to help smooth an image prior to measurement.

    (Top) Opening operations erode and then dilate the image. Moving left to right, the smaller objects tend to disappear. (Bottom) Closing operations dilate and then erode the image. Moving left to right, smaller objects either disappear or merge and holes are filled in

    Distance Transformations

    Distance transformations are advanced operations specifically used to separate objects that are densely packed. While not typically used when analyzing WSP, distance transformations are another means of identifying object nuclei. They are another means for teasing apart objects that are likely the result of overlapping deposits and then mapping their relative sizes and positions.

    Measurement

    The calculation of the area covered by deposits is straightforward. The pixels belonging to objects (the deposits) and those belonging to background are summed and then the fraction is converted to percent area covered. Research has shown that the image resolution does not significantly impact percent coverage assessments and has suggested that all image analysis software tends to produce similar results (+/- 3.5% observed when the same threshold was applied to multiple papers). This is acceptable because it’s within the variability inherent to spraying.

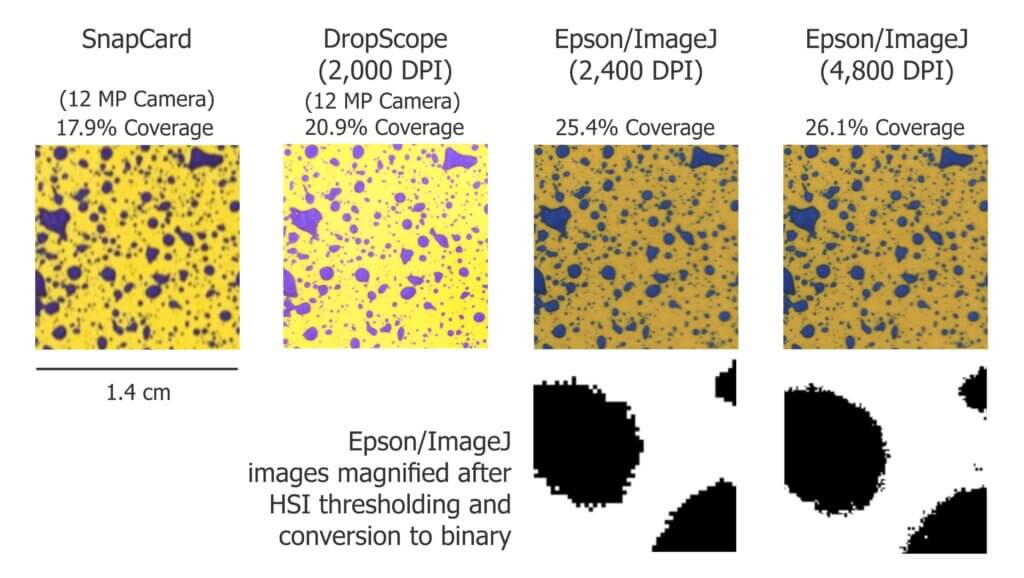
    We ran a similar experiment wherein we analyzed the same piece of WSP using four methods. Here are a few facts about the software we used:

    • DropScope produces images between 2,100 and 2,300 DPI. Currently, it ignores ellipses and doesn’t count anything spanning less than ~35 µm (3 pixels).
    • We set ImageJ to ignore any object spanning less than 3 pixels, which at 2,400 DPI was 30 µm in diameter.
    • Snapcard was a free app created by Australia’s GRDC. It was benchmarked using ImageJ, tended to underestimate coverage and was fairly inconsistent. Nevertheless, it was convenient for field work. Instances may still exist, but as of 2025 it no longer available through the GRDC.

    The images shown in the figure below were cropped from screenshots produced by each method. The actual ROI analyzed was ~3 cm2 for SnapCard, 3.68 cm2 for DropScope and 2.0 cm2 for both Epson/ImageJ methods. Our results indicate an +/- 4% difference in percent area coverage. This variability reflects the results of a 2016 journal article that compared SnapCard with ImageJ and other leading analytical software. That study claimed no statistically significant difference in percent coverage detected (standard deviations were about 20%). However, the ImageJ results tended to trend several percent higher than SnapCard. We saw this as well. And so, while resolution may not have a significant impact on percent area covered, there does appear to be some correlation.

    Percent area covered as reported by three image analysis systems. Only a minor difference was observed when resolution was doubled using the Epson/ImageJ method.

    Resolution definitely affects deposit counts. Particularly in applications that employ finer droplets. Consider the difference between detecting or missing 1,000 30 µm diameter objects. It may only amount to a fraction of a percentage of the surface covered, but +/- 1,000 objects on a 2 cm2 area is significant in terms of deposit density.

    Output

    Once a WSP image (or set of images) has been scanned, pre-processed, processed and measured, we will receive some manner of output. Some software packages create an attractive report with images, graphs and key values. These reports include percent coverage and many provide droplet density. Deposits may be binned by size, or spread factors are used to calculate the original droplet diameters and even estimate the volume applied by area. Other software packages provide raw data that can be imported into a statistical program or spreadsheet program like Excel for further analysis. Some software packages provide both.

    How far can we take this?

    Blow-by-blow data analysis is beyond the scope of this document, but how much weight should we give to coverage data obtained using WSP? The answer depends on the metric in question, but in all cases we must first acknowledge the three overriding caveats. Take it as said that they apply to everything that follows:

    1. Different brands (and even different production runs) of WSP can produce significantly different coverage metrics. When conducting experiments, use a single brand of WSP. Better still, use papers from the same production batch whenever possible.
    2. The same of piece of sprayed WSP can produce significantly different results depending on the software and protocol used to analyze it. When conducting experiments, use the same software and assessment protocol and be transparent about the process when communicating results.
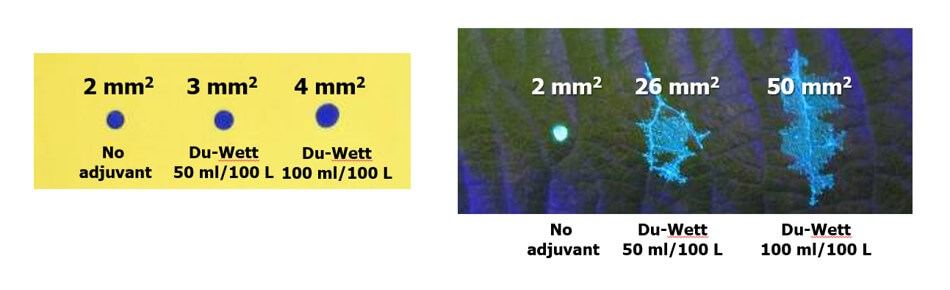
    3. WSP coverage may not reflect the coverage achieved on an actual plant tissue surface. It is suitable as a relative index (I.e. papers can be compared to papers, but not to tissues) but the spread factor changes with surface wettability and the surface tension of the liquid sprayed. Note the differences in percent area covered in the following experiment with an organosilicone super-spreader:
    Difference in deposit spread on water sensitive paper versus a leaf surface using an organosilicone super-spreader and UV dye. The same volume was applied in each case and while the area increased two-fold on WSP it increased ~10-fold on an actual leaf. Image reproduced from work by Robyn Gaskin, Plant Protection Products, New Zealand.

    Recall that we started this document by listing the four pieces of information commonly sought using WSP. They were listed in order of reliability, and now we can explain why.

    • The percent surface area covered: We have established that this is the most reliable piece of data. Droplets do not spread on WSP the way they do on plant surfaces, so it will underestimate actual coverage. The results vary by analytical method, but it’s likely not dependent on resolution and still falls within the variability inherent to spraying. This metric gives us valuable and actionable information. We can say whether or not we hit a target, and evaluate whether a sprayer change resulted in more or less deposit.
    • The density of deposits on the target area: We have established that that there are limits to the reliability of this metric. It is affected by the analytical method used and can be greatly underestimated when resolution is poor or when deposits overlap in high numbers. Also, it will never reliably reflect deposits under 30 µm. Nevertheless, under controlled conditions this information does have value and is of great interest in enquiries about drift and contact fungicides.
    • The size of the droplets that left the stains: This metric is highly questionable except under controlled conditions. The many assumptions about surface tension, droplet speed, and droplet evaporation make it impossible to make definitive statements about spray quality. Finer droplets are greatly underestimated in this equation. Therefore, while there may be some value in using WSP as a relative index, this metric is a crude indication at best.
    • The dose applied to the target surface: This metric has not been discussed up to this point, but is quickly and easily dismissed. Let’s assume that a droplet with a high concentration of an active ingredient will leave a stain that is the same area as another droplet with a lower concentration. This will lead some to suggest that as long as the original concentration is known, we can back-calculate the dose (which is the amount of active on a given area). However, one droplet has the same volume as eight droplets that are half it’s diameter. This cubic relationship means that if they all deposit, the larger droplet will cover roughly 1/2 the surface area as the eight smaller droplets. Therefore, the smaller droplets spread the same amount of active over a greater area. Spread factor muddies this a bit, but ultimately it means that dose cannot be estimated from area covered. Dose is better assessed using collectors that permit the residue to be removed, such as Petri dishes, Mylar sheets, pipe cleaners, alpha cellulose cards, or glass slides.

    And so, the image analysis process described here is powerful and effective when used with water sensitive paper as long as the limitations are acknowledged. The same process can also be used with dyes and specialized collectors such as Kromekote to permit even greater resolution. But that’s another story.

    2026

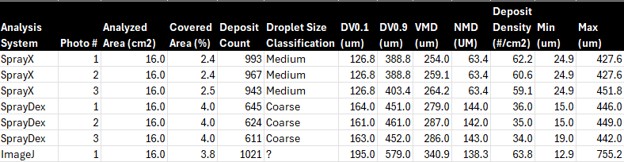
    A new Brazilian cellphone-based system (SprayDex) emerged in 2026 that offers possibilities. Preliminary testing alongside other methods indicate it is consistent within itself, but as we saw in previous testing, the same WSP scanned using different systems will create different results. This is why, ultimately, WSP is a relative index and should only be compared within a given system; coverage cannot be reliably compared across WSP brands, or between digitization methods.

    2026 Comparison of three digitization / analysis methods. Same WSP was scanned each time.

    References (Further reading)

    Bankhead, P. 2014. Analyzing fluorescence microscopy images with ImageJ.

    Cunha, J.P.A.R., Farnese, A.C., Olivet, J.J. 2013. Computer programs for analysis of droplets sprayed on water sensitive papers. Planta Daninha, Viçosa-MG. 31(3): 715-720.

    Ferguson, J.C., Chechetto, R.G., O’Donnell, C.C., Fritz, B.K., Hoffmann, W.C., Coleman, C.E., Chauhan, B.S., Adkins, S.W. Kruger, G.R., Hewitt, A.J. 2016. Assessing a novel smartphone application – SnapCard, compared to five imaging systems to quantify droplet deposition on artificial collectors. Computers and Electronics in Agriculture. 128: 193-198.

    Ledebuhr, M. 2016. Small Drop Sprays.

    Marçal, A.R.S., Cunha, M. 2008. Image processing of artificial targets for automatic evaluation of spray targets. Trans. of the ASABE. 51(3): 811-821.

    Moor, A., Langenakens, J., Vereecke, E., Jaeken, P., Lootens, P., Vandecasteele, P. 2000. Image analysis of water sensitive paper as a tool for the evaluation of spray distribution of orchard sprayers. Aspects of Applied Biology. 57.

    Panneton, B. 2002. Image analysis of water‐sensitive cards for spray coverage experiments. Applied Eng. in Agric. 18(2): 179‐182.

    Salyani, M., Zhu, H., Sweeb, R.D., Pai, N. 2013. Assessment of spray distribution with water-sensitive paper. Agric. Eng. Int.: CIGR Journal. 15(2): 101-111.

    SnapCard website. University of Western Australia and the Department of Primary Industries and Regional Development, Western Australia. (Note: As of 2026, may no longer exist).

    Syngenta. 2002. Water‐sensitive paper for monitoring spray distributions. CH‐4002. Basle, Switzerland: Syngenta Crop Protection.

    Turner, C.R., Huntington, K.A. 1970. The use of a water sensitive dye for the detection and assessment of small spray droplets. J. Agric. Eng. Res. 15: 385-387.

  • Drift is… Good?

    Drift is… Good?

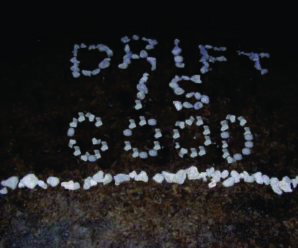
    OK, fine. We confess to the shameful use of click-bait in our title. Nevertheless, it’s absolutely true: Drift can be good. The reason this statement is unsettling is because of the lack of context, which is really what this article is about.

    The majority of sprayer-related information available to ag stakeholders relates to horizontal boom sprayers. Most of it is relevant to broadacre field crops and often pertains to herbicide applications. If you’re unsurprised, or still struggling to grasp our point, it’s likely because you’re part of that world. But consider everyone else.

    Agricultural spraying is diverse and many usage patterns are grossly underrepresented. As a result, those operators struggle to find relevant information. And what information is most readily available? Yes – broadacre herbicide spraying. Even the experts (i.e. agronomists, salespeople and consultants) often make the error of responding to specialty crop questions with field crop answers. Or relatedly, they assume their entire audience is comprised of field croppers and fail to use a disclaimer before making sweeping statements. The problem (and it is a problem) is so pervasive that we often hear about specialty crop operators taking training courses intended for field crop applicators… because that’s all that’s available.

    So how different can spraying be for a given crop? Surely a droplet is a droplet and the laws of physics don’t care what you grow? This is true, but droplet size, spray volume, distance-to-target, environmental conditions, sprayer type and product formulation combine in complicated ways. The result is that the best advice for one operation can be disastrously wrong for another.

    Case in point: Drift is good. If we were persnickety (and we are) we would suggest that moderate drift is the lateral movement of spray with the prevailing wind, and that this helps ground and/or disperse spray in a predictable direction. It’s not a bad thing. But we know that drift quickly becomes bad in high winds and especially when there are sensitive downwind areas. We won’t even talk about dead calm.

    However, in controlled environment applications (e.g. greenhouses) operators use very small droplets in high numbers and absolutely rely on air circulation to expose all crop surfaces to the spray. Without drift, most stationary foggers would only have a limited and localized effect. And in airblast operations, a wind that would never deter a field sprayer operator would derail an airblast operator. Wind is much faster with elevation and airblast sprayers use very small droplets that span considerable distances to the tops of tall targets. In their world, droplet size is not the primary means for drift mitigation – it’s air alignment.

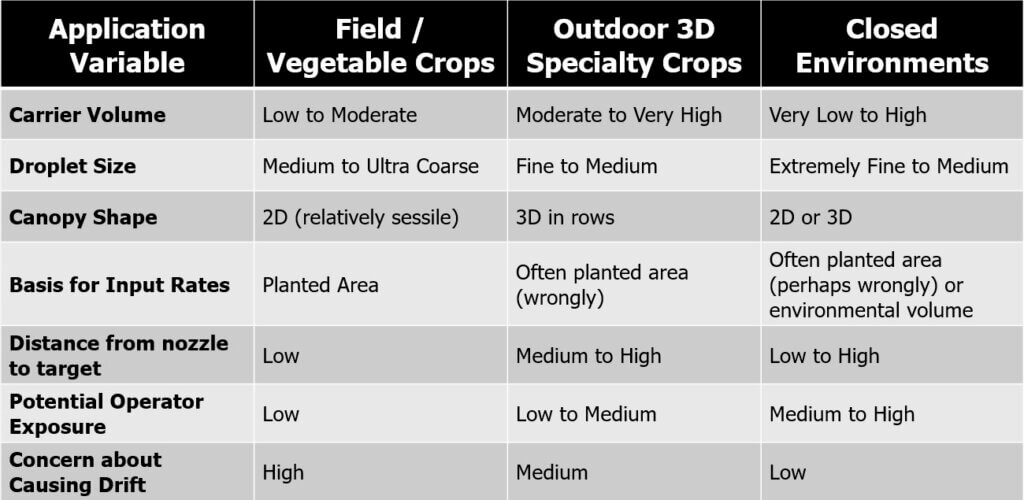
    The following table is a relative comparison of key factors in spraying. Note how different they are depending on the usage pattern. And if this isn’t diverse enough, recognize that we didn’t include a column for vegetative management (e.g. roadsides, industrial and forestry) or aerial application (which might even be split into piloted and remotely-piloted).

    And so where does this leave us? We have two pieces of advice:

    • If you are looking for information on spraying, take the time to find out who your source is and understand the context of the information. More often than not it will have relevance, but in some cases it could be completely wrong for you.
    • If you are providing information on spraying, be clear who the information is intended for. While we don’t propose caveats amending every statement, context is always appreciated. A sentence in an article, or a brief interjection during a presentation, might help someone that doesn’t know what they don’t know.

    This presentation was delivered virtually for the 2021 OMAFRA Controlled Environment Webinar Series. If you’d like to learn more about strategies for spraying in closed environments, settle in and give a watch. It’s 45 minutes plus questions.

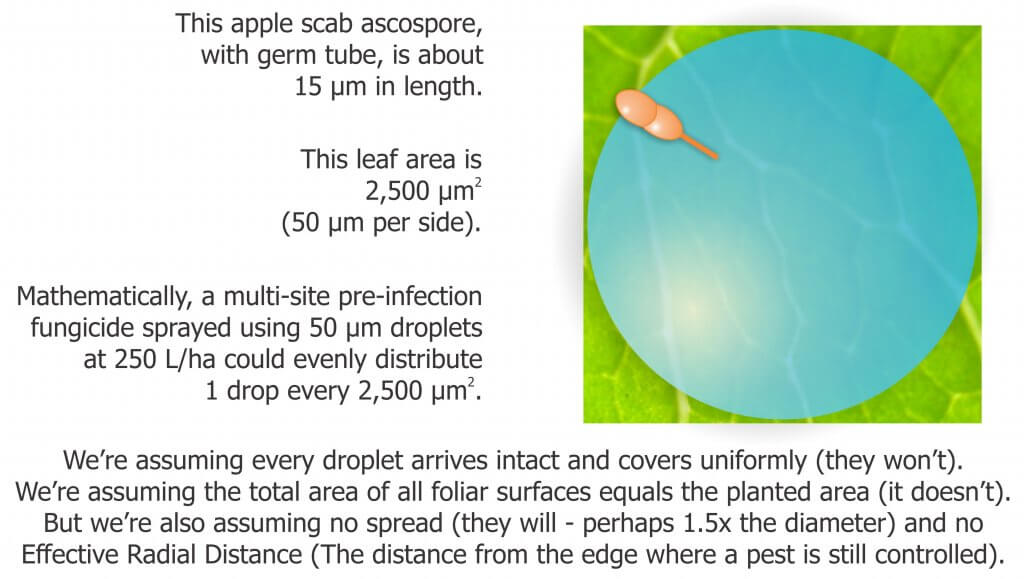
    So, a minor error in the presentation. The image of the ascospore was not quite right. This new version (below) is correct. Perspective can get tricky at the micron-scale of resolution.

  • Ten Tips for Spraying in the Wind

    Ten Tips for Spraying in the Wind

    Choosing the right time to spray can be tricky. Our gut tells us that spraying when it’s windy is wrong.  The experts tell us that spraying when it’s calm is wrong. So when can you actually spray?

    I’ve always advised my clients to spray in some wind, because it has a few advantages. The main one is that wind helps disperse the spray upward and downward, diluting the spray cloud fairly rapidly. Another advantage is that winds tend to be reasonably steady in their direction and velocity (or at least that can be forecast), so downwind areas can be identified and potential impacts are known or predictable. It helps if it’s sunny, because that improves the dispersion of the cloud even more.

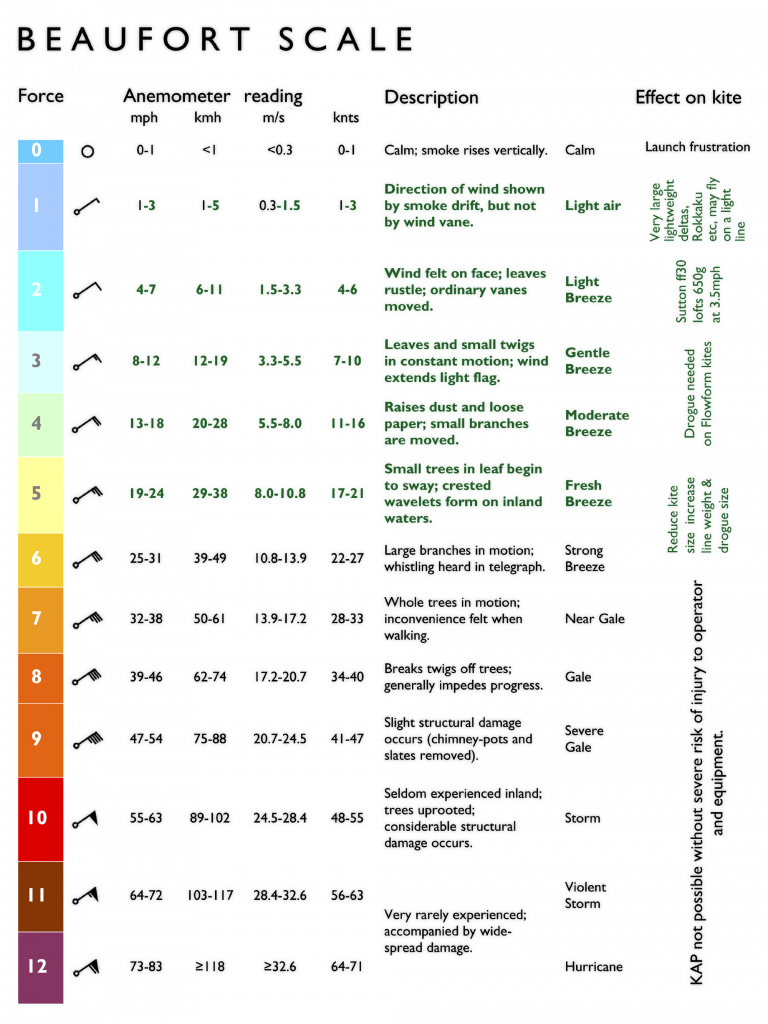
    First, let’s define “windy”. The classic wind scale is the Beaufort Scale, intended for the sea, but also used on land. The upper limit for spraying is probably Force 3 or Force 4, with upper limits of 20 – 25 km/h or so.  The Beaufort Scale calls these “Gentle or Moderate Breezes” (they had to save the alarming words for hurricanes), and the scale provides good visual clues such as what wind does to flags, leaves, or dust.

    Beaufort Scale-1

    Spraying under breezy conditions can be done fairly safely if you follow specific steps. The idea is to understand what the risks are and to manage them.

    The cornerstone is to use a low-drift spray and match it to a pesticide that will work well with larger droplets. But there are other important aspects to consider. Below are the top ten to think about:

    • Choose a herbicide that can handle large droplets. Glyphosate products are well suited to coarse droplets. But glyphosate commonly has contact actives in the mix, members of Group 6, 14, and 15, and these are less likely to perform well with big droplets than those that contain Group 2 and 4 mixes. Actives with soil activity also have more tolerance for larger droplets.
    • Use a low-drift nozzle and operate it so it produces a Coarse (C) to Very Coarse (VC) spray quality, as described by the manufacturer. Dicamba labels call for Extremely Coarse (XC) to Ultra-Coarse (UC) sprays, and Enlist requires at least Coarse. To achieve these you may need to purchase new nozzles. Low-pressure air-induced nozzles operated at about 50 – 60 psi will generally be very low-drift, but lower drift models are available. If you need a finer spray, produce it either by increasing the pressure or moving to a finer tip. Do this when the weather improves, for contact modes of action.
    The name, symbol and range of droplet sizes used to describe the median droplet diameter produced by nozzles according to ASABE S572.3
    • Keep your boom low. Lowering the boom ranks as the second-most effective way to reduce drift, after coarser sprays. But there’s a limit. For low-drift sprays, you need at least 100% overlap (more for PWM), which is for the edge of one nozzle pattern to spray into the centre of the adjacent pattern. In other words, the spray pattern should be twice as wide as your nozzle spacing at target height.  For most nozzles, a boom height of close to 20 inches is enough to achieve this overlap. That’s pretty low by current standards from suspended booms on self-propelled sprayers, so being too low for a good pattern will only happen due to boom sway.
    • Maintain reasonably slow travel speeds. These reduce the amount of fine droplets that hang behind the spray boom, reduce turbulence from sprayer wheels, and they also make low booms more practical. An added bonus is less dust generation.
    • Know what’s downwind and what harms it. Survey the fields on all sides of the parcel you’re treating. When you have a choice, avoid spraying fields that have sensitive areas downwind such as water, shelterbelts, pastures, people, etc. If you can’t avoid being upwind of these areas, make sure you check and obey the buffer zone restrictions on the label. These will also give you an idea if the product can cause harm in water or on land, or both.
    • Consider a dicamba tip for special situations, even if you don’t use dicamba. If you’re in a situation where quitting and waiting is a poor option, these tips allow you to finish the job with minimal drift risk and with only slight reductions in product performance due to poor coverage.
    • Use a low-drift adjuvant. Specific products such as Interlock or Valid have been shown to reduce driftable fines (<150 microns) by between 40 – 60%, without adding significant volume in coarser droplets. The response will depend on the nozzle and the tank mix, but can be very noticeable.
    • Study drift and how it forms and moves. It’s about more than wind speed and droplet size. Knowledge in this area can help you work out the best strategies.
    • Invest in productivity. You may not need it every day, but on occasions when you have a small window to avoid bad weather, it pays dividends.
    • If you feel that drift is unavoidable and someone might be impacted by it, talk to those people first. It’s one of the most important things you can do.

    Keeping pesticide sprays on target continues to be one of our top responsibilities.

  • Spraying Asparagus in Fern

    Spraying Asparagus in Fern

    This research was performed in 2012 and since then there have been considerable advances in application technology for asparagus in fern that should be considered. Be sure to read the epilogue at the end of this article.

    Introduction

    Diseases such as purple spot can have major economic impacts for asparagus growers, and the best line of defence is spraying the appropriate control products. The good news is that asparagus growers know this. The bad news is that there are few things harder to spray than asparagus in fern.

    Asparagus infected with purple spot.
    Asparagus infected with purple spot.

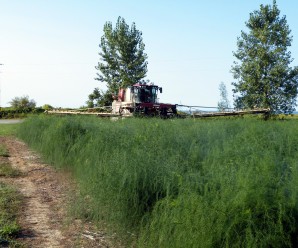
    Asparagus in fern can stand 1.5 m (5 ft) high by 1.0 m (3 ft) diameter and is typically planted on 1.2 m (4 ft) centres. Asparagus in fern has a very dense canopy full of needle-shaped leaves. This dense canopy slows air movement, making conditions still, humid and very difficult for a spray droplet to penetrate.

    Spraying asparagus in fern.
    Spraying asparagus in fern.

    Spray coverage is a combination of two factors: the area of the target contacted by spray droplets, and the distribution of spray droplets over that target. For most insecticide and fungicide applications, reasonable coverage is reflected by 10-15% surface area covered paired with an even distribution of approximately 85 medium sized droplets per square centimeter. This is not a rule, but a guideline.

    In order to determine the best way to spray, we have to be able to compare the coverage achieved. To do this, we used water sensitive paper, which is yellow until contact with spray turns it blue. Three sets of three targets were placed in approximately the same location for each pass.

    Water-sensitive paper arranged on stands, ready to be placed in the fern.
    Water sensitive paper arranged on stands, ready to be placed in the fern.
    Diagram defining where water-sensitive papers were located relative to the fern and the sprayer.
    Water sensitive paper orientation and location in asparagus canopy relative to sprayer direction.

    We tested five popular nozzle types, at two ground speeds using three carrier volumes to answer three questions:

    1. Does spray volume impact spray coverage?
    2. Which nozzle style gives the best coverage?
    3. Does travel speed impact spray coverage?

    Does spray volume impact spray coverage?

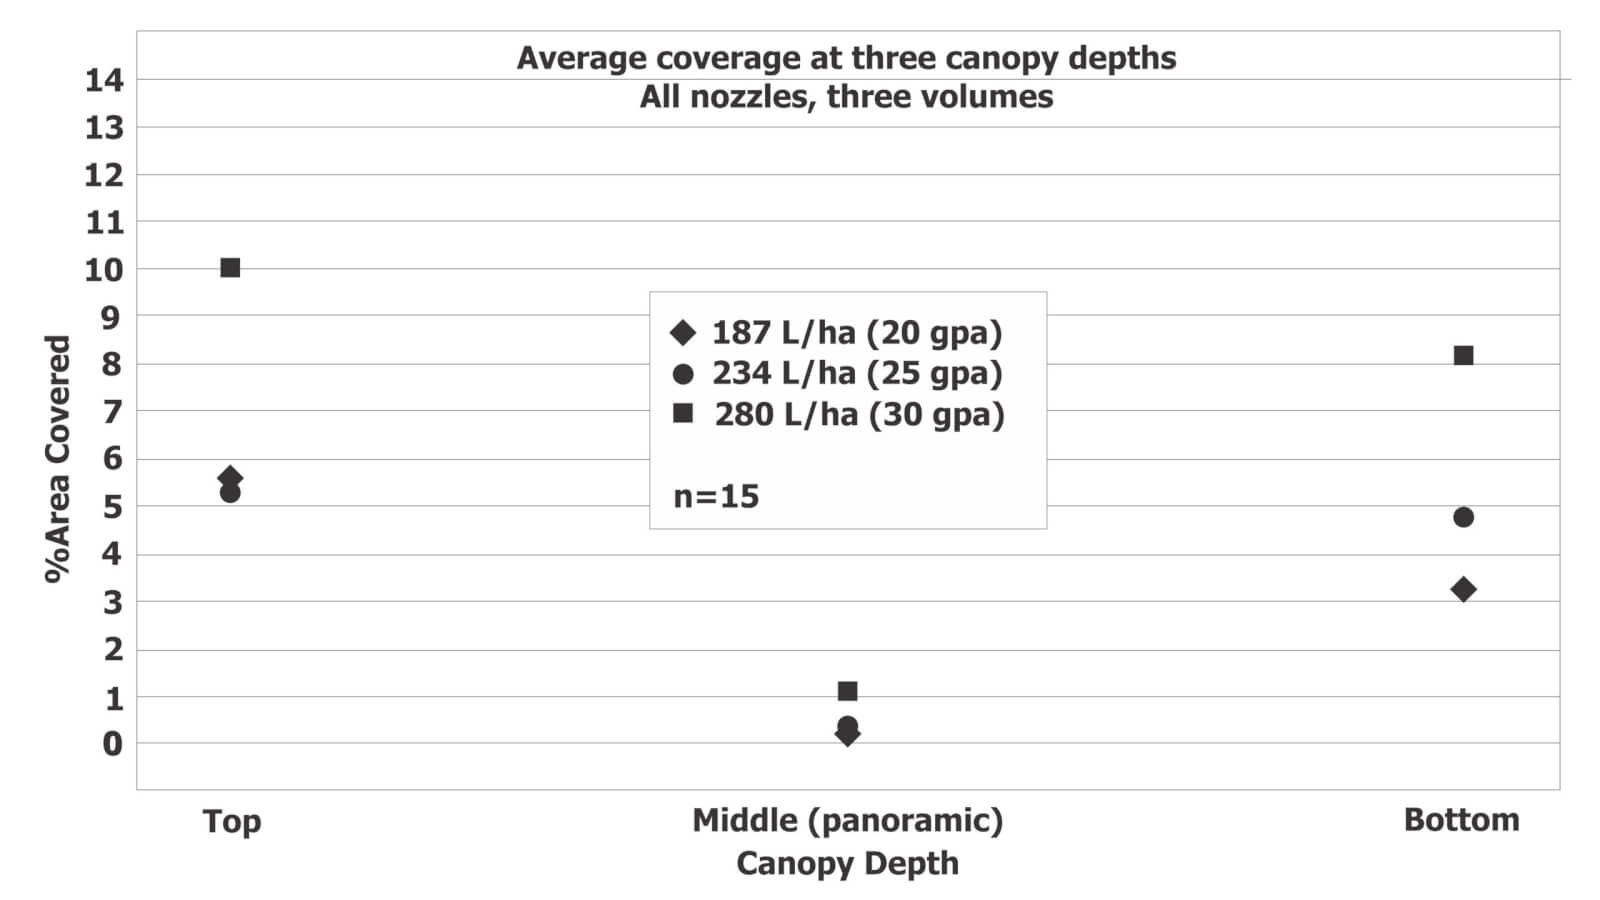
    Five different nozzle types were used to spray three volumes onto the targets at 16 kmh (10 mph). This was repeated three times and target coverage was determined both as droplet deposits per cm2 (see Figure 1) and total % covered (see Figure 2).

    Figure 1. Average deposits per cm^2 for five different nozzle types at 187 L/ha (20 US gpa), 234 L/ha (25 US gpa) and 280 L/ha (30 US gpa) at a ground speed of 16 kmh (10 mph).
    Figure 2. Combined average percent coverage for five different nozzle types at 187 L/ha (20 US gpa), 234 L/ha (25 US gpa) and 280 L/ha (30 US gpa) at a ground speed of 16 kmh (10 mph).

    Cards in each position consistently received a significantly higher average deposit per cm2 and significantly higher average percent coverage at higher spray volumes. The relatively low coverage in the middle position was anticipated given the orientation of the targets to the sprayer.

    Therefore, it would appear higher volumes result in better coverage, at least up to 280 L/ha (30 gpa). Generally, there is a threshold where exceeding a given carrier volume results in a diminishing return.

    Which nozzle gives the best coverage?

    Coverage from five different nozzles was compared: the Hollow cone, Flat fan, Dual flat fan, Guardian Air and Air-induced hollow cone. Given that 280 L/ha (30 gpa) resulted in the best coverage, the following figures illustrate droplet deposits per cm2 (see Figure 3) and total % covered (see Figure 4) at 280 L/ha (30 gpa).

    Figure 3. Average deposits per cm^2 for five different nozzle types at 280 L/ha (30 US gpa) and 16 kmh (10 mph).
    Figure 4. Average percent coverage for five different nozzle types at 280 L/ha (30 US gpa) and 16 kmh (10 mph).

    The graphs show that each nozzle followed a similar trend, with more droplets at the top of the canopy, less or par at the bottom of the canopy, and considerably less in the middle of the canopy (which is not surprising given the orientation of the target around the stem).

    The trend in droplet density from highest to least coverage is:

    1. Hollow Cone
    2. XR flat Fan
    3. Guardian Air
    4. Dual Flat Fan
    5. Air Induced Hollow Cone

    The percent coverage data was less clear. The top two nozzles for each position were:

    Top Target:

    1. Guardian Air
    2. All other nozzles approximately the same

    Middle Target (around the stem):

    1. XR flat Fan
    2. Hollow Cone

    Bottom Target:

    1. XR flat Fan
    2. Hollow Cone

    It can be argued that the target at the top of the canopy is easiest to spray, and therefore does not have as much importance as the middle and bottom targets. As such, it would appear that the XR flat fan and Hollow cone nozzles give the best overall coverage. It is debatable whether the higher droplet count from the Hollow cone is more important than the higher percent coverage of the XR flat fan.

    Does travel speed impact spray coverage?

    Hollow cone nozzles and XR flat fan nozzles were used to spray targets at two travel speeds and three volumes. Target coverage was determined both as droplet deposits per cm2 (see Figure 5) and total % covered (see Figure 6).

    Figure 5. Average deposits per cm^2 for Hollow cone and XR flat fan nozzles at 280 L/ha (30 US gpa) and either 8 kmh (5 mph) or 16 kmh (10 mph).
    Figure 6. Average percent coverage for Hollow cone and XR Flat fan nozzles at 280 L/ha (30 US gpa) and either 8 kmh (5 mph) or 16 kmh (10 mph).

    The variability in deposit density and percent coverage from medium/fine droplets created by the hollow cone nozzles make it difficult to determine statistical significance, but the trend suggests that higher ground speeds improve coverage in the middle and bottom of the canopy. This is likely due to the wake of the sprayer and the vortices created by its passage stirring fine droplets into the canopy.

    Overall recommendations

    The data suggest that coverage was improved when the sprayer travels at 16 kmh (10 mph) rather than 8 kmh (5 mph). Coverage was also improved at higher spray volumes, where 280 L/ha (30 US g/ac) provided the best overall coverage for all nozzles. As for the best nozzle, this depends on the application; the hollow cone created higher droplet densities than the XR flat fan, but the XR Flat fan created higher percent coverage. Higher droplet densities may be preferred when controlling disease with contact products, but spray drift becomes a significant concern. Higher percent coverage might be preferred with locally systemic products where complete coverage is less of a concern and preventing spray drift is a priority.

    Epilogue

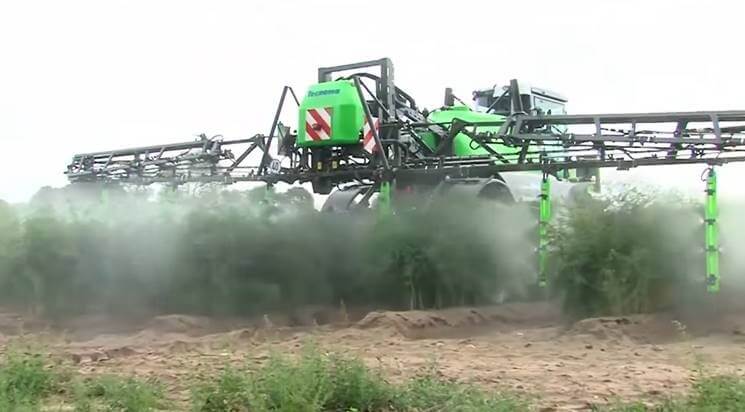
    This work was performed in 2012. Since then there have been significant advances in sprayer design for spraying asparagus in fern. Dr. Torsten Balz (Bayer Application Technology Manager) kindly provided an example of such a sprayer (see below) and a video link to watch it in action. Drop arms that bring the nozzles closer to the target at all canopy depths are an ideal solution as long as the row spacing allows clearance without snagging the drops. Further, there have been developments regarding the use of hollow cones in an overhead broadcast application. Over- and under-laps in the hollow cone swath lead to double-dosing and gaps respectively that are referred to as “Technical Strip Disease”. Combined with considerable drift potential, hollow cones are not recommended.

    Air-assisted drop arms greatly improve coverage uniformity in asparagus in fern. Photo kindly provided by Dr. Torsten Balz.

    Special thanks to Max Underhill Farm Supply (Vienna, Ontario) for use of their sprayer and their assistance both spraying and placing water sensitive papers in the field. Thanks to Mr. Ken Wall of Sandy Shore Farms Ltd. (Port Burwell, Ontario) for providing the site and hosting the associated workshop, and thanks to TeeJet Technologies for their donation of parts and supplies.