Category: Nozzles & Droplets

Articles helping with field sprayer nozzle selection

  • Spraying Asparagus in Fern

    Spraying Asparagus in Fern

    This research was performed in 2012 and since then there have been considerable advances in application technology for asparagus in fern that should be considered. Be sure to read the epilogue at the end of this article.

    Introduction

    Diseases such as purple spot can have major economic impacts for asparagus growers, and the best line of defence is spraying the appropriate control products. The good news is that asparagus growers know this. The bad news is that there are few things harder to spray than asparagus in fern.

    Asparagus infected with purple spot.
    Asparagus infected with purple spot.

    Asparagus in fern can stand 1.5 m (5 ft) high by 1.0 m (3 ft) diameter and is typically planted on 1.2 m (4 ft) centres. Asparagus in fern has a very dense canopy full of needle-shaped leaves. This dense canopy slows air movement, making conditions still, humid and very difficult for a spray droplet to penetrate.

    Spraying asparagus in fern.
    Spraying asparagus in fern.

    Spray coverage is a combination of two factors: the area of the target contacted by spray droplets, and the distribution of spray droplets over that target. For most insecticide and fungicide applications, reasonable coverage is reflected by 10-15% surface area covered paired with an even distribution of approximately 85 medium sized droplets per square centimeter. This is not a rule, but a guideline.

    In order to determine the best way to spray, we have to be able to compare the coverage achieved. To do this, we used water sensitive paper, which is yellow until contact with spray turns it blue. Three sets of three targets were placed in approximately the same location for each pass.

    Water-sensitive paper arranged on stands, ready to be placed in the fern.
    Water sensitive paper arranged on stands, ready to be placed in the fern.
    Diagram defining where water-sensitive papers were located relative to the fern and the sprayer.
    Water sensitive paper orientation and location in asparagus canopy relative to sprayer direction.

    We tested five popular nozzle types, at two ground speeds using three carrier volumes to answer three questions:

    1. Does spray volume impact spray coverage?
    2. Which nozzle style gives the best coverage?
    3. Does travel speed impact spray coverage?

    Does spray volume impact spray coverage?

    Five different nozzle types were used to spray three volumes onto the targets at 16 kmh (10 mph). This was repeated three times and target coverage was determined both as droplet deposits per cm2 (see Figure 1) and total % covered (see Figure 2).

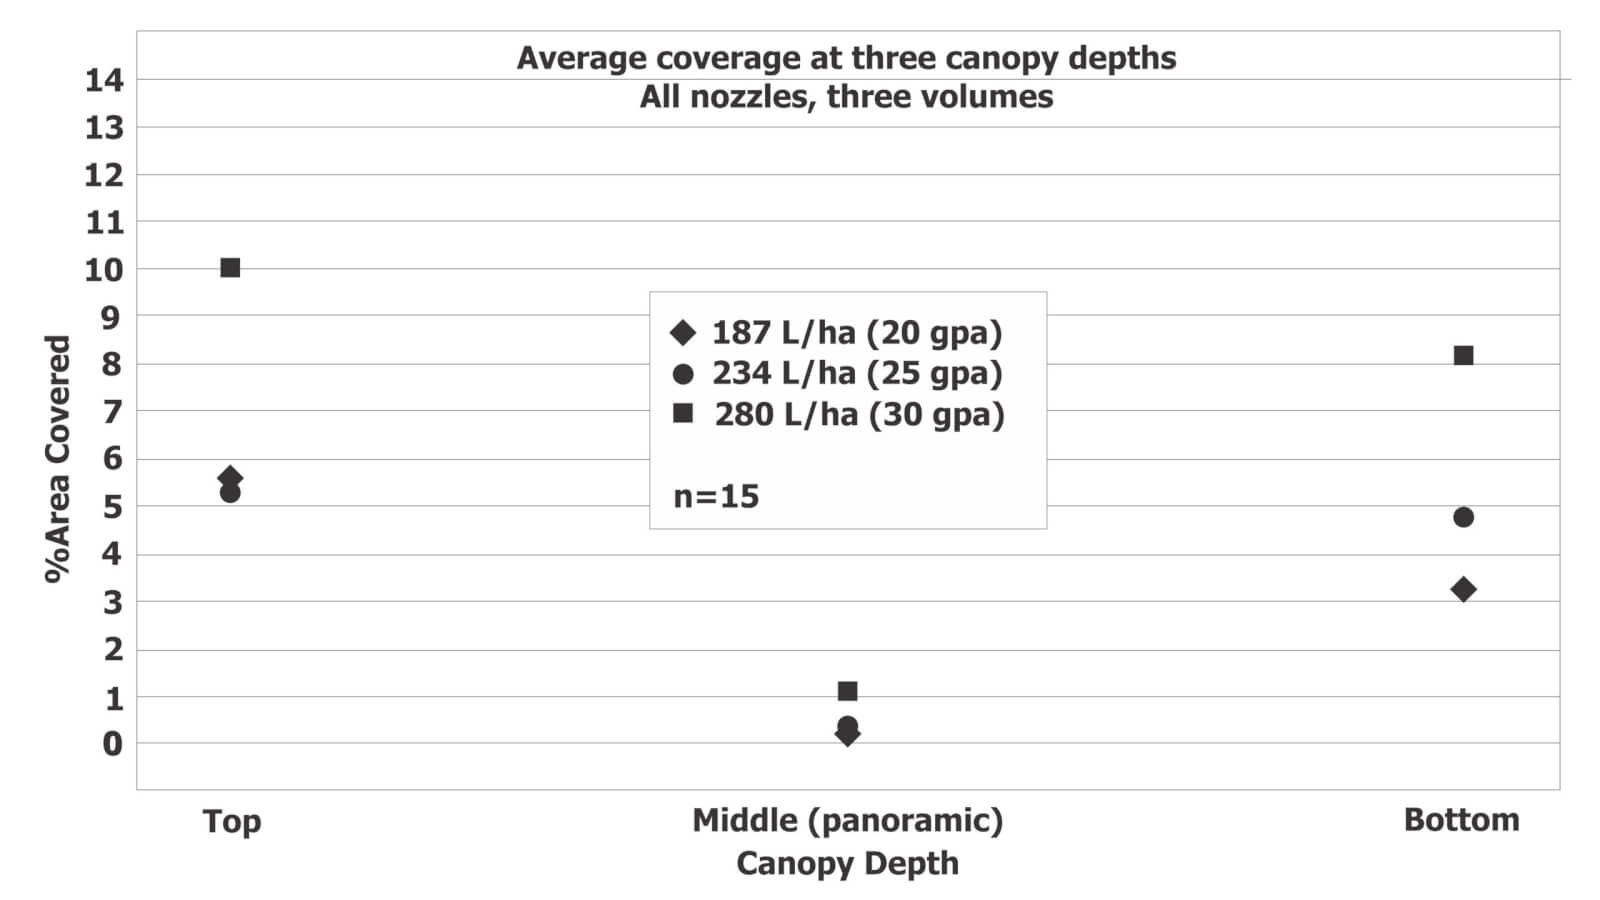
    Figure 1. Average deposits per cm^2 for five different nozzle types at 187 L/ha (20 US gpa), 234 L/ha (25 US gpa) and 280 L/ha (30 US gpa) at a ground speed of 16 kmh (10 mph).
    Figure 2. Combined average percent coverage for five different nozzle types at 187 L/ha (20 US gpa), 234 L/ha (25 US gpa) and 280 L/ha (30 US gpa) at a ground speed of 16 kmh (10 mph).

    Cards in each position consistently received a significantly higher average deposit per cm2 and significantly higher average percent coverage at higher spray volumes. The relatively low coverage in the middle position was anticipated given the orientation of the targets to the sprayer.

    Therefore, it would appear higher volumes result in better coverage, at least up to 280 L/ha (30 gpa). Generally, there is a threshold where exceeding a given carrier volume results in a diminishing return.

    Which nozzle gives the best coverage?

    Coverage from five different nozzles was compared: the Hollow cone, Flat fan, Dual flat fan, Guardian Air and Air-induced hollow cone. Given that 280 L/ha (30 gpa) resulted in the best coverage, the following figures illustrate droplet deposits per cm2 (see Figure 3) and total % covered (see Figure 4) at 280 L/ha (30 gpa).

    Figure 3. Average deposits per cm^2 for five different nozzle types at 280 L/ha (30 US gpa) and 16 kmh (10 mph).
    Figure 4. Average percent coverage for five different nozzle types at 280 L/ha (30 US gpa) and 16 kmh (10 mph).

    The graphs show that each nozzle followed a similar trend, with more droplets at the top of the canopy, less or par at the bottom of the canopy, and considerably less in the middle of the canopy (which is not surprising given the orientation of the target around the stem).

    The trend in droplet density from highest to least coverage is:

    1. Hollow Cone
    2. XR flat Fan
    3. Guardian Air
    4. Dual Flat Fan
    5. Air Induced Hollow Cone

    The percent coverage data was less clear. The top two nozzles for each position were:

    Top Target:

    1. Guardian Air
    2. All other nozzles approximately the same

    Middle Target (around the stem):

    1. XR flat Fan
    2. Hollow Cone

    Bottom Target:

    1. XR flat Fan
    2. Hollow Cone

    It can be argued that the target at the top of the canopy is easiest to spray, and therefore does not have as much importance as the middle and bottom targets. As such, it would appear that the XR flat fan and Hollow cone nozzles give the best overall coverage. It is debatable whether the higher droplet count from the Hollow cone is more important than the higher percent coverage of the XR flat fan.

    Does travel speed impact spray coverage?

    Hollow cone nozzles and XR flat fan nozzles were used to spray targets at two travel speeds and three volumes. Target coverage was determined both as droplet deposits per cm2 (see Figure 5) and total % covered (see Figure 6).

    Figure 5. Average deposits per cm^2 for Hollow cone and XR flat fan nozzles at 280 L/ha (30 US gpa) and either 8 kmh (5 mph) or 16 kmh (10 mph).
    Figure 6. Average percent coverage for Hollow cone and XR Flat fan nozzles at 280 L/ha (30 US gpa) and either 8 kmh (5 mph) or 16 kmh (10 mph).

    The variability in deposit density and percent coverage from medium/fine droplets created by the hollow cone nozzles make it difficult to determine statistical significance, but the trend suggests that higher ground speeds improve coverage in the middle and bottom of the canopy. This is likely due to the wake of the sprayer and the vortices created by its passage stirring fine droplets into the canopy.

    Overall recommendations

    The data suggest that coverage was improved when the sprayer travels at 16 kmh (10 mph) rather than 8 kmh (5 mph). Coverage was also improved at higher spray volumes, where 280 L/ha (30 US g/ac) provided the best overall coverage for all nozzles. As for the best nozzle, this depends on the application; the hollow cone created higher droplet densities than the XR flat fan, but the XR Flat fan created higher percent coverage. Higher droplet densities may be preferred when controlling disease with contact products, but spray drift becomes a significant concern. Higher percent coverage might be preferred with locally systemic products where complete coverage is less of a concern and preventing spray drift is a priority.

    Epilogue

    This work was performed in 2012. Since then there have been significant advances in sprayer design for spraying asparagus in fern. Dr. Torsten Balz (Bayer Application Technology Manager) kindly provided an example of such a sprayer (see below) and a video link to watch it in action. Drop arms that bring the nozzles closer to the target at all canopy depths are an ideal solution as long as the row spacing allows clearance without snagging the drops. Further, there have been developments regarding the use of hollow cones in an overhead broadcast application. Over- and under-laps in the hollow cone swath lead to double-dosing and gaps respectively that are referred to as “Technical Strip Disease”. Combined with considerable drift potential, hollow cones are not recommended.
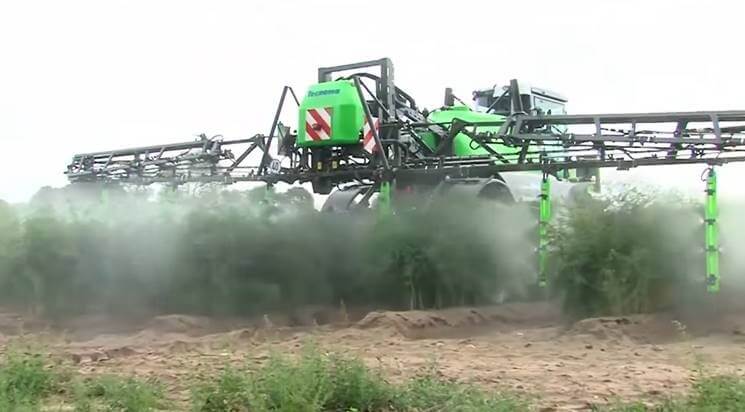
    Air-assisted drop arms greatly improve coverage uniformity in asparagus in fern. Photo kindly provided by Dr. Torsten Balz.

    Special thanks to Max Underhill Farm Supply (Vienna, Ontario) for use of their sprayer and their assistance both spraying and placing water sensitive papers in the field. Thanks to Mr. Ken Wall of Sandy Shore Farms Ltd. (Port Burwell, Ontario) for providing the site and hosting the associated workshop, and thanks to TeeJet Technologies for their donation of parts and supplies.
  • Methods for Applying Fungicides in Corn

    Methods for Applying Fungicides in Corn

    This work was performed with Albert Tenuta (OMAFRA) and David C. Hooker (University of Guelph, Ridgetown).

    Objective

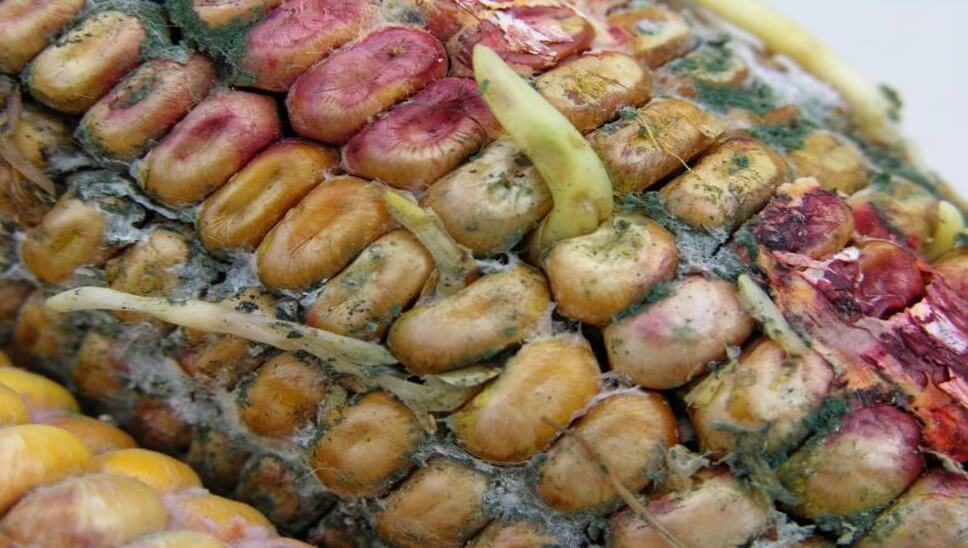
    Gibberella ear rot is a significant disease that reduces the quality of grain corn, especially with the accumulation of mycotoxins (such as Deoxynivalenol (DON)) produced from the causal pathogen(s). Infection occurs through the corn silk channel when ideal temperatures (~27°C) and high humidity are present. Cool, wet conditions after pollination favour disease development and determine the degree of infection. With crop management practices providing only modest improvements in disease control, strategies to increase the efficacy of fungicides are important to investigate. Research has shown that the timely application of fungicide labelled to suppress the disease can reduce mycotoxins, but only by ~50%. We wondered if changes in the method of application could give better results.

    Gibberella ear rot

    It is reasonable to assume that improvements in spray deposit uniformity and increases in overall spray coverage (up to some threshold) at the infection channel (i.e. the silks) should result in improved efficacy. Water sensitive paper is an excellent tool for the qualitative evaluation of spray coverage. However, recognizing the complicated relationship between dose and coverage, we also looked at the deposition of copper sulphate as a surrogate for active ingredient .

    Our primary objective of this study was to compare various sprayer systems and nozzle configurations by evaluating both spray coverage and copper sulfate deposition at the silks.

    Experimental Design

    The test field of hybrid corn had a stand of ~80,000 plants/ha. It was located at Ontario’s U of G Ridgetown Campus and was managed similar to a grower’s field (e.g. fertility, etc.). In August of 2019 we evaluated nine sprayer rigs (or nozzle configurations) in a randomized block design.

    The ground rigs were calibrated to deliver a spray volume of 190 L/ha and the aerial systems to deliver 47 L/ha.  In order to achieve the target spray volume, the ground rig speed varied from 9.5 to 13 km/h, depending on nozzle configuration. The aerial applicators used the same nozzle configuration, travel speed and altitude as in their commercial field applications.

    SprayerNozzle SetNotes
    John DeereYield Center 360 UNDERCOVER drop pipes 75 cm (30″) spacing, each equipped with two Turbo TeeJet (TT) nozzles.Drop pipes were centred between corn rows with nozzles adjusted to spray ~horizontally and directly at the corn silks.
    John DeerePentair Hypro Guardian Air nozzles on 50 cm (20″) spacing.Boom positioned to create 100% spray overlap at tassel height.
    John DeereTurbo TeeJet Induction (TTI) nozzles on 50 cm (20″) spacing.Boom positioned to create 100% spray overlap at tassel height.
    John DeereTurbo TeeJet (TT) nozzles on 50 cm (20″) spacing.Boom positioned to create 100% spray overlap at tassel height.
    New Holland (front-mounted boom)Wilger 60 degree conventional flat fan nozzles on 40 cm (16″) spacing.Boom positioned to create 100% spray overlap at tassel height.
    New Holland (front-mounted boom)Wilger 60 degree conventional flat fan nozzles alternating with custom-made Wilger 40 degree conventional flat fan nozzles on 40 cm (16″) spacing.40 degree nozzles were positioned between corn rows (interrow) while 60 degree nozzles were positioned over the tassels.
    Hagie (front-mounted boom)Drop hoses terminating with TeeJet Duo Nozzle bodies equipped with Turbo TeeJet Induction (TTI) nozzles were alternated with TeeJet XR110 nozzles.Drop hoses were centred between corn rows but nozzles were not aimed directly at the corn silks (aimed down 45 degrees and spray parallel to ground rather than perpendicular). They alternated with the AI nozzles positioned over the tassels.
    HelicopterAir Induction TeeJet Turbo TwinJet (AITTJ) nozzles directed backwards.
    AirplaneCP-111T nozzle bodies with CP256-4015 40 degree flat fan tips on 15 cm (6″) spacing.Wingspan was 14.2 m with a 10.6 m boom width.

    The field was divided into four replicated blocks (REP 1-4 in the image below) which corresponded with a single pass of the sprayer. The sprayers alternated direction with each pass over the four blocks. Depending on the ground rig, a single pass through a block might include more than one set of nozzles. For example, in the image below, a John Deere sprayer carried a different nozzle set on each of four sections, leaving the centre boom section off. Therefore, each block was subdivided into four experimental units that corresponded with each nozzle set. Further, to account for variability, each experimental unit was further subdivided into five ranges. Four water sensitive papers (yellow rectangles) were oriented sensitive-side up and fastened to random corn plants directly on top of silks at each of the five intersections between range and treatment for a total 20 papers. This was replicated four times for a final count of 80 papers per treatment.

    The experimental unit covered by a nozzle set was four corn rows wide (~3 metres). Space was left between each boom section to provide a buffer and no nozzles were placed on the centre boom section. Four water sensitive papers (yellow rectangles) were fastened to random corn plants directly on top of silks at the intersection of each range and for a total 20 x 4 = 80 papers. The chevrons indicate sprayer direction.
    Test plots at University of Guelph, Ridgetown Campus

    Evaluating Coverage

    Each sprayer applied copper sulphate (Plant Products Inc., Leamington, ON) at 2 kg/ha as a chemical tracer. Agral 90 was added to the spray solution at 0.1% (v/v) to better emulate a typical fungicide application. After spraying, each water sensitive paper was allowed to dry, collected and then digitized using a DropScope (SprayX, Sao Carlos, Brazil). Droplet density and percent surface covered were evaluated within the detection limits of the equipment. Dose (represented by deposit volume) was more relevant to this study than percent surface covered, so a spread factor was used to convert area covered to volume. Once the papers were scanned they were subjected to flame emission spectroscopy (FES) (Actlabs – Activation Laboratories Ltd., Ancaster, ON) to determine the amount of copper deposited.

    DropScope digitizing water sensitive paper

    Results

    Deposit area and volume

    Note that papers were placed singly, oriented face-up. This was a missed opportunity to explore abaxial (down-facing) coverage and may have created a small experimental error wherein deposition from copper sulphate would be accounted for on both sides, but would only resolve on one side for area and density analysis. The results from evaluating water sensitive paper suggest trends and serve as quality checks for the experiment.

    The percent area covered on water sensitive papers was affected by nozzle configuration (P<0.0001). Ground rigs produced ~4.0-12.0% area coverage, while aerial produced ~0.7-1.0%. It is not appropriate to compare ground and aerial spraying using water sensitive paper. Water sensitive paper does not reliably resolve deposits under ~60 µm and therefore underestimates the deposits from aerial applications because their spray quality tends to be finer. Further, these figures have not been normalized to reflect the differences in sprayer volume (190 L/ha for ground versus 47 L/ha for aerial).

    The nozzle configurations with the highest percent area covered were produced by the 360 Undercover drop pipes and the TeeJet drop hoses (~9.5-12.0%). Coverage variability increased with percent area covered, but the lower 95% confidence limit with the pipes and hoses still exceed the upper limit of all overhead broadcast nozzles.

    Yield Center 360 UNDERCOVER drop pipes

    When area covered was converted to volume, estimated deposit volume on water sensitive papers was also affected by nozzle configuration (P<0.0001). The estimated volume calculated from deposit area showed fewer statistical differences across nozzle configurations compared to area data. However, once converted, there was no statistically significant difference in the volume deposited by drops or most broadcast methods.

    Copper deposition

    FES residue analysis (i.e. evaluating the amount of copper deposited on targets expressed as mass density) complements the water sensitive paper data. There are some differences that should be noted:

    • All applications sprayed the same amount of tracer per planted area. As such, depositions are more fairly compared with no need for normalization.
    • FES can resolve copper deposits as low as 0.5 µg/sample and may be more sensitive than the WSP method, which does not reliably resolve deposits under ~60 µm.
    • WSP will only resolve coverage on one surface. However, when these papers are subjected to FES, deposits on both sides of the paper will be accounted for, providing a more accurate result.

    As anticipated, there was no correlation between the area coverage or volume estimates and the FES-derived copper deposition data. Estimated copper mass density on water sensitive papers was affected by nozzle configuration (P<0.0001). Analysis showed 56% more copper deposited from the 360 Undercover nozzles (1.75 µg/cm2) compared to the next highest deposition (1.12 µg/cm2) which was from the drop hose configuration (P<0.05). We feel the TeeJet drop hose configuration would have performed better still had the nozzles been directed at the silks, and the alternating broadcast nozzles been omitted and flow redistributed to the nozzles on the drops (see below).

    Copper deposition from the airplane was similar to ground rigs with broadcast overhead nozzle configurations. The airplane deposited ~2x the copper as did the helicopter. It is assumed this is because the rotary atomizer nozzles on the airplane produced a much finer spray quality than the TTI nozzles on the helicopter. This increased the number of droplets considerably and has been shown to produce better coverage, particularly at such low sprayer volumes. Learn more about droplet size and behaviour here.

    Average copper deposition from the Guardian Air nozzle set was similar to all other ground sprayer overhead broadcast setups, but had the highest variability (Between 0.4 and 1.12 µg/cm2). Comparatively, the lower 95% limit of the 360 Undercover drop pipe deposited 3.4x the copper as the lower limit of the Guardian Air.

    Conclusions

    • The best deposition was produced from the Yield Center 360 Undercover drop pipes, followed closely by the TeeJet Duo nozzle body on drop hoses.
    • The deposition from ground sprayers with overhead broadcast nozzles was ~30% less than that of the two drop nozzle systems tested.
    • The deposition from Guardian Air and TTI nozzles were among the lowest of broadcast nozzle configurations with higher variability, but differences tended not to be statistically different (P=0.05) compared to other broadcast nozzles.
    • The deposition from the airplane was similar to the ground rig overhead broadcast applications, but the helicopter deposited the lowest amount of copper overall, likely due to droplet size (see image below).
    Helicopter with air induction TeeJet Turbo TwinJet (AITTJ) nozzles directed backwards.

    Next steps

    In the summer of 2022 we re-evaluated promising nozzle configurations from this study, as well as other application methods (see bulleted list below).

    • Include various RPAAS (remote piloted aerial application systems) designs.
    • Include the Agrotop Beluga drop hose (Greenleaf Technologies, Louisiana, USA) with two nozzle bodies to span the silking zone of the canopy.

    We used water sensitive paper as a qualitative indicator, but folded them to get adaxial and abaxial data. We also used copper deposition to indicate dose. Once the results are analyzed we’ll write a companion article to this one.

    In 2021 and 2022 a separate study was performed to evaluate the efficacy, ease-of-use and return on investment of the Beluga drop hoses in corn. An article describing that work can be found here.

    Thanks to the agrichemical companies, students, equipment owners and operators that donated their time and equipment to make this study possible.

    Bonus

    Watch these very cool slow-motion videos of the airplane and helicopter applications. Note that there is no difference in how the spray behaves once released; It deposits as a function of wind, gravity and momentum and is not “blown in” by the helicopter.

  • Variable Rate Spraying

    Variable Rate Spraying

    Variable rate spray application is receiving a lot or attention with our increased ability to farm according to prescription maps.  For dry products such as seed or fertilizer, metering is relatively straight-forward and variable rate application has been possible for many years. However, liquid product application has been more complex and requires special approaches

    Hydraulic Pressure and Flow Rate

    In conventional liquid metering, the liquid is forced through a metering orifice that is placed in-line.  This could be an orifice plate for liquid fertilizer, or a flat fan nozzle for pesticides.  Rate control is achieved by altering the spray pressure. It is usually impractical to change the nozzle or metering orifice during an application.

    The main drawback to this approach is that spray pressure is not very effective at changing flow rates due to the square root relationship between spray pressure and flow rate.

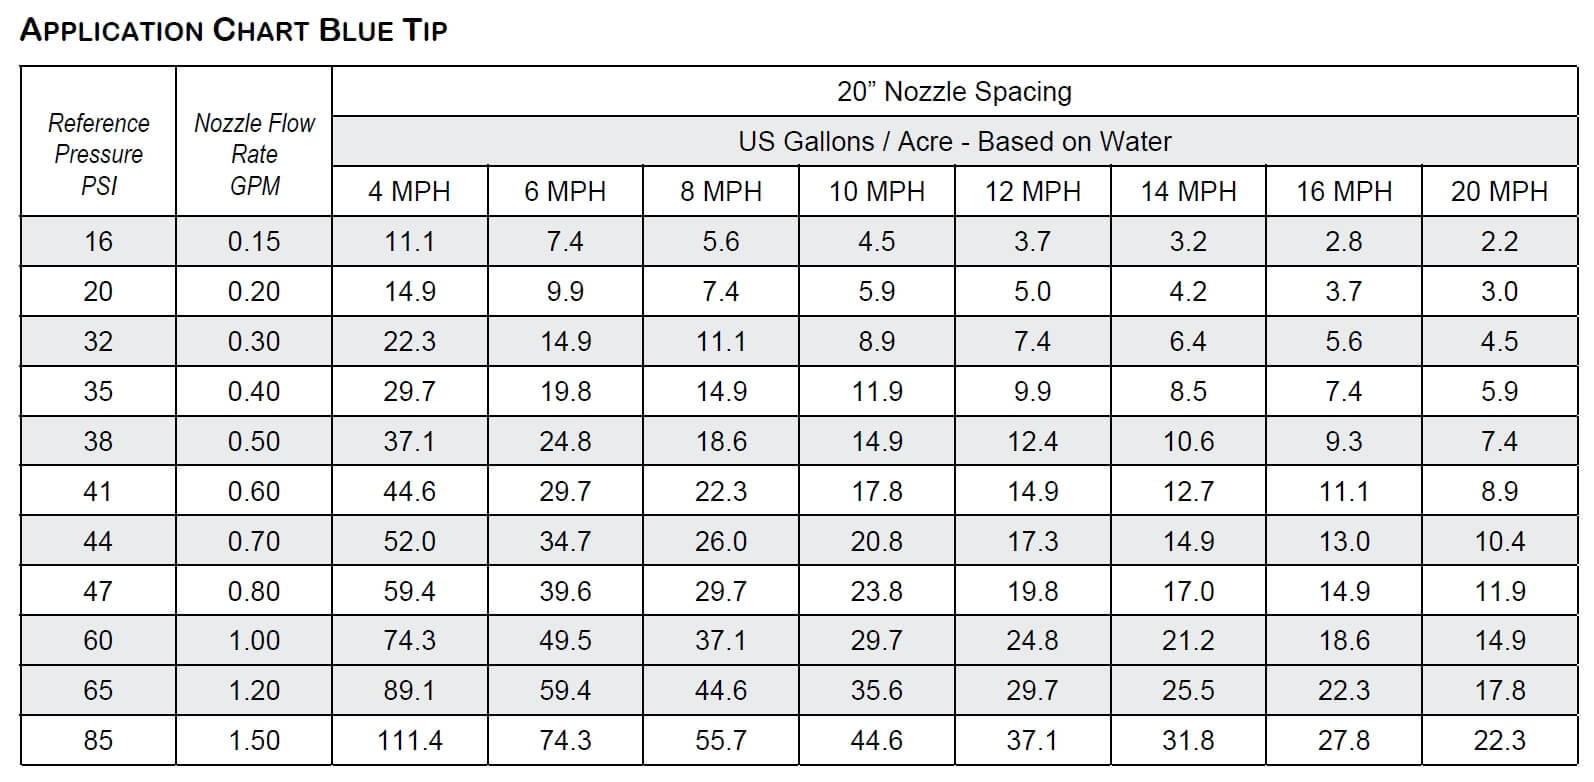
    For example, with reference to the table below, one can see that doubling the spray pressure (say, from 30 to 60 psi) only increases the flow rate by 40%. Tripling the pressure (from 30 to 90 psi) increases the application volume by 73% (we can call that a factor of 1.73). As a result, the use of pressure alone doesn’t offer a large range of application rates, and we accept a factor of 2 to be the limit for fertilizer streamer and broadcast nozzles (meaning a four-fold pressure range) and a factor of 1.73 to be practical for broadcast pesticide sprays over a 3-fold pressure range.  Any wider application volume range would require adjustment to travel speed.

    Application Chart 2015 cropped

    With these inherent limitations in flow rate capacities from hydraulic pressure alone, applicators are often forced to use wide pressure fluctuations to achieve reasonable rate responses.  In some cases, this means that pressure needs can be too low for uniform distribution, or too high for pump or plumbing capacities.

    For Variable Rate application, we are less interested in travel speed range, and are more interested in flow rate range. The above chart can be used for both purposes. In the above example, rows under each application volume identify the travel speed range. These headings can be flipped, so the 10 gpa column (with mph values in it) can also be a 10 mph column (with gpa in it). the numbers don’t change. same is true for metric units, except the convenience of being in the same magnitude that makes the flip easy in US units is absent.

    There are a few options available that expand the flow rate range of liquid products.  A brief overview of the main options follows:

    Greenleaf / Agrotop

    TurboDrop Variable Rate (TDVR): This nozzle appears like the traditional TurboDrop family, but has an innovative dual orifice in its venturi. The first stage is always open, but the second orifice is held closed under spring pressure until a certain threshold is reached. This design achieves a 3-fold flow rate range between 40 and 140 psi. Below the 40 psi threshold, the spray pattern fan angle deteriorates quickly.

    TurboDrop VR tip provides about 3-fold flow rate range at any given speed, but requires higher pressures.

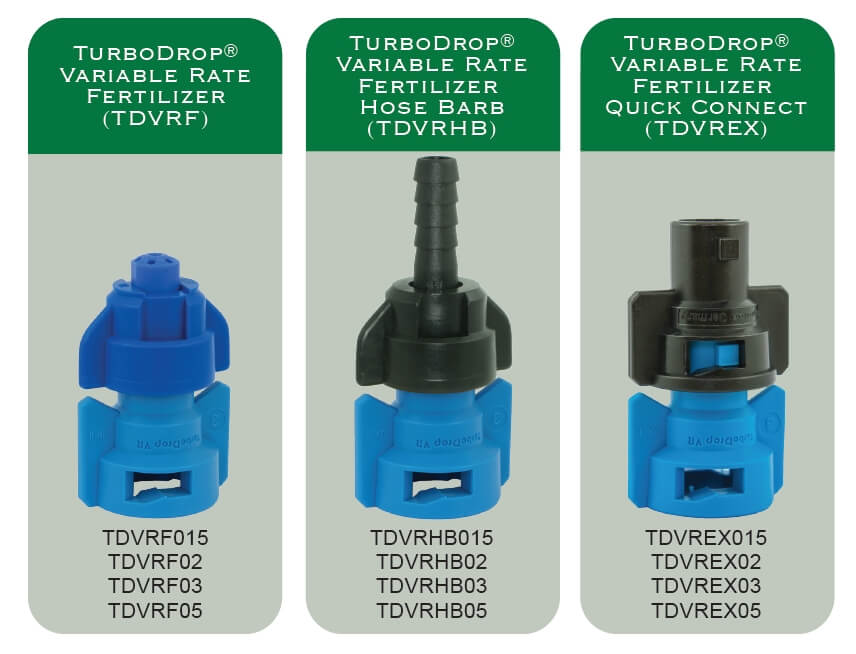
    TurboDrop Variable Rate Fertilizer (TDVFR): Because fertilizer streams do not need to atomize the spray or form a fan, the minimum pressure can be reduced, in this case to 10 psi. From 10 to 140 psi, this design offers a four- to five-fold range of flow rates. Three exits are offered, a streamer, a hose barb, and a quick connect.

    Three variants of the variable rate fertilizer orifice are offered by Greenleaf.

    VariTarget Nozzle

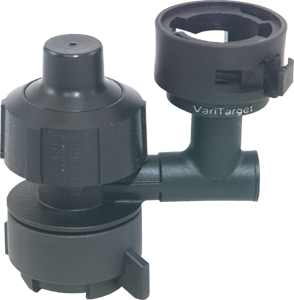
    This nozzle design uses a spring-loaded plunger to exert force on a flexible nozzle cap, deflecting it slightly.  The deflection changes the orifice size, allowing for a change in flow.  As a result, the flow rate response to a pressure change is increased dramatically. A single VariTarget nozzle equipped with a blue or green nozzle cap can deliver flows ranging from 0.2 US gpm at 20 psi to 1.2 gpm at 65 psi, for a stunning 6-fold change in application rate (link).

    VariTarget
    The VariTarget nozzle body

    The main drawback of this nozzle is the poor metering accuracy of the system. In calibration tests, flows from various new VariTarget nozzles operated at the same pressures varied by more than 10%.  While this amount of variability may be acceptable in liquid fertilizer application, it is not considered acceptable for pesticide application. Tightening or loosening the threaded spring cap even a little changes the flow.

    VariTarget Flow Chart

    TeeJet Variable Rate Fertilizer Assemblies

    These metering assemblies, introduced in 2016, offer an elastomer (EPDM) metering plate whose orifice diameter expands with pressure, offering a wider range of flows.  There are no moving parts in the assembly.  Four models are available (link).

    IMG_20160112_112250662

    PTC-VR:  Using a push-to-connect design for planters and toolbars, it offers versions that accomodate 1/4″, 5/16”, and 3/8” OD tubing diameters

    QJ-VR Hose Barb:  This unit offers hose barb diameters for 1/4″ and 3/8” ID hose.

    Both units feature a pressure range of 10 psi to 100 psi, within which a flow rate range of approximately 8-fold is possible.

    SJ3-VR: This unit generates three streams and operates over a pressure range of 20 to 100 psi, offering a flow rate range of about 3-fold.

    GPA ranges for specific travel speeds for TeeJet SJ3 VR

    SJ7-VR: Generating seven streams and operating over a pressure range of 30 to 80 psi, this unit allows a flow rate range of about 2.9.

    In all cases, the realized flow rate range is significantly greater than would have been achieved with pressure change alone. TeeJet has tested the flow rate variance among units operating at the same pressure and has found them to be acceptable, according to company representatives.

    Fertilizer banding has greater tolerances for application because pattern width is less important, and also because stream stability is less affected by pressure than spray pattern droplet size.

    Pulse Width Modulation (PWM)

    PWM utilizes conventional plumbing:  a single boom line and a single nozzle at each location.  Liquid flow rate through each nozzle is managed via an intermittent, brief shutoff of the nozzle flow activated by an electric solenoid that replaces the spring-loaded check valve.  Typical systems pulse at 10 or 15 Hz (the solenoid shuts off the nozzle 10 or 15 times per second), and the duration of the nozzle in the “on” position is called the duty cycle (DC) or pulse width.

    100% DC means the nozzle is fully on, and 20% DC means the solenoid is open only 20% of the time, resulting in the nozzle flowing at approximately 20% of its capacity. This is illustrated in the figure below.  The ability to control the duty cycle is referred to as pulse width modulation.

    PWM Schematic

    The system has a theoretical flow rate range of about four- to five-fold. Within this range, spray pressure, and the corresponding spray pattern and droplet size, stay roughly constant.  This makes it ideal for variable rate pesticide application, where spray patterns and spray quality are critical for performance.

    The main disadvantage of this system, compared to the variable orifice designs, is cost. Although highly accurate and dependable, commercial sprayer units are priced between $15,000 and $65,000 per sprayer, depending on features and boom widths. The available systems are Capstan PinPoint II and EVO (as a retrofit to any sprayer), Raven Hawkeye (retrofit to any sprayer, available as factory option on Case (AIM Command), New Holland (IntelliSpray) and most other brands, John Deere ExactApply, WEEDit Quadro, Agrifac StrictSprayPlus and TeeJet DynaJet (available as retrofit). See our in-depth article on PWM for more information on these systems.

    For ammonia and liquid fertilizer planters or toolbars, Capstan offers three different PWM products, N-Ject NH3, N-Ject LF or EVO LF. These systems offer more control over PWM pulse frequency and duty cycle and can achieve 8-fold rate ranges. 

    Flow rate ranges for Capstan N-Ject LF, on 30″ spacing

    At low frequencies and duty cycles, the mobiliy of the fertilizer in soil needs to be considered, as significant gaps in a stream can be generated.

    A variable rate for liquid fertilizer system for seeders, together with sectional control and turn compensation, is offered by Capstan EVO-LF. This system can generate 10 to 60 gpa at 4.5 mph on 12″ spacing.

    Dual Boom Systems

    A second boom fitted with different flow nozzles is installed, and is activated when the flow rate requirements can no longer be met with a single set of nozzles.  Once the second boom is activated, the spray pressure drops significantly and additional flow capacity can be realized.

    Dual boom system

    Dual or Quadruple Nozzle Bodies

    A similar approach to the dual boom is available as selectable nozzles in the same body from Arag (Seletron), Hypro (Duo React), John Deere (ExactApply) Amazone (AmaSelect), and others. These systems utilize a single boom and direct the flow through one of any two (Duo React, ExactApply, Seletron) or four (Seletron, others) nozzles, or several nozzles at the same time. 

    AmaSelect utilizes a unique switching system that allows the user to select only Nozzle 4, Nozzle 3, Nozzles 3 & 4, and Nozzles 2 & 4, making the placement of certain sized nozzles critical.

    Amazone AmaSelect nozzle switching system

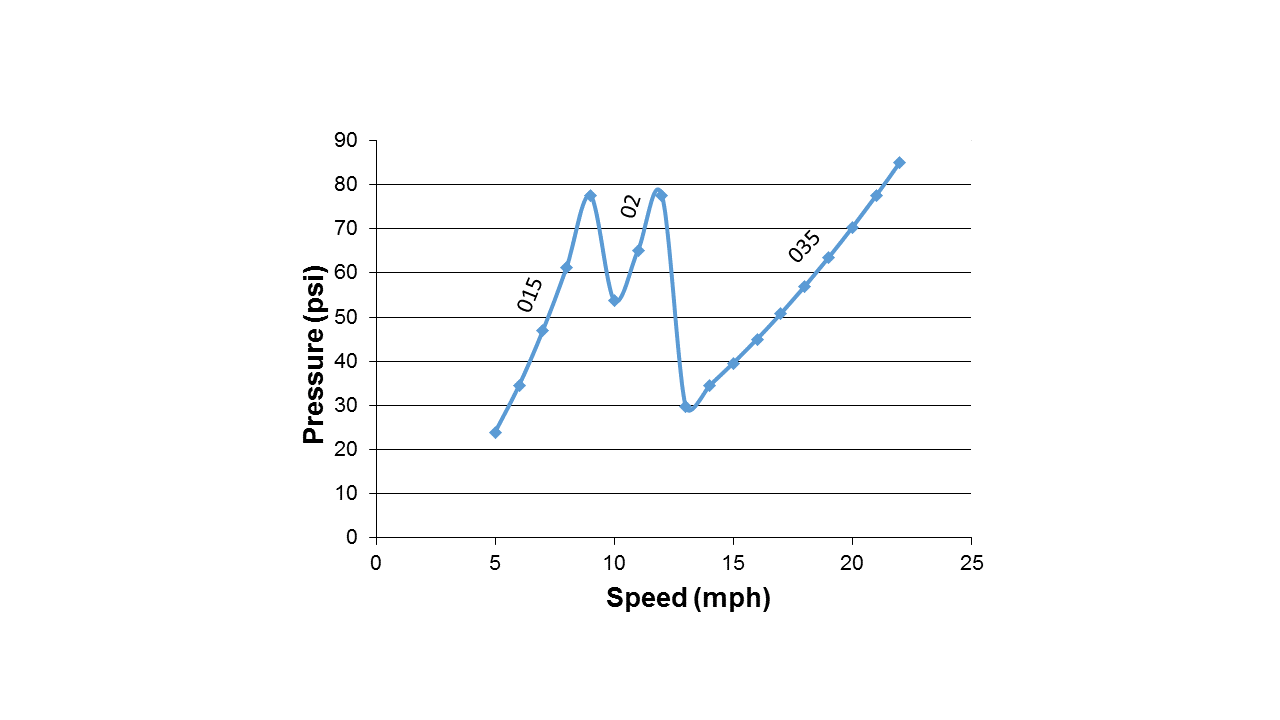
    Similar pressure fluctuations as with a dual boom would be experienced, requiring careful selection of nozzle flow rates to avoid large pressure jumps. The system can also be used to manually change from one nozzle to another as needed. In the figure below, the pressure changes associated with the sequential use of 015, 02, and 035 flows are shown.

    Duo React

    Direct Injection

    Direct injection is an option for variable application of pesticides.  In this system, undiluted pesticide is placed into canisters on the sprayer, and plain water (or water plus adjuvant) is in the sprayer tank. The chemical is metered and introduced into the water on the pressure side at some distance upstream from the boom sections. The pesticide rate can be varied with the speed of the direct injection pump, offering a very high dynamic range of possible rates. For example, Raven’s Sidekick Pro (available as factory option on Case and John Deere sprayers, or as a retrofit to any sprayer) offers a 40-fold range of flow rates.

    20140123_145619

    After injection, an in-line mixer ensures that products are evenly distributed in the carrier.  The amount of lag in the systems will depend on the amount of spray mixture in the plumbing upstream of the nozzles, the total boom flow rate, as well as the boom section configuration.  With a variable rate map this lag can can be anticipated and accommodated.

    Pump technology has improved the metering accuracy over a range of viscosities. However, dry formulations remain a challenge as slurries can settle and create problems for the pump and screen components.

    Summary

    High dynamic flow rate ranges for agricultural sprays are challenging to achieve, but will become more important as interest in site-specific management increases.  Relatively inexpensive solutions are available for liquid fertilizer, whereas pesticide sprays require greater investments in technology to preserve spray pattern integrity. As mapping sophistication continues to grow, these application technologies will be integral to variable input prescriptions.

  • How Spot Spraying will Affect Sprayer Design

    How Spot Spraying will Affect Sprayer Design

    Some years ago, a friend recommended that I read The Tipping Point by Malcolm Gladwell. In this book, Gladwell tries to understand why some things catch on, and others don’t. It’s a compelling read full of Gladwell’s trademark stories and his knack to deftly interpret scientific studies. He talks of connectors, mavens, and salesmen, as well as the “stickiness factor”, a measure of how memorable something is, as keys to success of products and ideas. I think of the book often as I ponder the many good ideas in agriculture, many of which never see widespread adoption.

    One of these good ideas is spot spraying. Green-on-brown detection was first introduced in the early 1990s. Anyone remember the Concord DetectSpray? It was great but had bad timing, as resistance wasn’t a big issue and glyphosate prices were about to slide. Green-on-brown grew to the NTech (later Trimble) WeedSeeker a few years later. Rometron’s WEEDit built on Trimble’s success and found widespread adoption in Australia in the past ten years. Spot spraying did not gain any traction in North America during this time.

    Australia is unique in many ways, not the least of which is their summer spraying practice. Summer is the hot, dry season where land is typically fallow and weeds are kept in check with herbicide sprays (aaaah, the serenity). Making several passes over a field, combined with the need to control some larger and hardy plants, is expensive, and a spot spray saves much of the cost. The savings can be put to use with more effective herbicide tank mixes that delay the onset of herbicide resistance. Spot sprays pay for themselves in short order Down Under.

    It’s more of a challenge in the northern plains of North America, where the fallow season involves snow cover and burnoff occurs in a short window before seeding and sometimes after harvest. But nonetheless, spot sprays have a fit for many of the same reasons.

    WEEDit is the first system to make serious inroads in North America, with several dozen systems having been retrofitted to high-clearance sprayers. High detection accuracy and hardware reliability is proven in three seasons.

    On March 2, 2021, John Deere entered the Green-on-brown spot spray area with See & Spray Select. This not to be mistaken as competition. Instead, the entry of a major brand provides validation of the concept like only a large manufacturer can. Yes, we’ve reached a tipping point.

    While the first Green-on-brown units are becoming established, Green-on-green, the ability to detect weeds within a crop, continues to be developed around the world. French startup Bilberry has made enough gains in Australia to bring its product to market with Agrifac, where it’s called AIC Plus. In farmer field trials, they have achieved 90 per cent detection accuracy of wild radish in Western Australia, and claim that they are ready for broadleaf weed identification in wheat, barley and oats. Bilberry’s technology will also be seen on Australia’s Goldacres and France’s Berthoud. Other startups, notably Israel’s Greeneye Technology, plan to introduce a Green-on-green system in the U.S. in the near future. Amazone, the German farm equipment giant, partnering with Xarvio and Bosch, announced plans at Agritechnica to have a commercial unit for sale by 2021.

    This technology will have significant impact on sprayer design philosophy. At present, productivity is synonymous with capacity, and large tanks with commensurate heavy and powerful tractor units dominate. Spot spraying savings will depend on weed density and hardware resolution, but 50 per cent to 90 per cent reductions in spray volume can be expected. A 1,600-gallon tank would no longer be necessary. The savings in frame weight and horsepower would be significant, as would the time savings from less intense tendering demands. These savings would offset the lower driving speeds that accompany sensing technologies, and, overall, provide a lower bar for autonomous operation. We may see lighter specialty spot sprayers.

    The savings in brute size will be countered by increased sophistication. Better boom height management is essential for spot spraying, not just for the sensor to properly see the target and estimate the time needed for the boom to reach that spot, but also for the spot spray itself to deliver the right dose. In any fan spray, band width at ground level changes with height, and that, of course, is related to dose. Trailed booms can address this issue easily.

    But not everyone wants a specialty spot sprayer that would require an extra pass over the field. With growing utility of soil residual herbicides, dual tank sprayers—small tank for the spot spray, large tank for the broadcast residual—make sense. Large sprayer frames can accommodate an additional smaller tank, second pump, and plumbed boom easily.

    Plant detection and identification bring other opportunities. Adjusting dose for plant size is one of the first, or for harder to control weed species.

    Spot sprays rely on fast, precise response of the nozzle, and this provided by fast-reacting solenoids that are part of pulse-width modulation (PWM) systems. On a broadcast sprayer, these solenoids can change the emitted dose instantly, within a certain envelope, by altering the duty cycle of the pulse. This, however, works best in the context of a boom with overlapping spray patterns. A single band spray would not change dose with duty cycle as easily.

    Higher dosing would be an opportunity for multiple nozzle bodies that are able to spray one, two or more nozzles in the same spot simultaneously. These are already widely available and popular in Europe.

    This also brings direct injection into play. Current systems introduce the active ingredient into the boom upstream of the nozzles, affording it time to mix into the water. For true spot spray utility, though, direct injection ought to be at the nozzle. Only then can custom mixes and rates be applied on a spot basis. It’s been done before, if only to show how difficult it would be to deliver uniform doses to a spot spray machine.

    Spot spray sensors have agronomic benefits. By recording the location sprayed, weed patches can be mapped. As plant identification becomes possible, it’s conceivable to obtain plant species and stage distribution maps from the spray pass That would turn the sprayer into a high-resolution crop scouting tool. As machine learning and sensor sophistication grows, other plant and soil parameters can be mapped. The agronomic value of such maps, especially if created over the course of the growing season, is immense. Of course, data density, handling, storage, and analysis will constrain this.

    If the past has taught us anything, it’s that there seems to be a appetite for investment in farm equipment. Sprayers have been the most-used implement on the farm for some time, and their popularity continues despite sharp price increases. These new capabilities will only add value to these implements. Prepare for sticker shock, followed by acceptance and adoption.

    What will a future spot sprayer look like? Although it will have tanks and booms, the level of electronic sophistication will make it so much more versatile we can’t yet imagine all the ways in which it might be used. But it seems to me the situation has tipped and we’re already accelerating toward that future.

  • The Droplet Size Debate

    The Droplet Size Debate

    Funny how some issues never go away. For as long as I’ve been in the sprayer business, the question of ideal droplet size for pesticide application has remained a hot topic.  At its root are the basic facts that small droplets provide better coverage, making better use of water, but large droplets drift less.  So why are we still debating this? Because we need both of these properties to be efficient, effective, and environmentally responsible. Ultimately, the droplet size question is reduced into one of values, where everyone’s individual priorities play a role. 

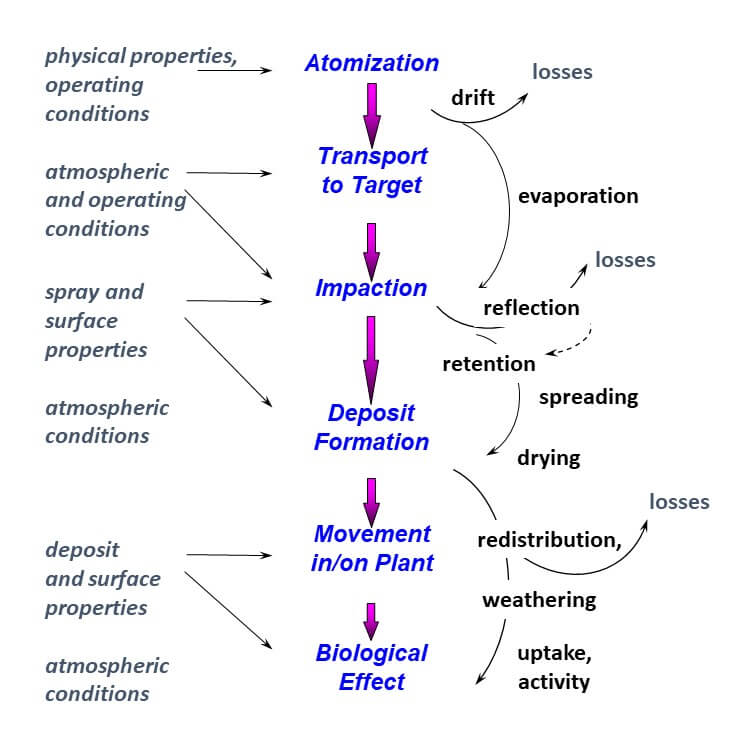
    First, let’s talk about basic principles. To be effective, an active ingredient must make its way from the nozzle to the site of action in the target organism. On the way, it encounters several obstacles as summarized by Brian Young in 1986.

    Figure 1: The dose transfer process of pesticides (after Young, 1986)

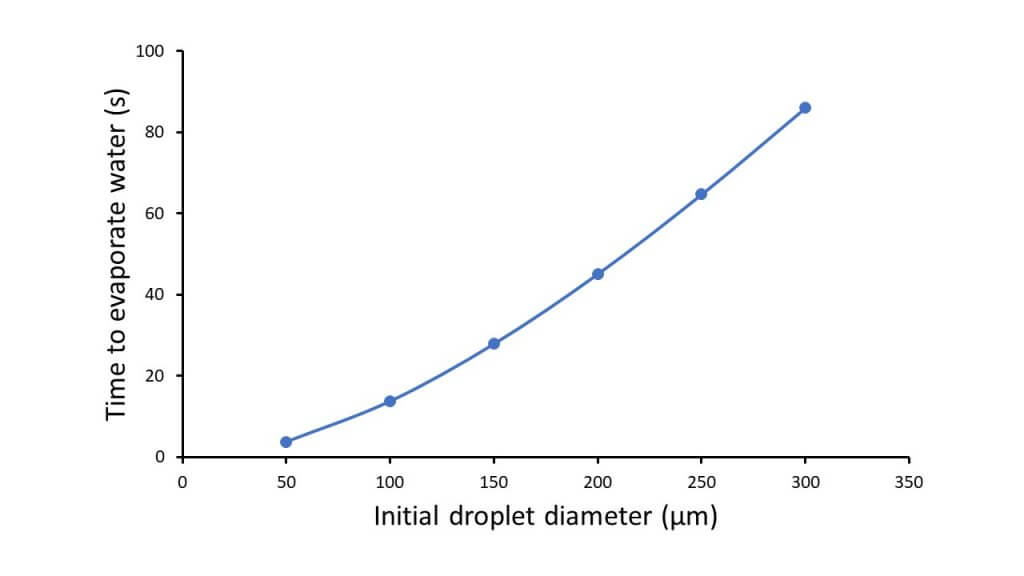
    After atomization and before impaction, the spray encounters two main losses, evaporation and drift. Both of these are more severe for smaller droplets. Smaller droplets have a greater ratio of surface area to volume for any given spray volume, and can evaporate to a much smaller size, even to dryness depending on the formulation, in seconds. For water-soluble formulations, one consequence is lower uptake. Oily formulations may maintain efficacy, but neither type can escape the second effect, spray drift.

    Figure 2: Time to evaporate all water from droplets of various sizes, based on the “two-fluid” model developed by Wanner (1980). Based on 0.8% v/v non-volatile, non-soluble addition, 20 ºC, and 50% RH. This model suggests that final droplet diameter is 20% of initial diameter. Reproduced from Microclimate and Spray Dispersion by Bache and Johnstone (1992, Ellis Horwood Ltd).

    Small droplets are more susceptible to displacement by wind currents due to their small mass. There is no magical size above which drift is no longer possible, but we’ve generally used diameters of 100, 150, or 200 µm as a theoretical cutoff. The proportion of the spray’s volume in droplets smaller than these diameters can be called “drift potential”, and this value is useful to measure the impact of nozzle type, pressure, or formulation on that phenomenon.

    But it’s not quite that simple. Even a small droplet may resist drift if its exposure to wind is limited, perhaps through a protective shield shroud, or lower boom height. Or by increasing its speed through air assist. Higher energy droplets resist displacement.

    These mitigating strategies aren’t lost on sprayer manufacturers who have used them for decades to build lower drift sprayers.

    The next phase of the dose transfer process is interception. The droplet has to encounter its target, but the process is mostly coincidence. Simply put, the target has to be in the way of the droplet’s flight path for the two to meet. Denser canopies are therefore more effectively targeted. A larger number of droplets (smaller droplets or more carrier) also improve the odds. But it’s not that simple. Flight paths can change. That’s where small droplets are more inventive. Because they respond to small air currents, and because such small currents surround most objects, the smaller droplets can weave around objects, following the small eddies generated by air flows. As a result, we’re more likely to find smaller droplets further down in denser, more complex canopies where the eye can’t follow. They simply cascade through.

    Larger droplets, on the other hand, resist displacement by air and travel in straighter lines. They tend to hit the objects they encounter. For that reason, larger droplets are intercepted by the first object they reach and only make their way deeper into a canopy if the path is clear. In other words, vertical, sparser objects allow larger droplets to pass by.

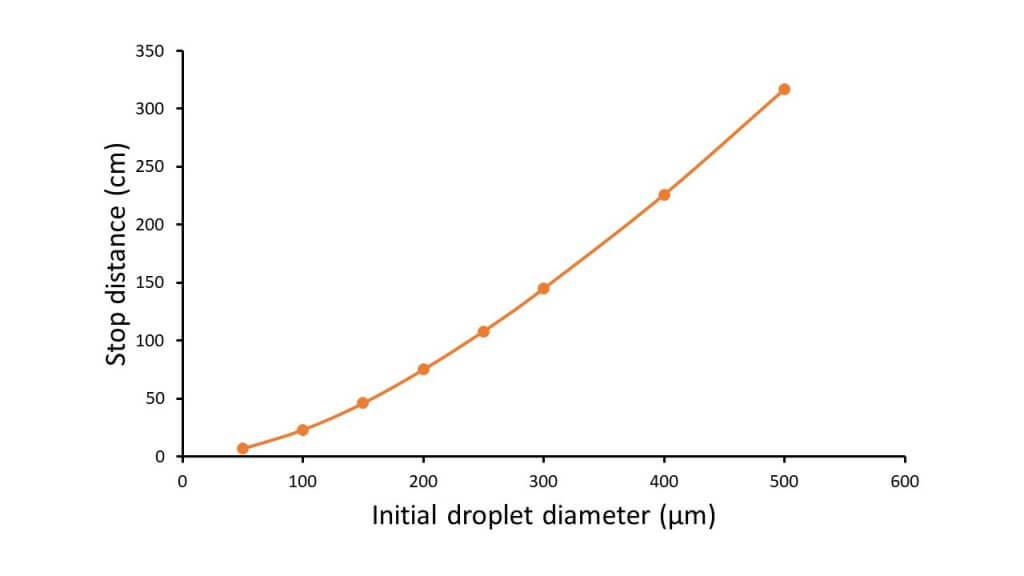
    These properties are related to the droplet’s inertia, and are best described by a parameter known as “stop distance”. Assuming an initial velocity, stop distance is the distance required by a droplet to slow to its terminal velocity.

    Figure 3: Stop distance as a function of droplet size. Assuming a 20 m/s initial velocity (similar to exit velocity of a hydraulic nozzle) and gravity assistance. Note that smaller droplets without the benefit of air assist lose their initial velocity within a few cm of the nozzle exit. Reproduced from Microclimate and Spray Dispersion by Bache and Johnstone (1992, Ellis Horwood Ltd).

    These characteristics, combined with the aerodynamic properties of objects such as tiny insects, cotyledons, leaves, stems, etc. govern the collection efficiency of sprays. Small, slow moving droplets are thus best captured by small objects that don’t create strong enough deflections of airflow to steer the droplets past. Large objects that redirect air around them very effectively are better collectors of the larger or faster droplets whose kinetic energy can guide them through this turbulence. It’s also a matter of probability, as the smaller objects tend to have a lower likelihood of encountering the relatively scarce large droplets of any given spray.

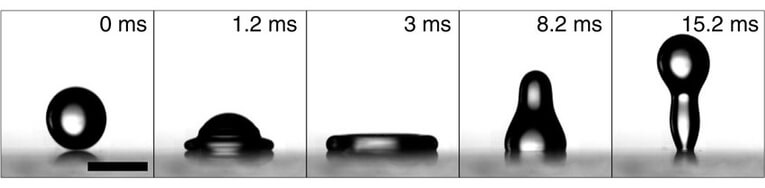
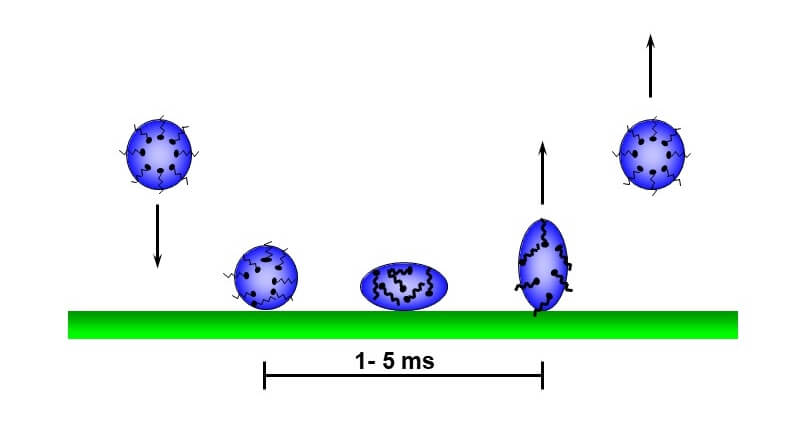
    But once again, that’s not the end of the story. Interception is followed by a critical stage, retention. Objects must be able to hold onto the droplets they intercept. Slow motion video has shown that droplets flatten out on contact with an object as the liquid converts impaction velocity into lateral spread. Once at full extension, the flattened droplets will collapse even beyond their original round shape, pushing them away from the surface and possibly causing rebound. A rebounding droplet may eventually land on target, but that would be a matter of fortune. It’s better if the leaf can offer enough adhesion, diminishing the power of the rebound oscillation, allowing droplet to stick the first time.

    Figure 4: Droplet deformation during impact (C. Hao, et al. 2015. Superhydrophobic-like tunable droplet bouncing on slippery liquid interfaces. Nature Communications. August 2015).

    Small droplets have less mass, and tend to be retained more easily. But more than size is at play here. The morphology and chemistry of the leaf surface is also important, with crystalline or more oily surfaces offering less adhesion for droplets. The physico-chemical properties of the spray mixture becomes important, as characteristics such as dynamic surface tension and visco-elasticity affect spray retention. These properties are optimized through the product formulation effort, and possibly via adjuvants added to the tank.

    We sometimes classify targets as “easy to wet” or “difficult to wet” to summarize these properties. Most grassy plants (foxtails, cereals) are difficult to wet (there are exceptions, such as the sedges) and broadleaf plants vary from the easy to wet pigweeds to the difficult to wet lambsquarters and brassicas. Easy to wet species can retain larger droplets than difficult to wet species, and that’s one reason why finer sprays are preferred for grassy weed control (leaf orientation and size are another).

    Figure 5: Droplet deformation, and surfactant molecule alignment, during impaction. The inability of surfactants to reach optimal alignment quickly, and for the target surface to absorb these forces, leads to rebound.

    A few words about surface tension. Although surfactants reduce surface tension and facilitate spreading, this may not be enough to improve spray retention. To be effective, surfactant molecules need to align themselves with the surface of the droplet so they can be a “bridge” at the interface where the droplet meets the target surface. This takes time. The oscillations that occur during impaction continuously create new surfaces, and if surfactant molecules don’t follow suit immediately, the droplet will behave as if no surfactant is present.  Specialists measure “dynamic” surface tension, i.e., the surface tension at young surface ages – a few milliseconds – to better predict spray retention. Very young surface ages have surface tensions of plain water, even with a surfactant present. Only certain surfactants, or higher concentrations of surfactants, can actually improve spray retention.

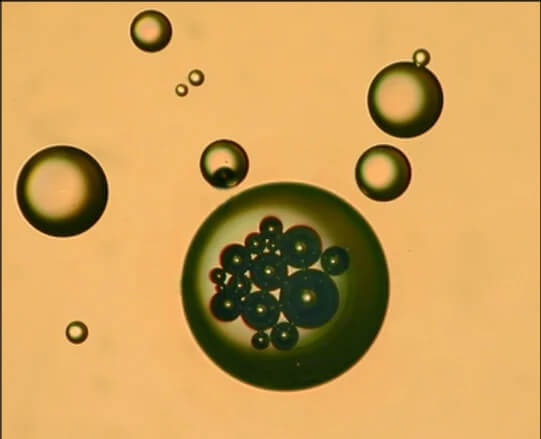
    When air-induced nozzles were introduced in the mid 1990s, one of their claims was the improved spray retention due to air inclusions (bubbles) in the individual droplets. These bubbles made the droplets lighter, and also reduced their internal integrity, promoting breakup on impaction. As a result, the coarser sprays they produced actually had some of the same efficacy performance as the finer sprays they replaced. And indeed, research showed that coarser, air-induced sprays did in fact maintain good performance. Interestingly, performance of non-air-induced coarse sprays used with pulse-width modulation also showed similar robustness of performance. Research comparing air-induced to conventional sprays of similar droplet size rarely showed differences, and when they occurred, they were small in magnitude and could be corrected through improved pattern overlap.

    Figure 6: Air Bubbles in spray droplets (Source: EI Operator. Believed to originate with Silsoe Research Institute, UK)

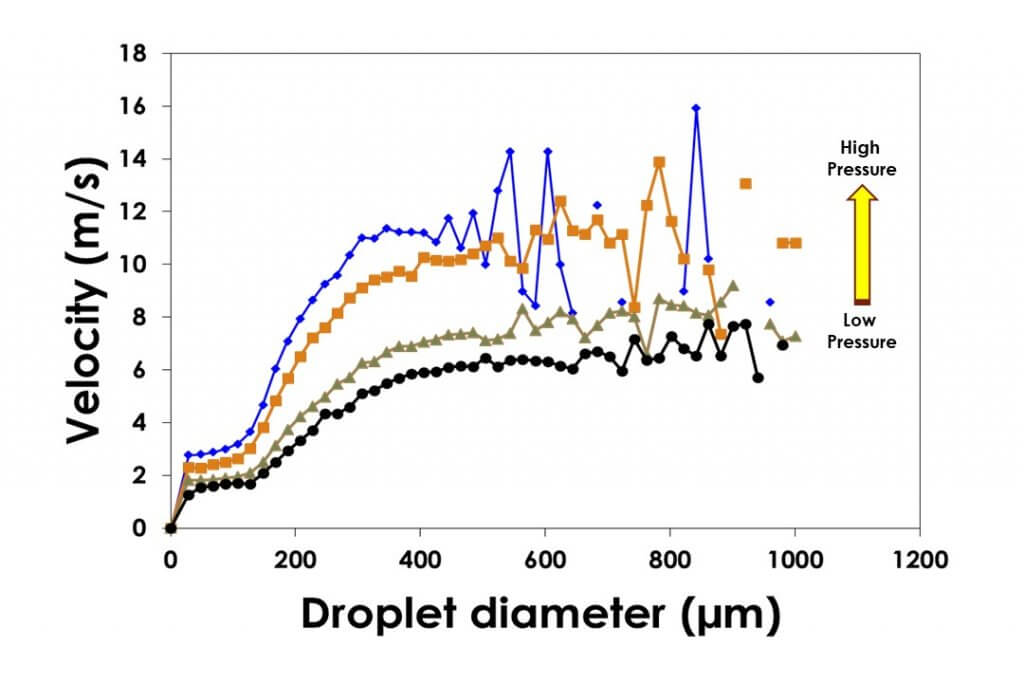
    One reason larger droplets still work well is due to the pre-orifice designs of modern low-drift nozzles. This design reduces the internal pressure of the nozzle itself, with the effect being a slower moving large droplet. This reduced velocity takes away some of the force at impaction, reducing rebound.

    Figure 7: Droplet velocity of larger droplets is reduced by lower pressures from pre-orifice and air-induced design nozzles. Lower velocities reduce droplet rebound.

    Another neat effect of coarser sprays is their ability to entrain air. All sprays move air (simply spray into a bucket to see this), and larger droplets do this better and for longer distances. The entrained air is a form of air assist for the smaller droplets, increasing their average velocity and thus reducing their drift potential while they move in the spray pattern. 

    The final stage of the dose transfer process is deposit formation and biological effect, and that’s where we once again see differences attributable to droplet size.

    Once established on a target surface, the active ingredient usually needs to move to its site of action. In some cases, resting on the surface is sufficient, it depends on the specific product. But for the majority of herbicides, the active ingredient must move across the cuticle into the cytoplasm where it eventually migrates to the enzymes involved in photosynthesis or biosynthesis of fatty- or amino acids.  The cuticle is waxy, with only a few water-loving pathways and the uptake process is basically driven by diffusion and concentration gradients. As such, it is more effective when the product is in solution and the longer the droplet can stay wet, the better.  That’s one reason why spraying during hot, dry days may reduce performance. Again, it depends on the formulation and the mode of action. Too high a concentration can damage membranes, physiologically isolating the active ingredient and reducing its subsequent translocation. It’s always a balancing act.

    If you’ve been keeping track of the score, it’s more or less a tie between large and small droplets. One deposits better and makes more efficient use of lower water volumes, while the other has lower losses from drift and evaporation, helps smaller droplets resist drift, and may improve uptake of some products.

    And this draw is why the venerable hydraulic nozzle has been so successful for so many decades. Hydraulic atomization, by its nature, creates a wide diversity of droplet sizes, ranging from 5 to 2000 µm or greater. As Dr. Ralph Brown of the University of Guelph used to say, this nozzle provides a drop for all seasons. Some small ones for coverage and retention in hard to reach places, and some large ones for uptake and drift-reduction. The result is a robust delivery system that provides reliable results on many different targets under many conditions. In recognition of the heterogeneity of sprays, we don’t refer to specific droplet sizes, but rather their composite, grouped into international categories of Spray Quality such as Medium, Coarse, and Very Coarse.

    Our challenge is to find the spray quality sweet spot, the ideal blend of these contradictory and yet complementary features of our agricultural sprays. And I believe that task is very achievable. Simply put, broadcast agricultural sprays in field crops work reliably when applied as Coarse and Very Coarse sprays in volumes between 7 and 12 US gpa. There is no need to spray any finer than Coarse for good efficacy, as coverage is already sufficient and any additional coverage has small marginal returns. There is, however, value in adding more water when canopies are denser or when leaf area index grows as the crop matures. To gain coverage, adding water is preferred to reducing droplet size because of the value of environmental protection. It so happens that Coarse to Very Coarse sprays provide or exceed the drift protection required by most agricultural labels.

    There is occasional reason for spraying even coarser than what I’ve suggested. It’s certainly required by law for dicamba products on Xtend traited soybeans and cotton, but even then, only in conjunction with higher water volumes to offset losses in droplet numbers.  In practice, moving to Extremely Coarse or Ultra Coarse sprays may allow an application to proceed in higher than average wind without adding drift risk. The use of some additional water is a relatively small price to pay for that additional capability.

    There will always be opportunities for efficacy improvement in specific cases for those willing to spend the extra time to optimize that situation. That’s one of the reasons I’m excited to see the widespread adoption of pulse width modulation (PWM) in the industry, allowing users to change spray pressure and therefore spray quality with no impact on application rate or travel speed. Or the introduction of nozzle switching from the cab, employing the optimal atomizer for a specific situation. Although it remains difficult to define the ideal spray, selecting a spray quality has never been so easy.