Category: Rates and Calibration

For basics category

  • How to Calibrate a Drone – Swath Width Calculation

    How to Calibrate a Drone – Swath Width Calculation

    Calibration is a fundamental step in any spray application. To apply the correct product rate, we need to know how much liquid per unit land area is deposited under the sprayer.

    To conduct the calculations, either manually or through the drone software, we need to know the width of the spray swath. This task requires the operation of the sprayer under typical conditions, some kind of sampler capture the spray deposit, and a means of quantifying that deposit so the spray pattern becomes apparent. Here’s how we do it:

    1. Confirm the accuracy of the flow meter

    Drones don’t typically report the spray pressure of the spray mix. Instead, they report the flow rate using a built-in flow meter. The drone maintains the desired application rate by using the flow rate to adjust pump speed and engage nozzles over a range of travel speeds. Because everything depends on the flow meter, its accuracy needs to be verified.

    • Fill the spray tank with clean water and flush all the lines.
    • Install nozzles required for task, ensuring all nozzles are identical and in good working order.
    Nozzles installed on DJI T20 drone.
    • Select the nozzle size you installed on the spray monitor.
    • Purge the air from the system.
    • Activate the spray and wait for the flow rate to stabilize on the spray monitor. This may take a few moments.
    • With the nozzles flowing, place collectors under each nozzle and collect the spray liquid for a fixed time, say one minute.
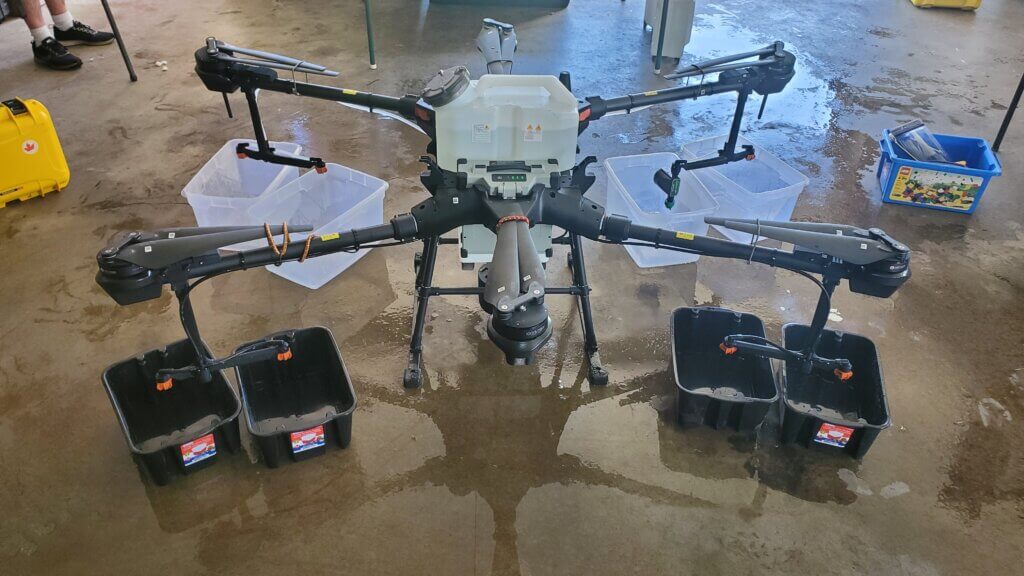
    Capturing spray during flow meter calibration.
    • Ensure the collector catches all the spray. Buckets often create turbulence. Rotary atomizers make this more difficult.
    • When the time elapses, remove the collectors and then shut off the spray.
    • Unless the shutoff is very fast and positive, leaving the collectors in place during shutoff can introduce error as the flow diminishes.
    • Confirm that the volume collected from each nozzle was identical, and that the flow rate reported by the drone flow meter is accurate.
    • Repeat to ensure consistency.
    Use of a Spot-On digital calibrating cup ensures that all spray is captured and it also reports the volume instantly.

    2. Measure the swath width

    Spray swath width is variable. For a measurement to be relevant we must evaluate spray deposition under environmental conditions that are similar to the planned spray operation, as well as use the same operational settings such as altitude, travel speed, nozzle choice, and application volume.

    Spray samplers are positioned along the ground, perpendicular to the flight path. We use water-sensitive paper (WSP) because it’s readily available, fast and easy to use, and the deposits can be analyzed visually or using simple apps that calculate coverage. We create a sampling line of WSP positioned a 1 m intervals (or maybe 0.5 m for narrow swaths). The samplers should extend to twice the expected swath width to account for any swath displacement from sidewinds.

    • Choose a day with light, consistent winds.
    • Find an open space free of obstruction in the direction of the prevailing wind.
    • Install a weather station to document conditions during flight.
    A Kestrel 3550AG or 5550AG wind meter can record weather data and download to a phone via Bluetooth.
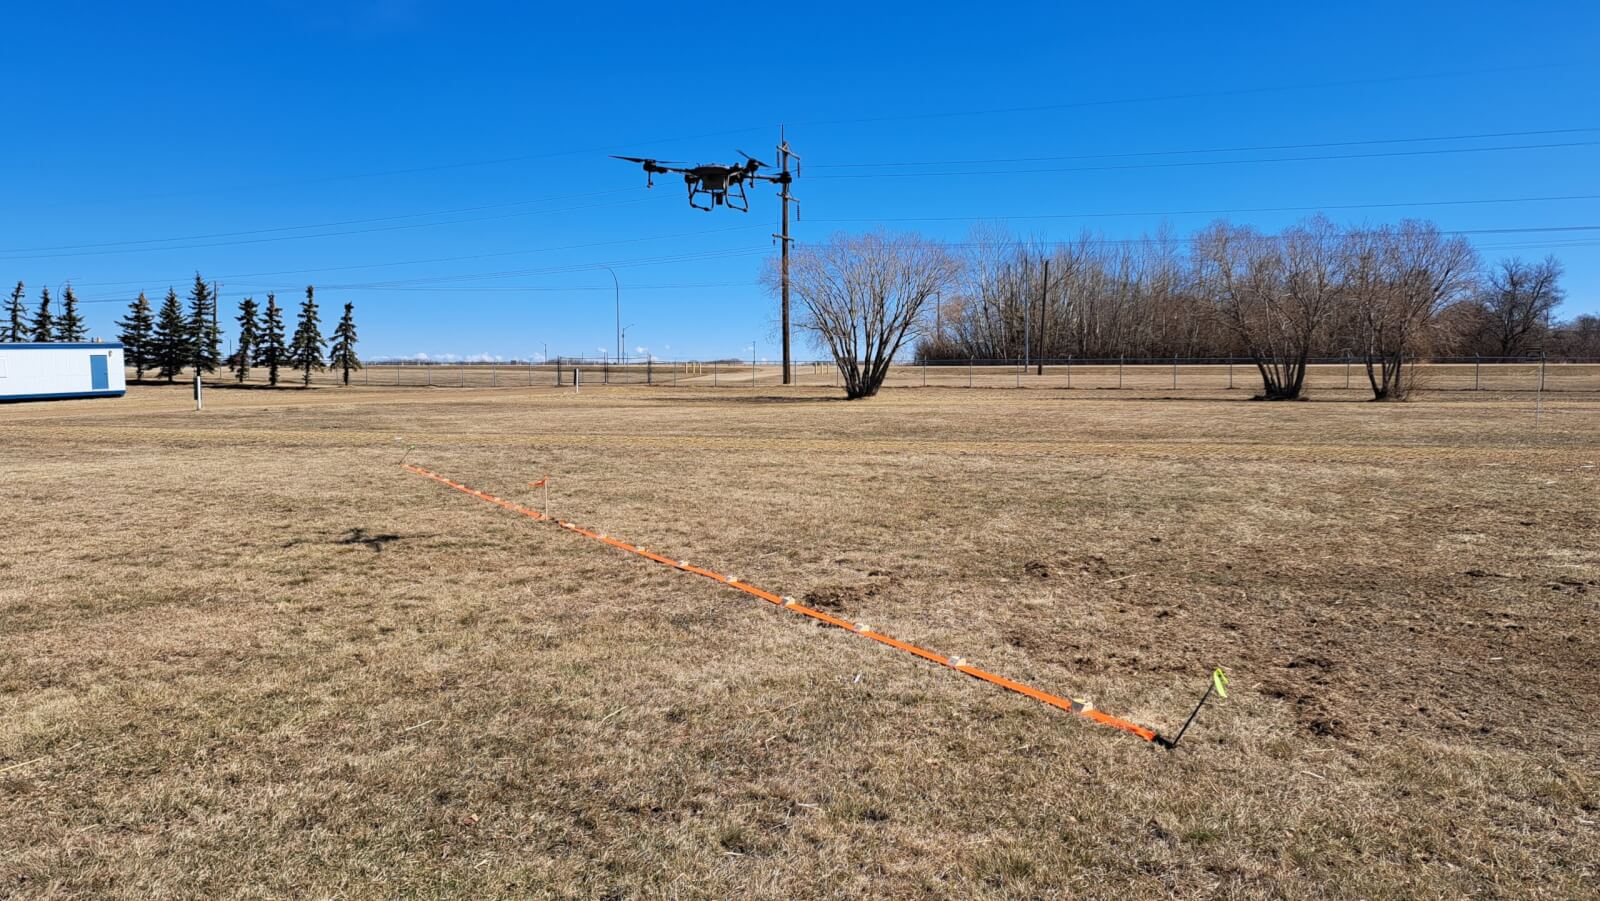
    • Mark an approximately 200 m long flight line into the prevailing wind direction by placing wire flags every 50 m.
    • At the 150 m mark, use wire flags to centre a sampler line perpendicular to the flight path. Sampler line length should be about twice the expected swath width.
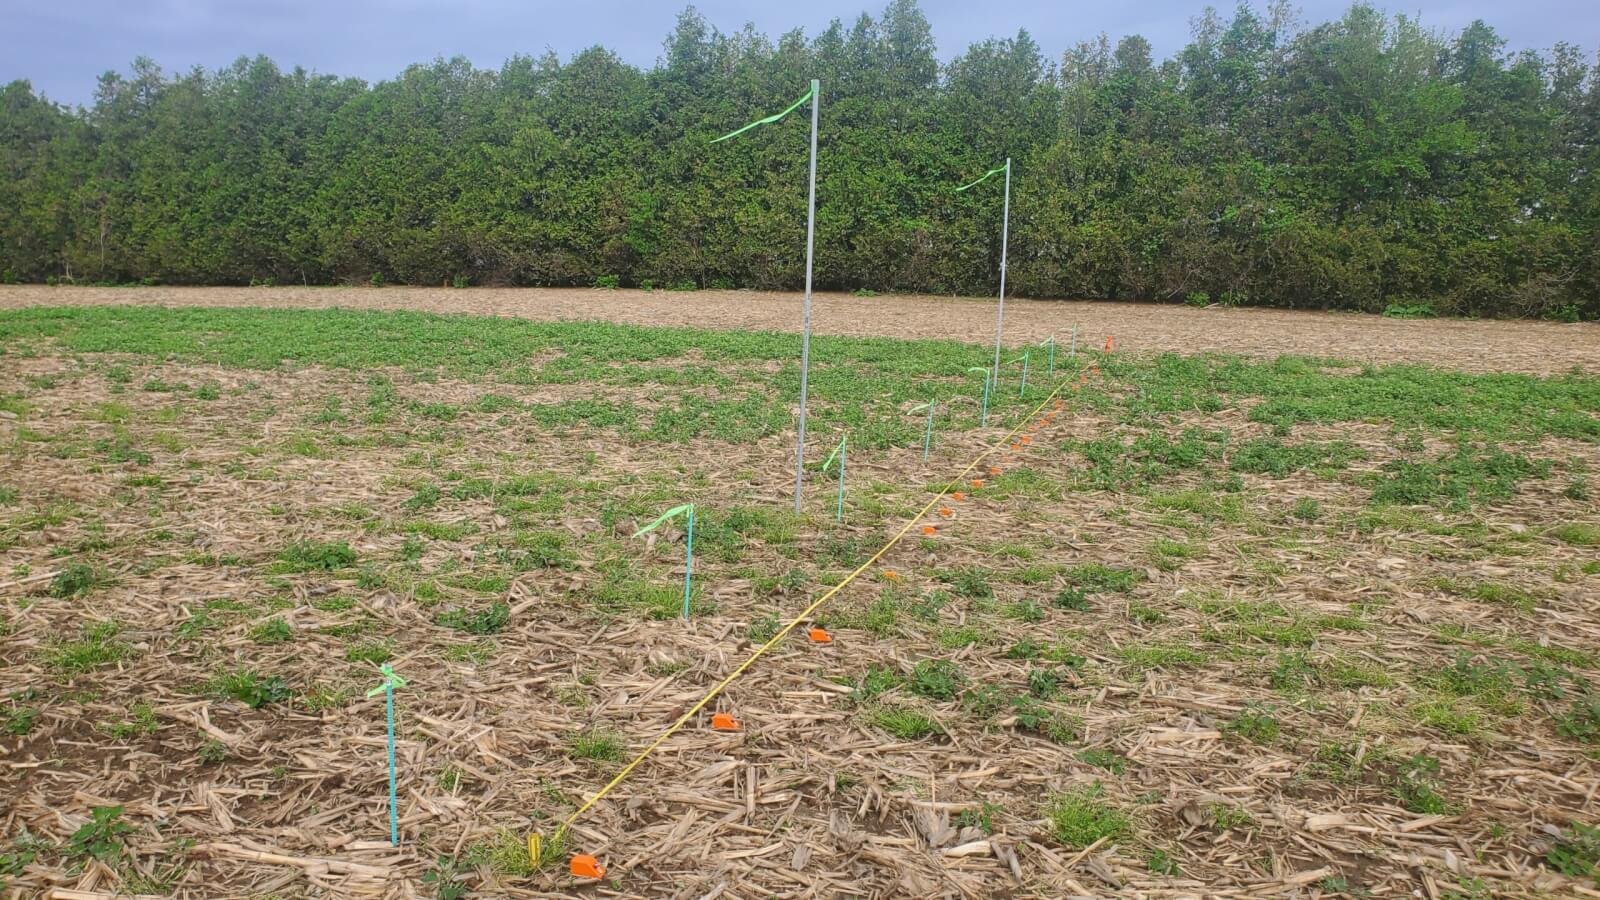
    Swath sampling line
    • Wooden blocks with paper clips can be used to secure WSP at regular intervals along the sampler line.
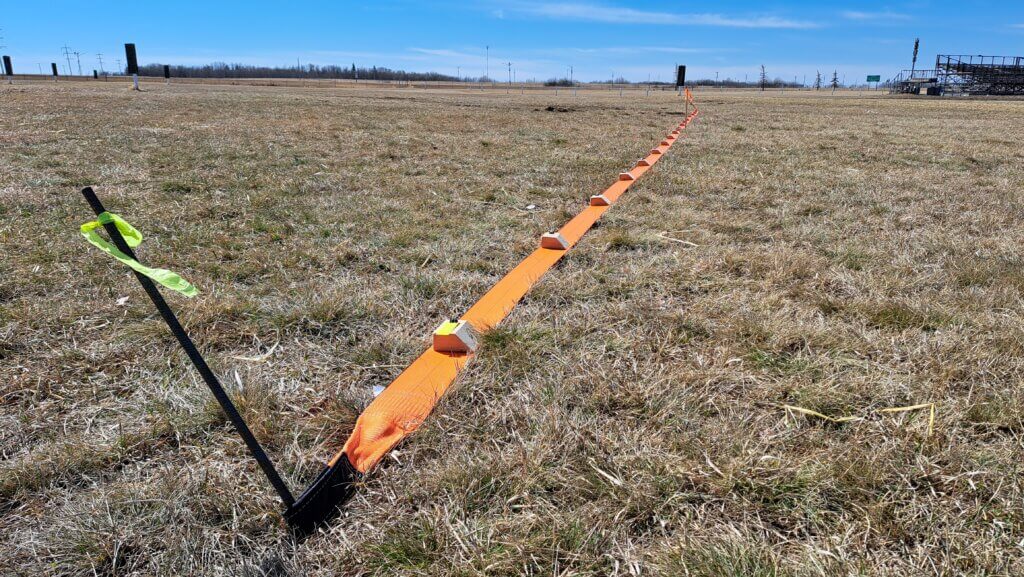
    Wooden blocks attached to a 4″ tow strap allows for easy setup and movement of sampling line.
    • Fill the drone 1/2 full.
    • Manually fly the drone along the entire flight line. The spray pressure, flow rate and altitude of the drone should be stable before it reaches the sampler line. This may take 25 meters or more depending on drone model, flight speed and drone weight.
    • Fly 50 m past the sampling line without any drone maneuvering to avoid affecting the deposit.
    • Land the drone and walk along the sampler line.
    • Note the deposits in the central region. Walk along line as the deposits taper off, looking for deposits that are approximately 50% of the average central deposits.
    Water-sensitive paper following a drone application.
    • Estimate the distance between these deposits on both edges of the swath. This is the estimated swath width that can be entered for the second flight.
    • Replace the WSP with a fresh set, refill the drone to 1/2 full, and repeat the flight two more times.

    Other methods perform a more advanced assessment by analyzing the entire swath, and not just intervals. These methods use dyes and dedicated hardware to quantify the deposits along strings or paper samplers.

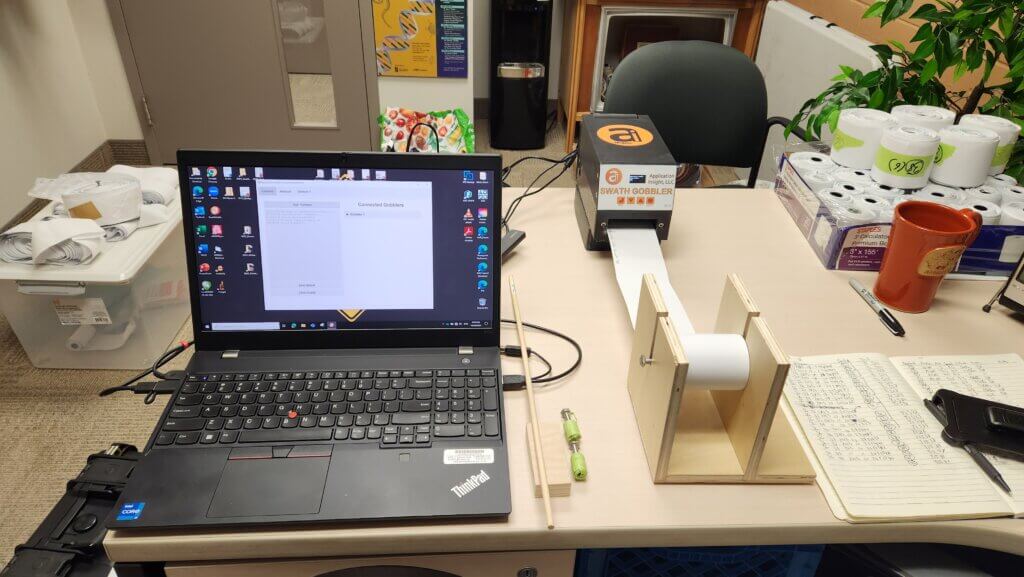
    The Swath Gobbler documents swaths at high resolution using lengths of 3″ bonded receipt paper, food grade dye, and a digital scanner.
    The Application Insight LLC Swath Gobbler scanner in action.

    3. Analyze the Pattern

    The nearest approximation for drone swathing is that of a manned aircraft. The spray pattern of an aircraft is tapered, meaning the highest deposition is near the centre of the swath, and the edges of the swath fade to zero deposit. In order to achieve consistent coverage, we need the edges of the spray swath to overlap so the cumulative coverage at the edges is closer to that in the centre. Too little overlap leaves gaps and too much overlap results in excessive deposit.

    Insufficient overlap creates gaps in coverage
    Excessive overlap results in over-dosing and waste
    Correct overlap is necessary for efficient and effective application.

    Deposits from drones can be highly variable. The challenge is to find an overlap distance that minimizes this variability, minimizes both over- and under-application, and maximizes swath width. Download a copy of an app we’ve developed to help you with this process.

    The first step is to estimate a reasonable average deposit, called “Threshold”. The app graphs the deposits from each sampler, and the user estimates a point on the Y axis (Relative Deposition) that represents the average maximum deposit. This could be the maximum value of the plateau, or a midpoint between the maximum and a nearby dip. The app assumes a value that is 90% of the maximum, to start.

    We then take 50% of this estimated average deposit, and find the two distances on the X axis (Sampler Locations) that intersect the curve at these points. The distance between these two points is our first estimate of the swath width. If two adjacent swaths are spaced so the edge of one overlaps 50% with the next, the overall cumulative deposit should be relatively even.
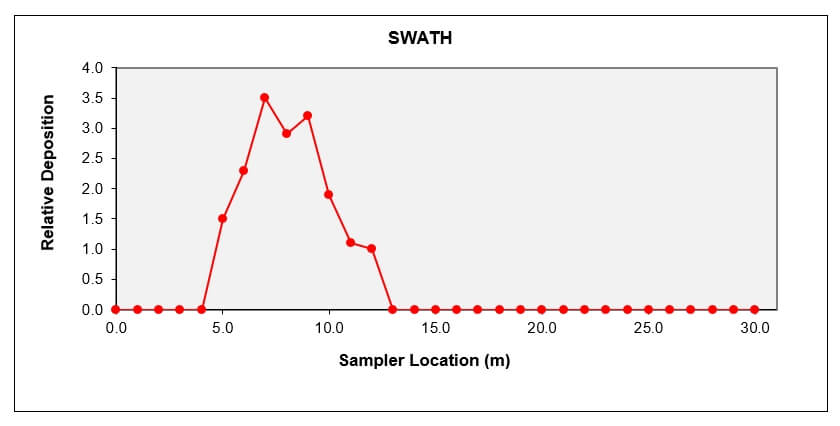
    The coverage information from each sampler location is graphed to create a deposit pattern.

    We can alter the amount of overlap to improve the apparent uniformity, but be cautious. For example, even though we can often improve the uniformity by narrowing the swath width, this can add deposit to the area under the drone and raise the overall deposit amount. That would be waste. Plus, the narrower swath also lowers the productivity of the drone. Use the app to establish a swath width that has the lowest variability (Coefficient of Variability or CV) AND results in a balance between over- and under-dosing. The app has an “Optimize” button that can do this for you.

    It’s possible to select a racetrack or a back and forth pattern. We’ve been using the racetrack pattern even though in real life the drone will frly back and forth, for the following reason: We expect a field to be sprayed in a sidewind. The tail of the deposit will always be on the same side of the pattern even with a back and forth flight path. In essence, the wwind creates a racetrack pattern for us.

    The amount of overlap is adjusted to minimize variability (CV) and both equalize and minimize over- and under-dosing.

    The app allows you to import your data using an Excel file. If the file has multiple data column, the user can select the column to be analyzed. From that point, other columns can be selected as the analysis proceeds. Each analysis can be saved and exported as a pdf file.

    4. Recognize the factors that influence swath width

    Operational use case affects swath width

    Swath width is affected by altitude, speed, water volume and spray quality. Generally, higher altitudes, lower volumes, and finer sprays will result in a wider swath. Unfortunately, the same configuration also results in greater drift. It is recommended that swath widths be determined for each spray volume and nozzle arrangement that will be used.

    Drones will be applying low water volumes and this requires a critical assessment of coverage to ensure the deposit density is sufficient to achieve the desired result. A low volume will require a finer spray for minimum coverage to be realized. Coarser sprays that reduce drift and evaporation will need higher water volumes and result in narrower swaths. Significant time may need to be invested to understand the effects of operational settings and environmental conditions on spray deposit uniformity and swath width.

    Effective Swath Width and the Agronomic Use Case

    The relatively sparse coverage at the extremes of the measured swath width may be insufficient to elicit the desired biological result. The Effective Swath Width (ESW) represents the segment of the total swath width that results in pesticide efficacy. In some use cases, the two widths can be similar, but typically the ESW is only a fraction.

    The difference is influenced by the “Agronomic Use Case” which includes factors such as:

    • Spray mix rheology (i.e. the interaction of spray mix viscosity and atomizer design on droplet size)
    • Minimum effective dose: This is a complex relationship between coverage, spray mix concentration and pesticide mode-of-action that results in an effective result while minimizing the environmental impact.
    • Target location (e.g. a pest within a dense canopy or a weed on relatively bare ground)

    Taken collectively, research has shown a 20-30% reduction in ESW for corn, wheat and soybean fungicide applications compared to swaths measured on open ground. Conversely, herbicides sprayed on bare earth or sparse vegetation can produce an efficacious response 20% wider than the measured swath width. The impact of agronomic use case on ESW must be considered during mission planning.

    Additional pointers

    Here are a few tips and tricks to help you be successful when calibrating your drone.

    • Drone patterns will have deposit peaks and valleys in the central region. Repeated runs are needed to confirm that these are real and persistent. If so, then adjustments in flying height, spray quality, or water volume may be needed to eliminate them.
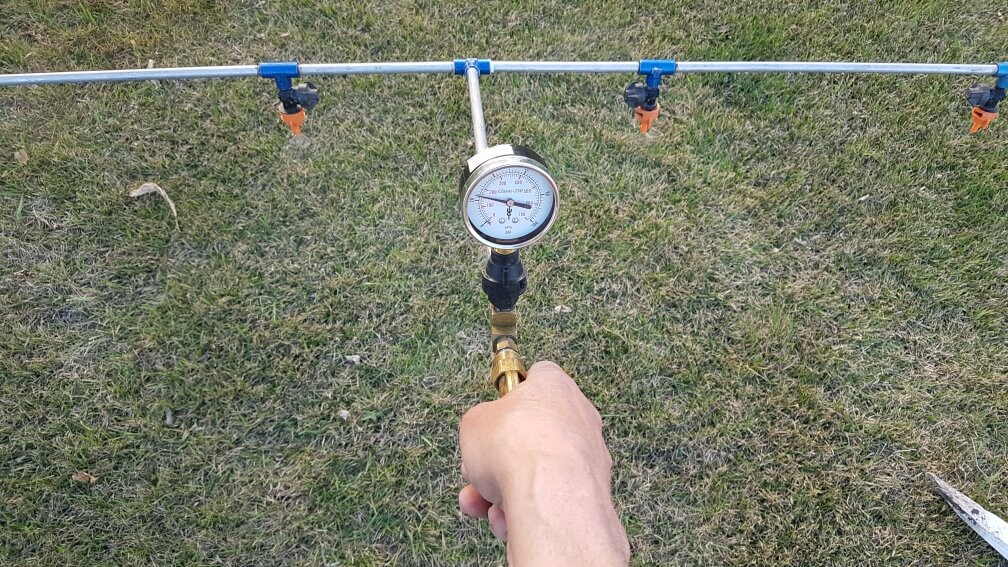
    • The absence of pressure gauges on drones can be corrected by installing an analog gauge in-line with one of the spray nozzles. If may be necessary to mount an auxiliary camera on the drone to record this gauge. We have observed strong fluctuations in spray pressure, particularly on starting a spray swath, that were not reflected in the reported flow rate.
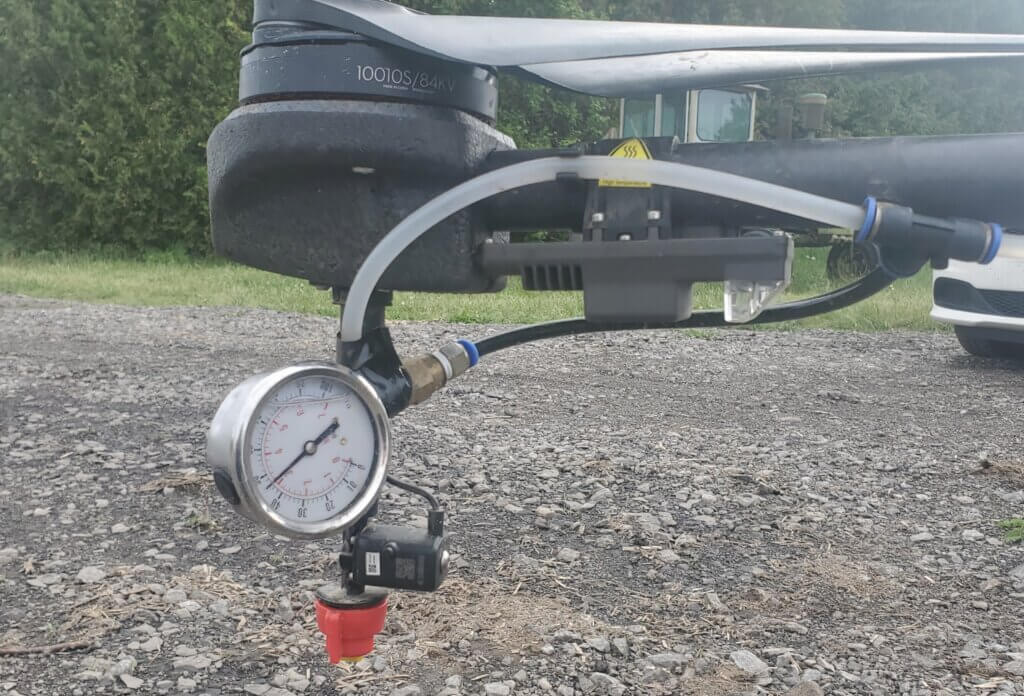
    A pressure gauge can be plumbed into a drone without affecting flight behaviour. A camera is trained on it to read pressure during a flight.
    • Many drones have the option of recording the flight screen during a mission. This will provide a record of the performance of the drone, and can be valuable should performance problems arise.
    • Although swath width calibration is done by flying into a headwind, the actual spray application should be done with a side wind. Start at the downwind edge of the field and turn into the wind. The drone is symmetrical and the tapered spray patterns should equalize the deposits. Alternately, flying into a headwind and returning with a tailwind can alter the aerodynamics of the spray deposition process, alternating between a wider and more narrow swath width, respectively.

    Drone spraying will walk a razor’s edge of sorts – there is little room for error when using scant water and fine droplets. Getting the basics right has never been more important.

  • Airblast Nozzles – Distributing Flow

    Airblast Nozzles – Distributing Flow

    There’s a certain deer-in-headlights expression that creeps onto a sprayer operator’s face when we discuss nozzle selection. We sympathize with our field sprayer clients given the variety of brands, styles, flow rates and spray qualities they must choose from. And PWM has made the process even more complex. However, airblast operators face an additional challenge; Unlike horizontal booms, vertical booms often distribute the flow unevenly to reflect relative differences in the distance-to-target and the density of the corresponding portion of target canopy. We discuss the broader, iterative process of nozzling an airblast boom here, but in this article we focus on the topic of flow distribution.

    An overwhelmed operator trying to nozzle a boom.

    The question of “which rate goes where” is still debated. It’s led to diagnostic devices called Vertical Patternators which show the profile of the spray. Operators can use these to visualize their distribution… but they are few and far between. For the rest of us, deciding on the best distribution begins with understanding how the practice evolved.

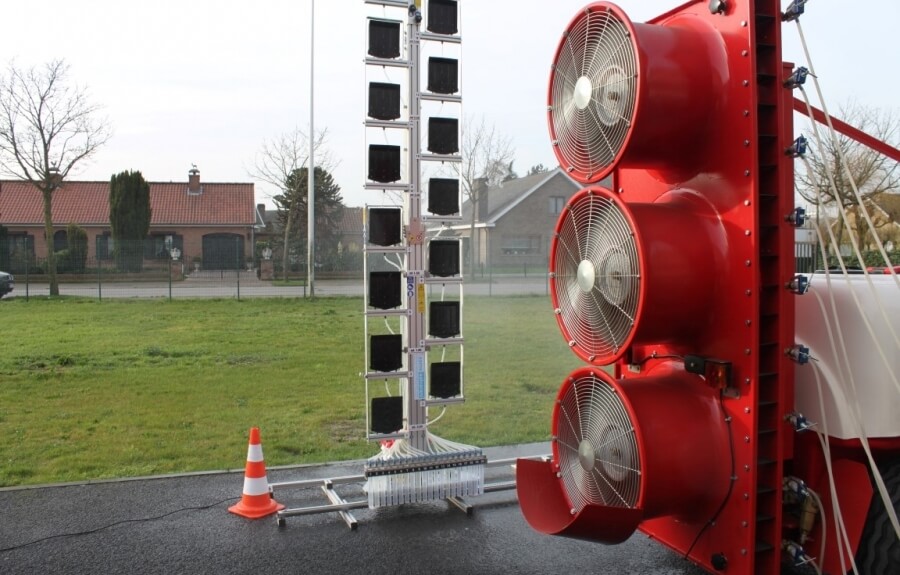
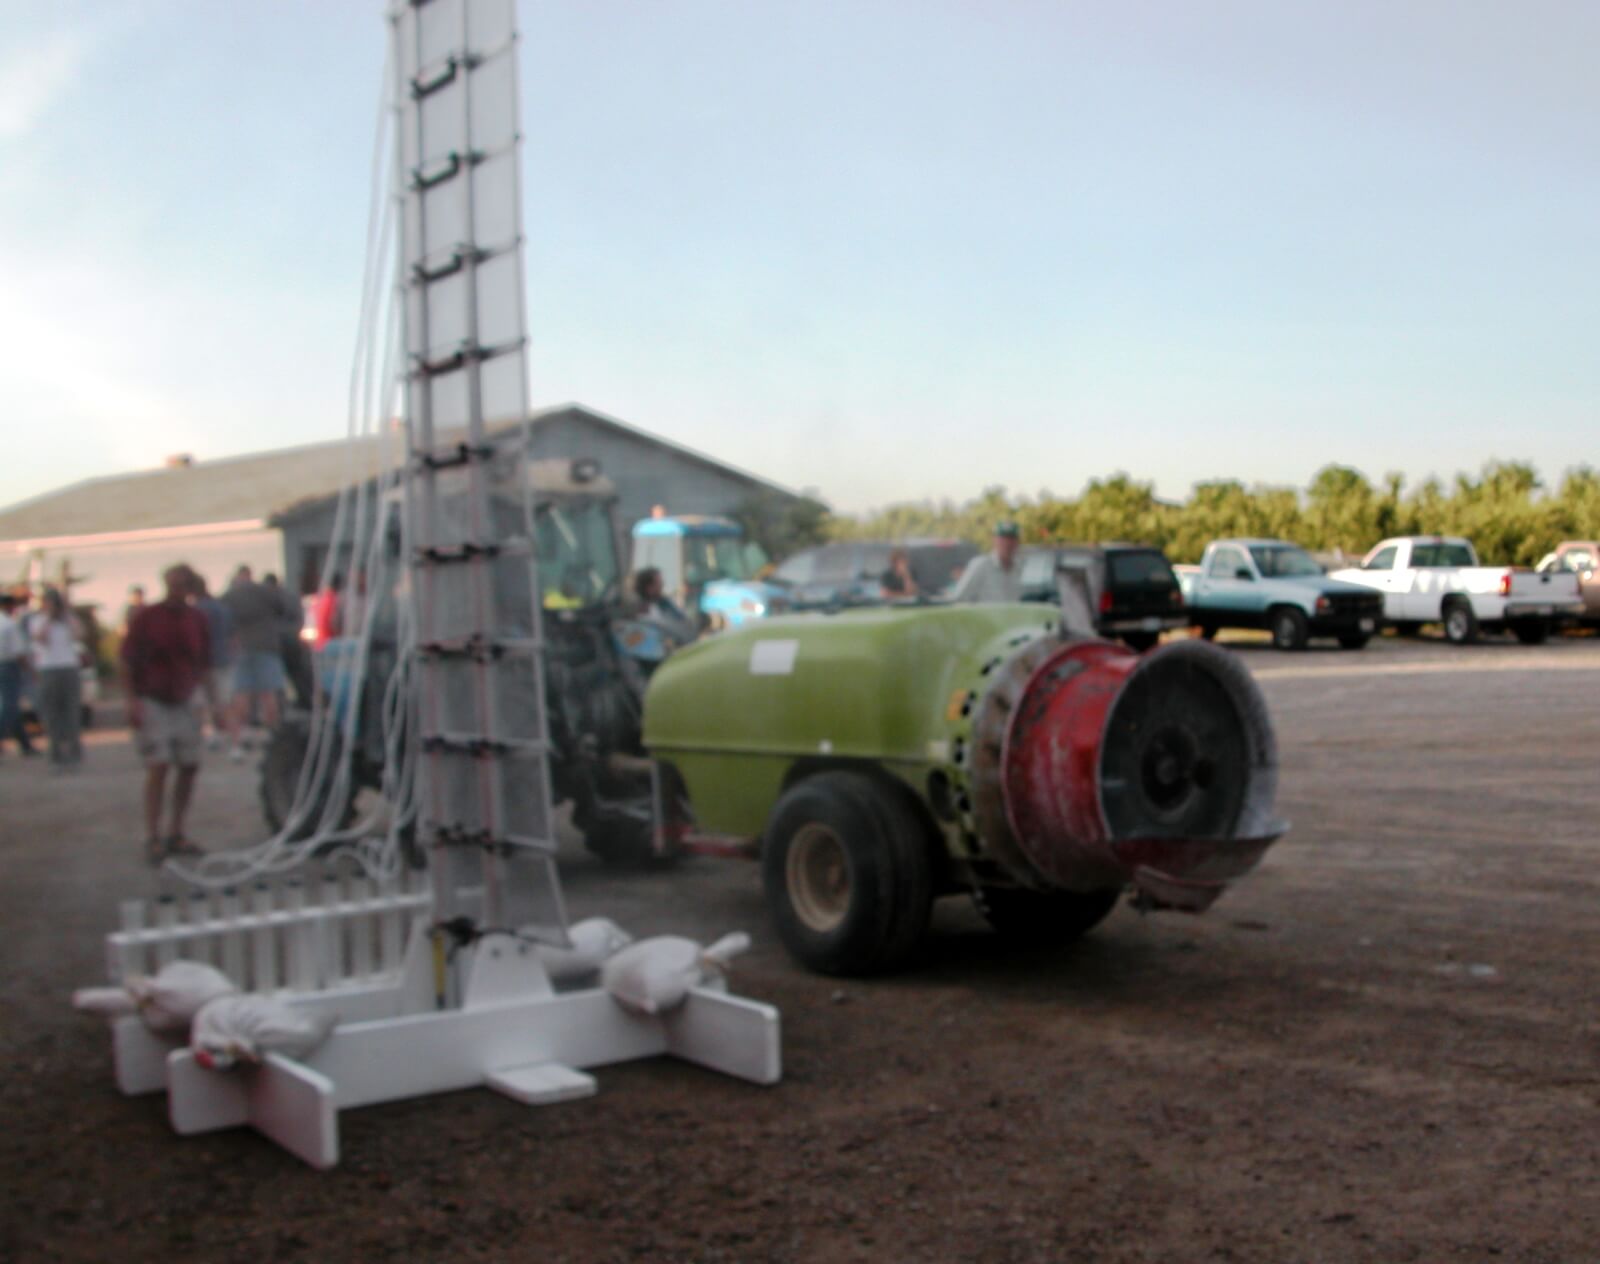
    The AAMS vertical patternator. The mast moves back and forth across the swath of a parked sprayer. Each black collector intercepts the spray at different heights. The fractions collect in the tubes at the bottom to show relative volume.
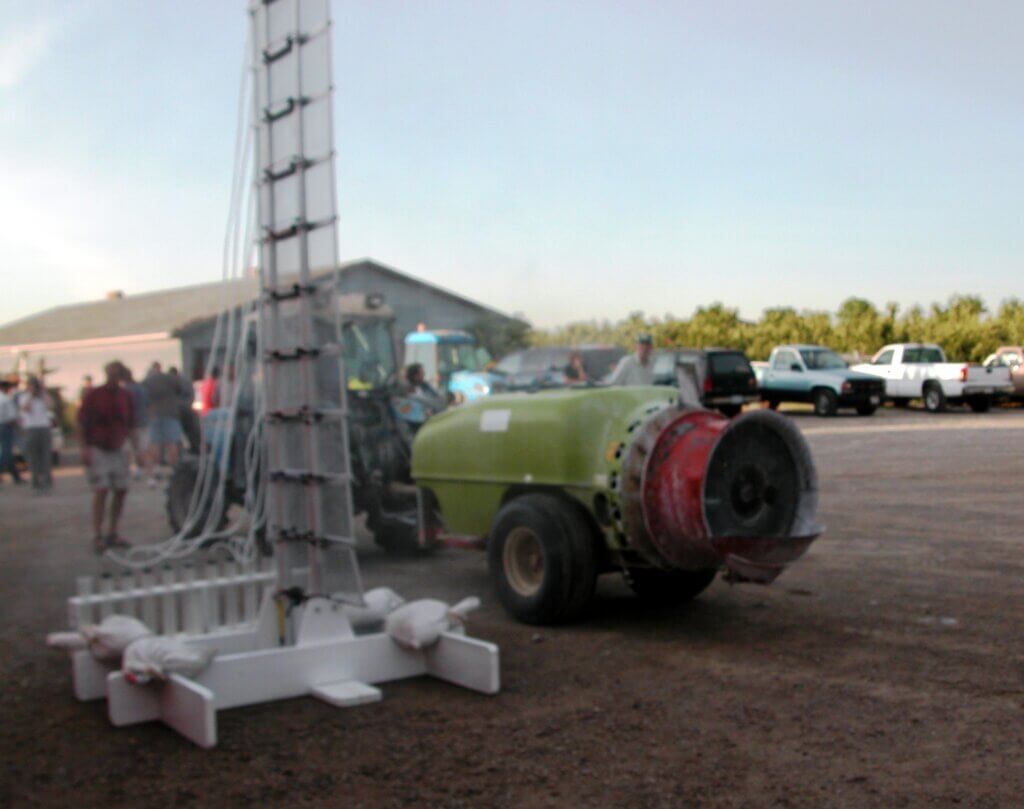
    A blurry shot of an OMAFA-built vertical patternator. The sprayer parks in front of the screens, which intercept spray. It’s collected in troughs and runs into columns that show relative volume.

    1950s

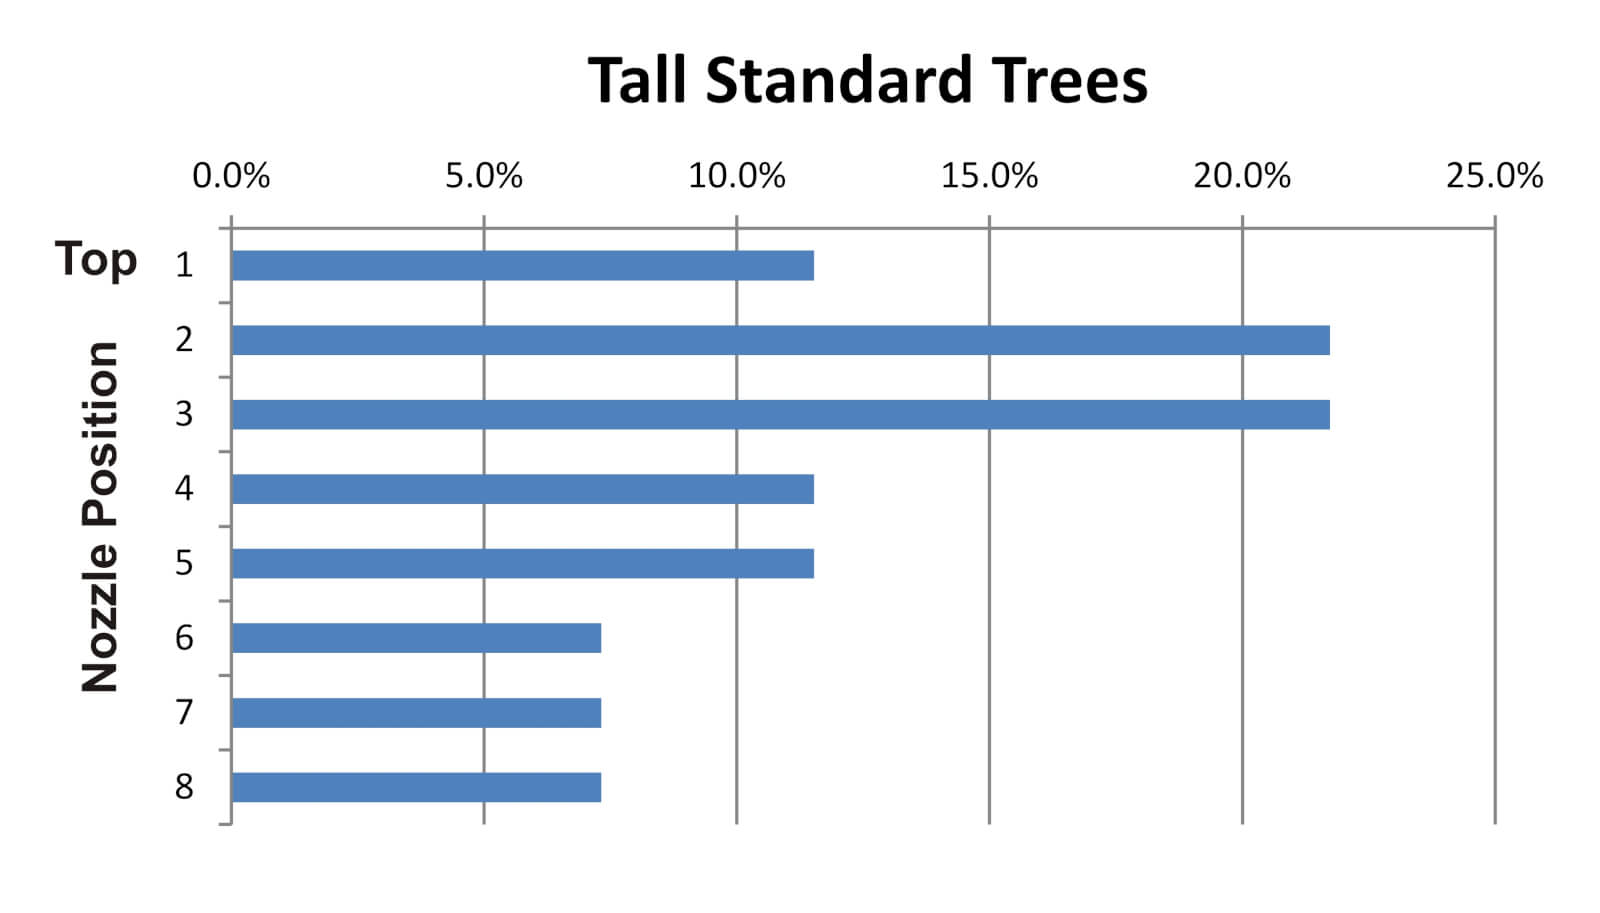
    In the 1950s, the mantra was to blow as much as you could, as hard as you could, and hope something stuck. At the time, John Bean promoted a method called “The 70% Rule” whereby operators used full-cone, high volume disc-core nozzles to emit the vast majority of the spray from the top boom positions. John Bean provided a slide-rule calculator to help operators configure booms to align the top nozzles with the deepest, densest portion of the 20-25 foot standard trees they were trying to protect. Back then, most airblast sprayers were engine-driven low-profile radial monsters capable of blowing to the tops of those trees. The practice persisted into the 60s and was encouraged by Cornell University (Brann, J.L. Jr. 1965. Factors affecting the thoroughness of spray application. N.Y. State. Arg. Exp. Sta. J. paper no. 1429).

    The profile of the spray would have looked something like the following graph:

    1970s

    In the 70s, extension specialists began advising operators to tailor the distribution to match the orchard spacing, tree architecture, canopy density and weather conditions. we reached deep into our archives for the Ontario Ministry of Agriculture and Food’s 1976 publication entitled “Orchard Sprayers” to see what we used to tell airblast operators.

    The 1976 update of Ontario’s 1971 “Orchard Sprayers” guide. A trove of hard-earned knowledge that still has relevance today. I love that the Minister’s name, and not the author’s, is on the cover. Let’s set the record straight: R. W. Fisher, D. R. Menzies and A. Hikichi, based in Vineland and Simcoe, Ontario.

    Here’s a synopsis of what was advised:

    1. Choose a tree size and shape that is typical of your orchard and park the sprayer at the normal spraying distance from it.
    2. Find one or two middle nozzle position(s) and air deflector or vane settings that direct the spray up through the top-inside of the tree. This is called the “middle volume zone”.
    3. Find rates that will give a large output in this middle volume zone, and smaller outputs for positions above and below.
    4. The total output must still add up to the target volume.

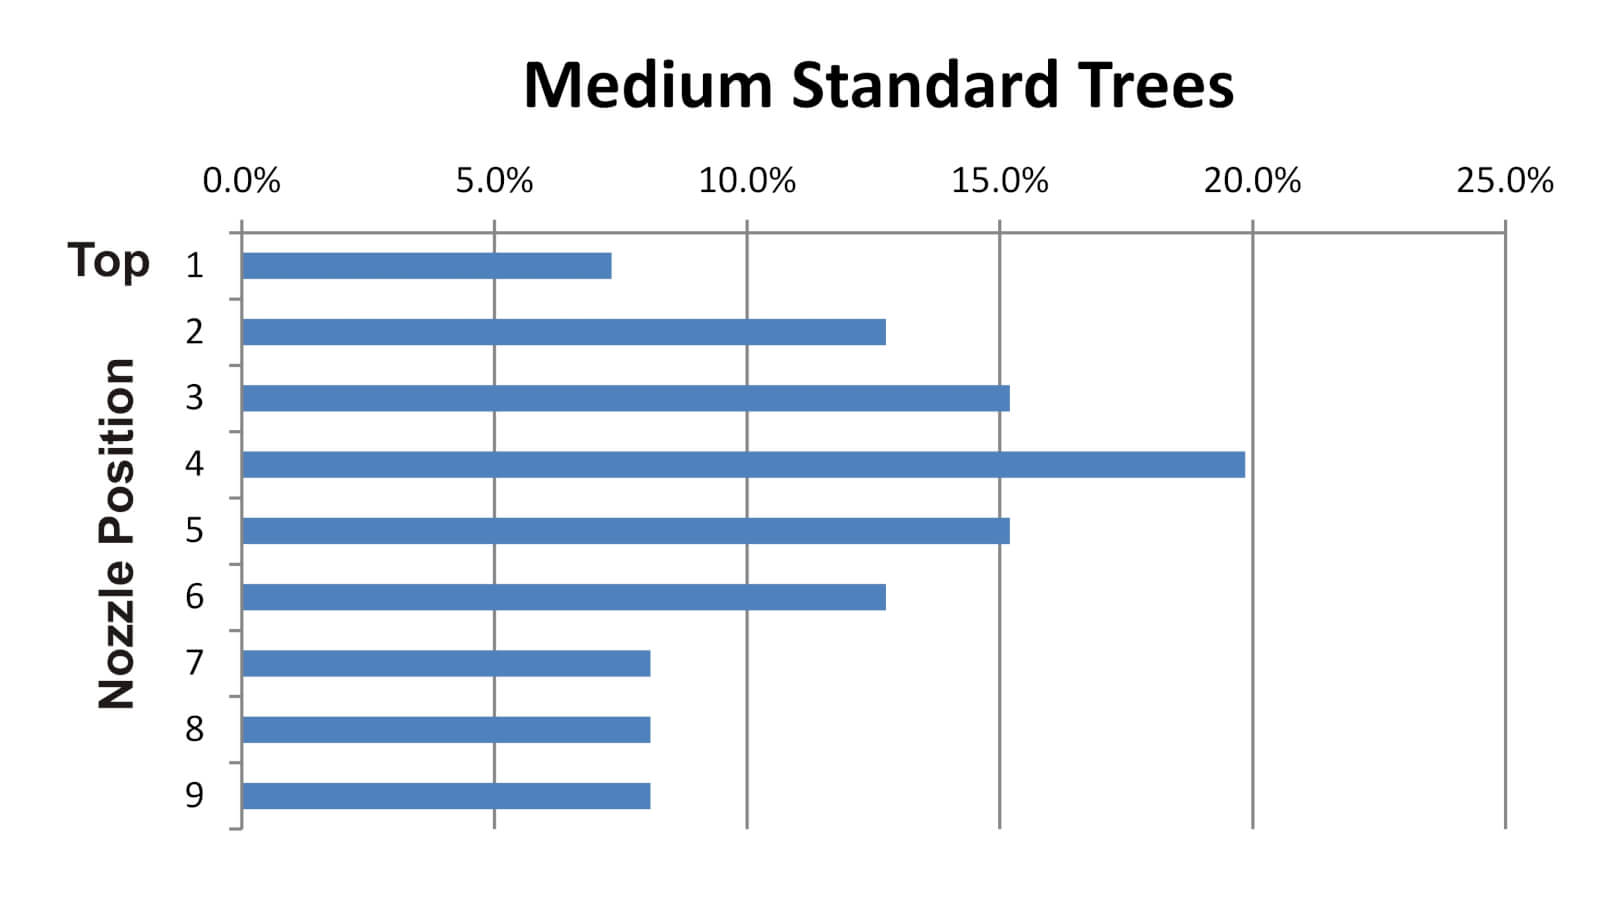
    It seemed operators were getting away from high rates in the top positions and instead shifting the distribution to match the canopy shape and density. If we were to follow these recommendations, the spray profile would look something like this:

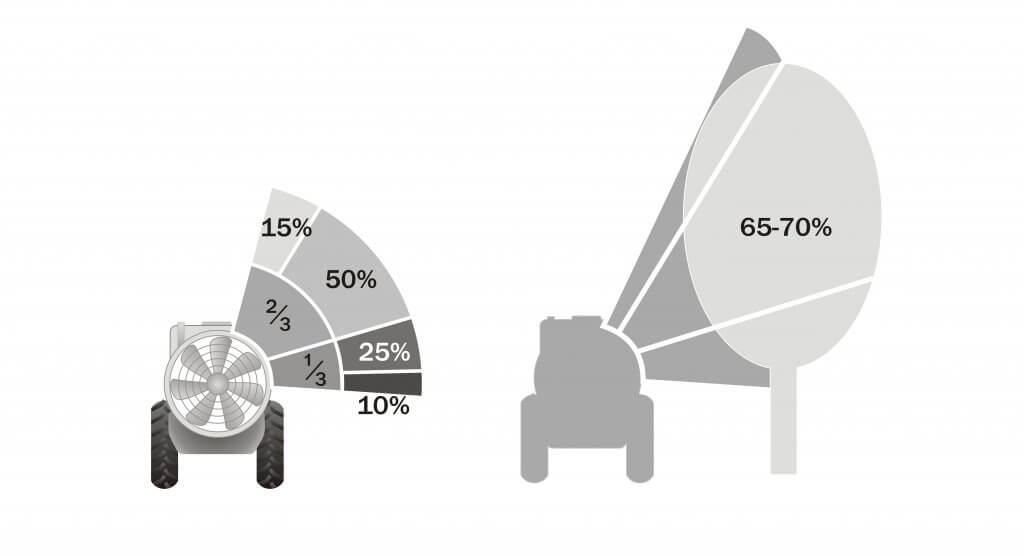
    Later, Agriculture Canada’s 1977 publication entitled “Air-Blast Orchard Sprayers – A Operation and Maintenance Manual” had similar advice. Here we find the “2/3 boom rule” as the authors state: “To ensure good distribution through the trees, about two-thirds of the spray should be emitted from the upper half of the manifold.”

    1980s

    Operators followed this approach well into the 80s, as they endeavored to aim the majority of the spray into the densest part of the canopy. Many can relate to the following illustration that divides the boom, which I modified from an array of period factsheets. The fractions represent the portion of the available boom. The percentages indicate the relative volume. Of course, it matters how large and how far away the target is for either the 2/3-boom or 70% rule to make sense (the middle volume zone is shown receiving 65-70% in the silhouette).

    1990s-2000s

    The 2/3 or 70% rules still work for standard nut and citrus trees, and perhaps for large cherry trees, but pome and tender fruit orchard architecture is densifying at this point in time. In the 90s and 00s we started transitioning from semi-dwarf into trellised, high density orchards.

    Leaping to 2005, Ohio’s Dr. Heping Zhu et al., found that a high density orchard is effectively sprayed by the same rate in each nozzle position. They wrote: “[Historical] recommendations are to use a larger nozzle at the top of each side, with the capacity of the top nozzle at least three times greater than other individual nozzles. However, results in this study with three different spray techniques showed that spray deposit was uniform across the tree canopy from top to bottom with the equal capacity nozzles on the air blast sprayer.”

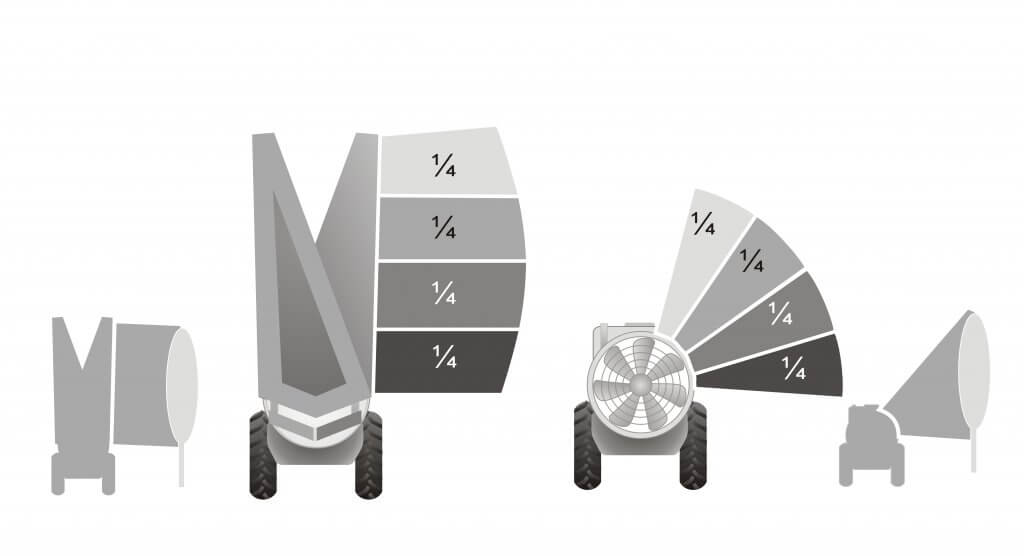
    What a pleasant surprise to simplify our lives! If we can use an even distribution for dense, nearby trees, it follows that any vertical crop with the same width and density located close to the sprayer (e.g. cane fruit, trellised vines, etc.) would benefit from even distribution:

    Today (2020s)

    So, how do we do it today? There is still no simple answer; Conditions change, not all sprayers are the same, and not all applications have the same target. Let’s build on what history has taught us and establish a process to achieve better coverage uniformity and reduce waste.

    No matter the crop, the operator must first adjust air settings. Air volume and direction play the most critical role in transporting a droplet to (and into) a target canopy. Too high an air speed will cause spray to blow through the target, rather than allowing it to deposit within. Aim the air just over, and just under, the average canopy. Ensure there’s enough air to overcome ambient wind and to push the spray just past the middle of the target canopy.

    It should be noted that we assume the operator is spraying every row. With certain exceptions, alternate row middle spraying is not generally recommended. Not only can it compromise coverage on the far side of the target, it makes it far harder to match the nozzling on a single-row sprayer and is a sure-fire way to increase drift.

    Next, determine which nozzles are not needed (e.g. spraying the ground or excessively higher than the top of the canopy). Remember: hollow cones overlap very close to the boom and spread as much as 80°. Airblast sprayers rarely if ever need the lowest positions and unless spraying overhead trellises they may not need the highest either. Turning off the highest, and most drift-prone, nozzle positions in high density orchards is illustrated in the logo I was asked to create for Washington’s short-lived Pound the Plume awareness campaign in 2017.

    Then, finally, we decide on distribution. If the crop is nearby and relatively narrow, you can try even distribution. If you elect to distribute the spray unevenly to better match the variable-width target, or compensate for distance, aim half the overall output at the densest part of the canopy (the middle volume zone). Consider how the following factors might influence your choices:

    1. High humidity means more spray will reach the target, and vice versa. This is because all droplets are prone to evaporation. We have heard it said in hot, dry conditions (described by Delta T), a droplet can lose ½ its diameter every 10 feet. As they evaporate they get lighter, meaning they are less subject to their original vector and the pull of gravity, and more subject to deflection by wind. The use or coarser droplets, and/or humectants, can help, but higher volumes can help too – they increase the odds of some droplets hitting the target and actually humidify the air to slow evaporation.
    2. Windspeed increases with elevation, so spray is most likely to deflect at the top of canopies where they have already lost size (and momentum and direction). Early in the season when there is little if any foliage, wind speeds are higher overall. This is why we advise adjusting air settings using a ribbon test before considering boom distribution – you need enough air volume, aimed correctly, to get the spray to the top.
    3. The denser and deeper a canopy, the more spray is filtered and unavailable for coverage. This is why you will always achieve more coverage on the adjacent, outer portion of a canopy versus the interior. In semi dwarf apple orchards we have seen the coverage drop by half for every meter of canopy. Finer spray can penetrate more deeply because there are more droplets and they move erratically, whereas coarser droplets move in straight lines and impact on the first thing they encounter. Higher volumes will improve penetration and overall coverage, but there is a diminishing return and runoff will occur more quickly leading to more waste.
    4. Further to the last point, remember that it’s the air that propels the spray, not the pressure. Higher liquid pressure can propel coarser droplets further, but has little effect on finer droplets. imagine throwing a golf ball and a ping pong ball into a light headwind and envision how they fly. Plus, the higher the pressure, the finer the mean droplet diameter.

    Confirm Your Work

    To know how all these factors play out, you must use water sensitive paper (or some other form of coverage indicator) to diagnose the results. Remember, the goal is uniform coverage and for most foliar products, we want to achieve a minimum coverage threshold of 10-15% and a droplet density of 85 deposits per cm2 on at least 80% of the targets.

    Taking the time to match your output to the target has the potential to greatly improve coverage and reduce waste. Nozzle body flips and quick-change nozzle caps make the process of switching nozzles between blocks fast and easy. It’s worth it.

    Grateful thanks to Mark Ledebuhr, Gail Amos and Heping Zhu who edited, corrected and contributed to this article.

  • How to Properly Set Up a Crop Sprayer

    How to Properly Set Up a Crop Sprayer

    Article reprinted with kind permission from an original article written by Oliver Hill in the February, 2017 edition of Farmers Weekly. Photos ©Kathy Horniblow.

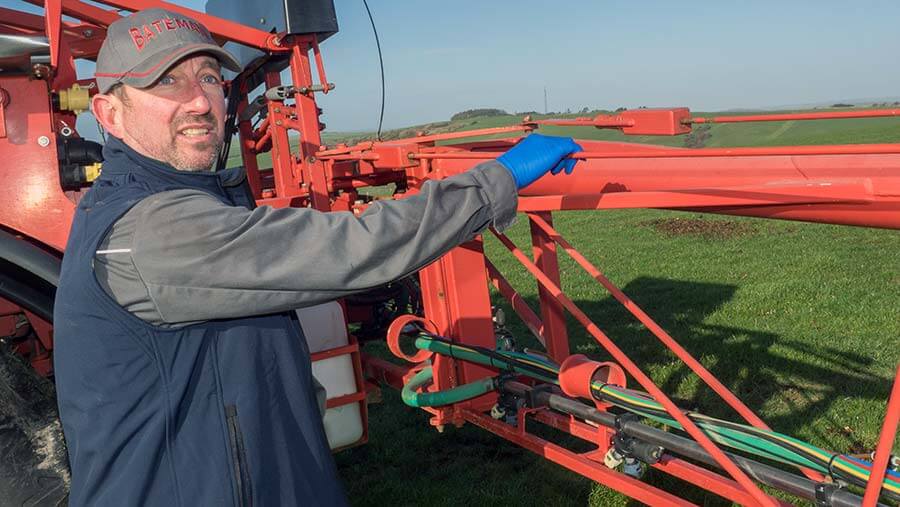
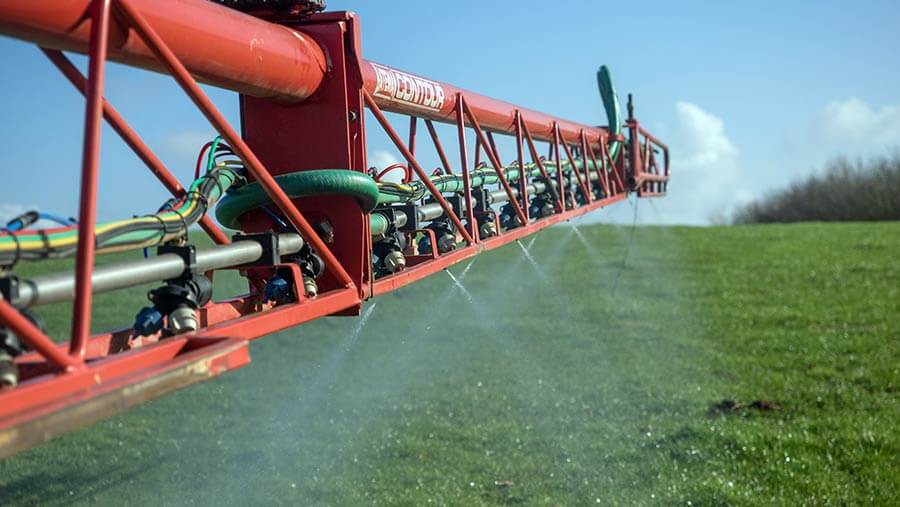
    Crop spraying is one of the most important and highly skilled jobs undertaken on any arable farm, but it is facing increased public scrutiny. This is why it is vital that the kit you use as a means to apply pesticide to crops is in prime working order and is set up correctly to deliver the product safely and accurately to its target. Optimum sprayer set up will help to maximize the efficacy of applied products, reduce spray drift and keep machinery in good condition.

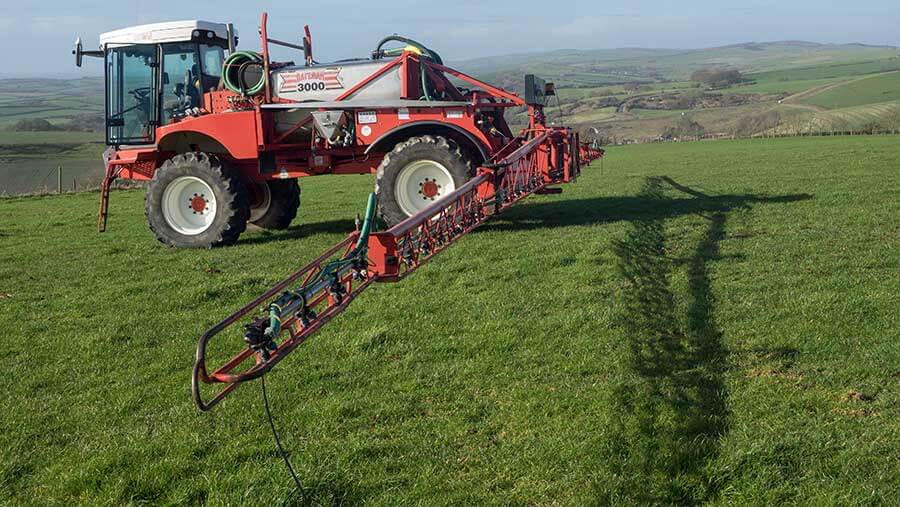
    For this best practice guide to sprayer set up, Farmers Weekly teamed up with former Farm Sprayer Operator of the Year Iain Robertson. Mr. Robertson is assistant arable farm manager at David Foot Ltd, a 2,200ha mixed farm south of Dorchester in Dorset, growing wheat, barley, beans, oilseed rape and maize as forage for the farm’s three dairy herds. The machine used for this guide is a Bateman RB26 self-propelled sprayer and while most of these checks and tests are universally applicable to all sprayers, it is also important to refer to the handbook of the manufacturer of your specific machine.

    Watch the video tutorial with Mr. Robertson and then see the step-by-step guide below for more detail.

    Pre Start Checks

    Before firing up the engine, the first thing to do is your pre-start checks – that means checking your machine’s vital fluids like fuel, hydraulic oil, hydrostatic oil, engine oil and coolant levels. If yours is a self-propelled sprayer, chances are you’ll need to get up on to the back of the machine to check some of these.

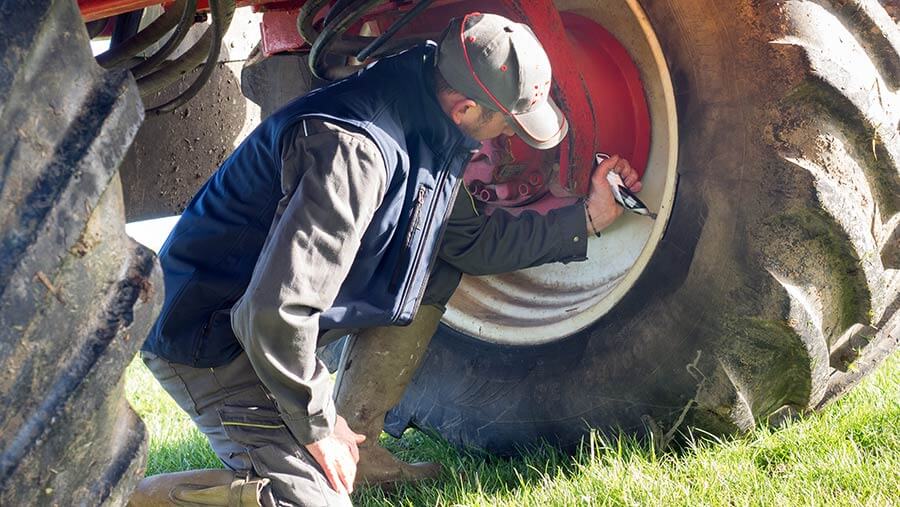
    “While I’m up on the back of the sprayer I also have a quick look in the top of the tank to make sure that it is nice and clean and the tank rinse nozzles have worked properly – cleanliness is next to godliness,” says Mr. Robertson. Next, move on to the tires. Use a pressure gauge to check all tires are at the correct pressure and refer to the manufacturer’s guidelines. If you’ve got a trailed sprayer, don’t forget to check the tractor tire pressures as well.

    Aim for tires to be run at the lowest pressure recommended for the load to be carried. This will help with boom height and stability and also helps tires act like a shock absorber to ride out bumps. If using a trailed sprayer, use a spirit level to ensure that the drawbar is level. Mr. Robertson says he tries to work around the machine in a methodical, clockwise manner to ensure that he doesn’t miss anything.

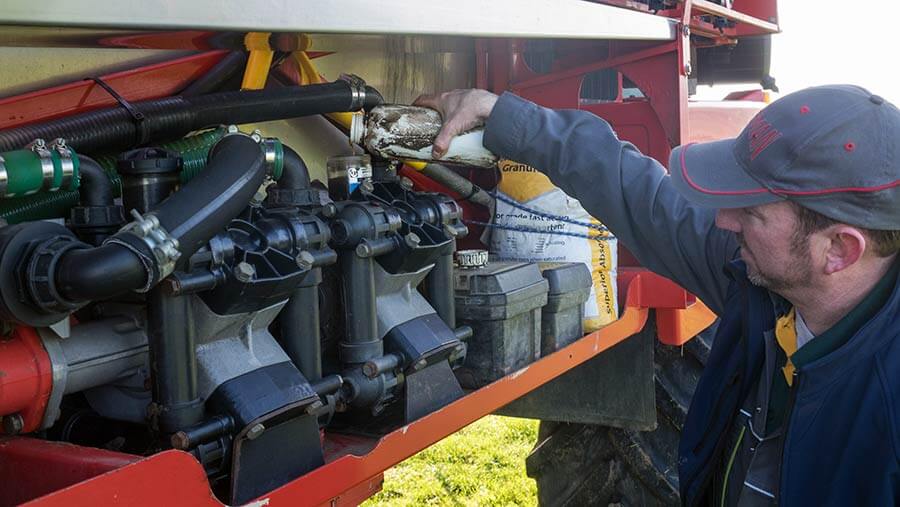
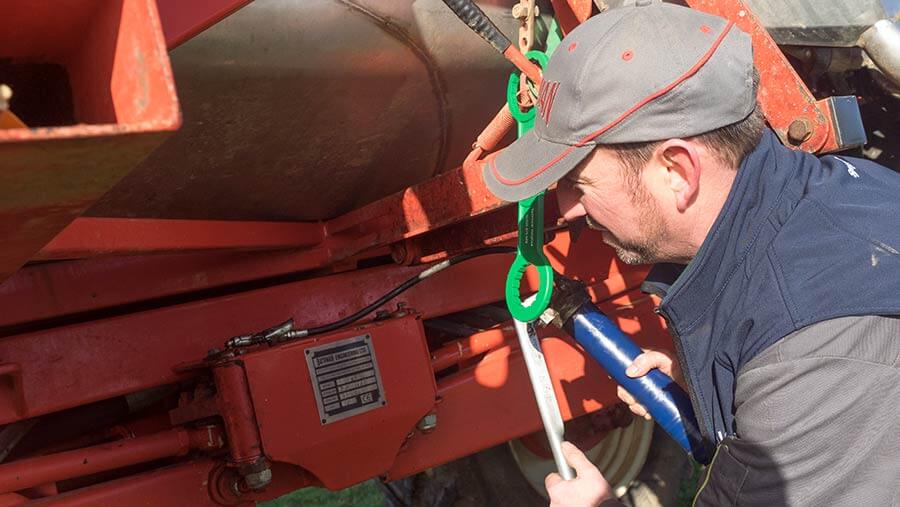
    Coming to the pumps, check that they have got enough oil, check that any tool boxes have enough spare parts and any equipment needed and make sure you are carrying a spill kit with absorbent granules and a spade in case the worst happens and there is a spillage. Make sure all parts are lubricated daily and that any grease nipples are cleaned before and after use to avoid them collecting dirt and blocking.

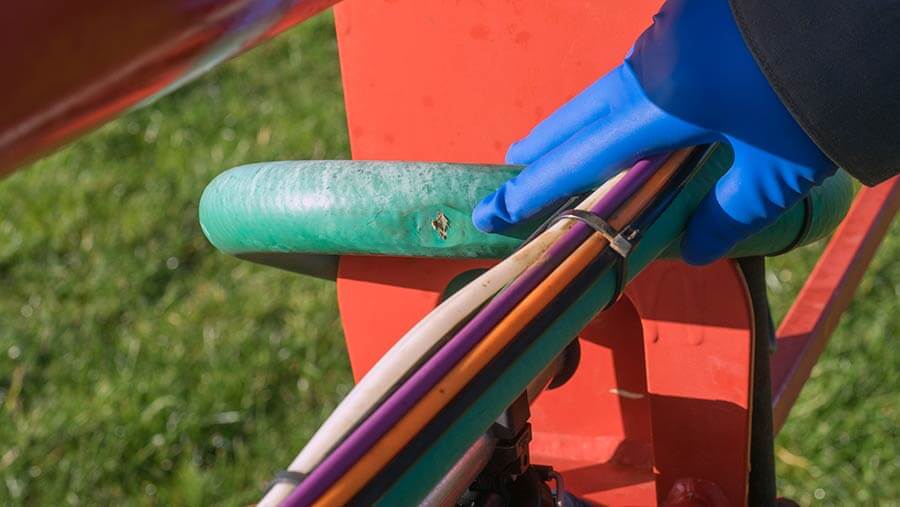
    Check all hydraulic hoses, spray lines and air lines for any signs of wear that could result in problems while operating.

    It’s best to run the sprayer at a minimum of 5 bar to check for leaks. Also check the spray tank is fixed down securely, all straps and bolts are tight.

    Boom checks

    Once opened out, check the boom has good movement in the x- and y-axis. All machines are different so check with your manufacturer as to how the boom is set up. Mr Robertson’s Bateman has tie rods and stock bots that can be adjusted to set the boom up to ride well.

    Check the tie rod nearest the back of the machine is slightly loose when moving and that the front rod is tight. Next, check for up and down movement by gently pushing the boom down by about 50cm and letting go. The boom should return to the central position without too much bouncing around.

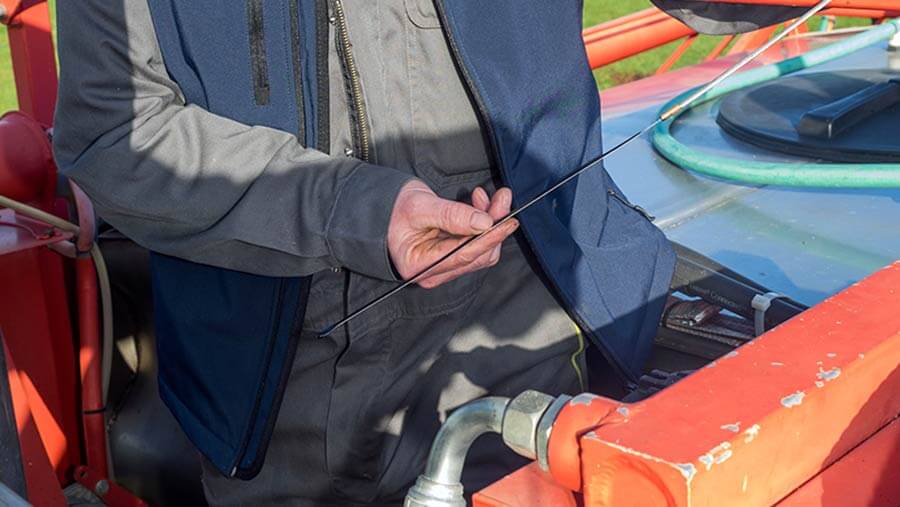
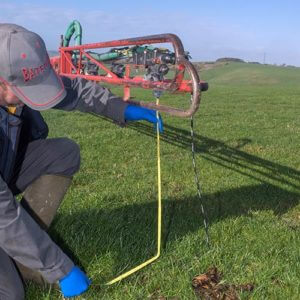
    “We want a little bit of movement but not excessive so that you can ride over the bumps as you go along without over- and under-dosing the crop,” says Mr. Robertson. Boom height is one of the most critical factors when spraying and the ideal height is 50cm above the crop. One of the easiest ways to work this out is by using a cable tie that is cut off at the correct length to use a visual aid from the sprayer cab.

    Don’t forget to measure from the tip of the nozzle to the crop, not the spray line.

    Good sprayer cleanliness is important, so make sure the system is rinsed through at the end of each day with clean water to make sure there’s no residue left in the boom. If your machine’s boom doesn’t have recirculation, remember to take the end caps off occasionally and flush out the whole boom.

    Nozzle checks

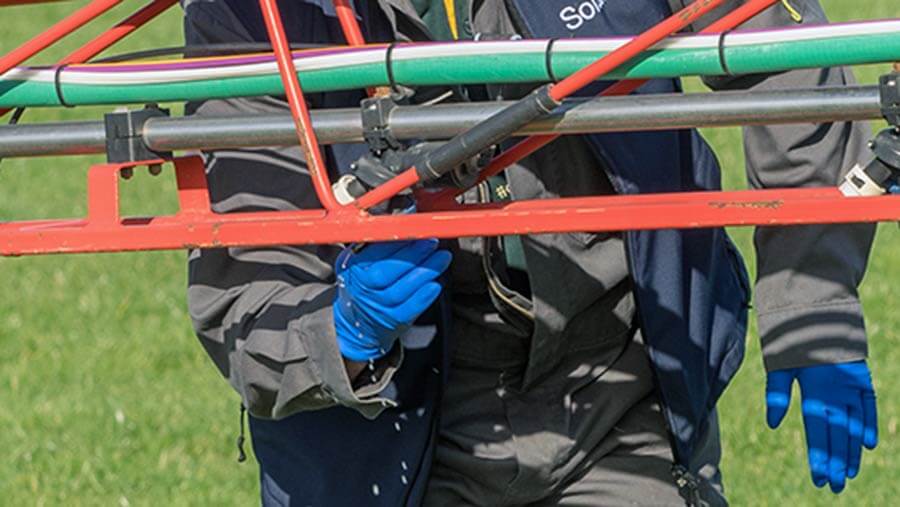
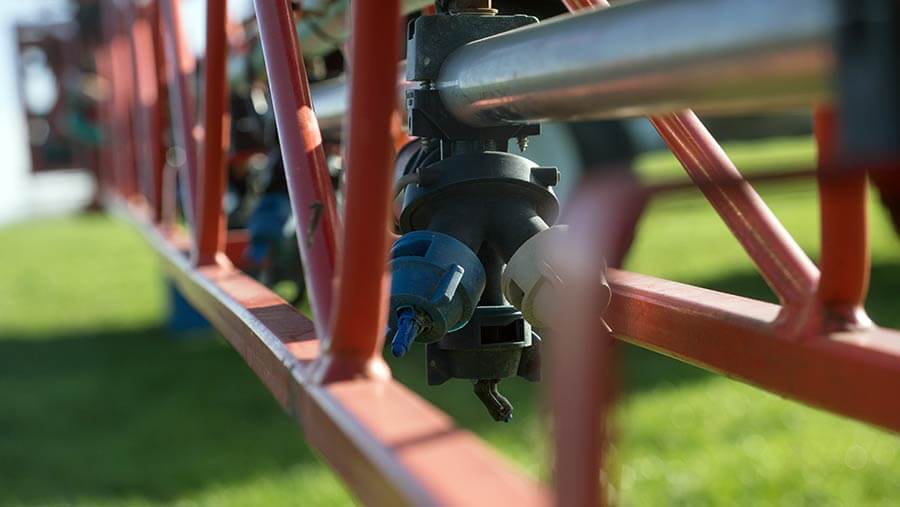
    Check that the nozzles are aligned both vertically and horizontally, according to the NSTS guidelines. Loosen clamps to adjust any nozzles that need realignment.

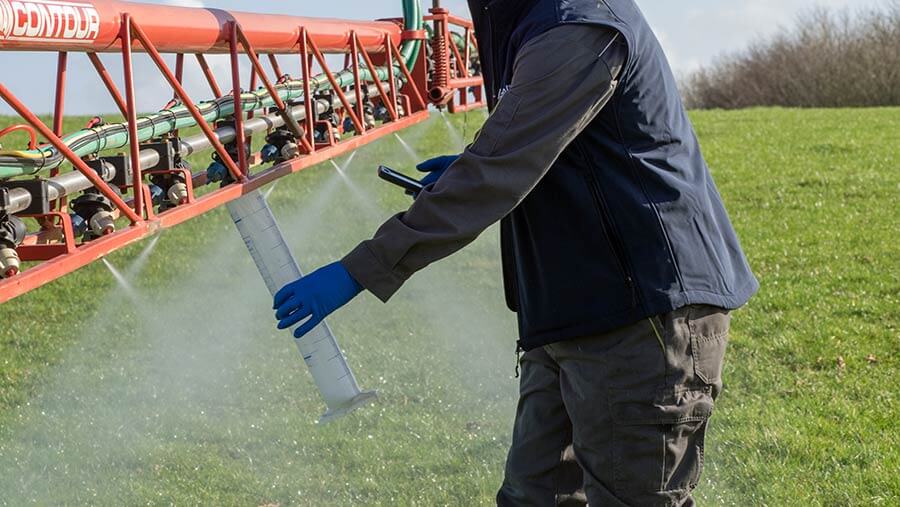
    Check the nozzle output at least twice a year by running the sprayer with clean water at 3 bar pressure. Time the output of each nozzle for 30 seconds. If nozzles have been used previously, it’s best to check their output against that of a new pair. Mr Robertson advises using a measuring cylinder rather than a jug to measure the flow rate as a jug is less accurate “because you get a bigger variation over the wider surface area”.

    With an 03 nozzle running for one minute at 3 bar pressure, the output should be 1.2 litres/minute as a rule of thumb but refer to the nozzle manufacturer’s output chart for the expected flow rate. “An easy way to remember this is: at 3 bar your nozzle size multiplied by four will give you your target litres/minute output. It works for all nozzle sizes.” If the output varies more than 4% of the average, or if the spray pattern visually doesn’t look correct, you need to change the nozzle set.
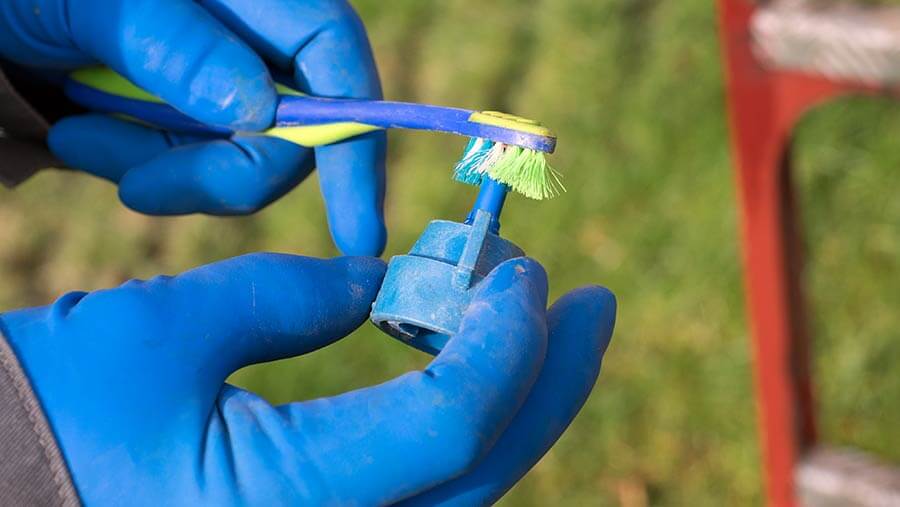
    After checking the output, cross-reference this figure with the rate controller – you may need to adjust the flow figures to ensure that the two correlate. If a nozzle becomes blocked while spraying, Mr. Robertson says he will swap it for a new one and then clean it later using a toothbrush or airline. Never blow through a nozzle with your mouth.

    Nozzle choice

    The choice of nozzle is highly dependent on the sort of job you’re doing. “Timing is crucial but using the right nozzle at the right time will make the job so much easier, cut drift and mean that you’re getting more of the product where you want it to go. If you aim at it you will hit it,” says Mr. Robertson.

    His nozzle of choice is an 03 size and he prefers to use the Defy 3D nozzle alternated forwards and backwards across the boom for pre-emergence work and T0 applications as well as the T3 ear spray. “In less than optimum conditions I may prefer to use the Amistar/Guardian Air, a fine induction nozzle. I would use this at T1 and T2 and also in sub-optimum conditions.”  This nozzle has a 3-star Local Environmental Risk Assessment for Pesticides (LERAP) rating and is 75% drift reducing.

    A water volume of 100 litres/ha is a good rate for spring fungicide application. It provides enough coverage for good disease control and allows maximum efficiency from the sprayer.

    Forward speed

    The third and final part of reducing spray drift is forward speed. Depending on nozzle size and water volume, aim to travel at 12kph.

    Mr Robertson says he finds that this speed gives a good overall output and means you don’t get shadowing or turbulence behind the machine.

    Tips and tricks

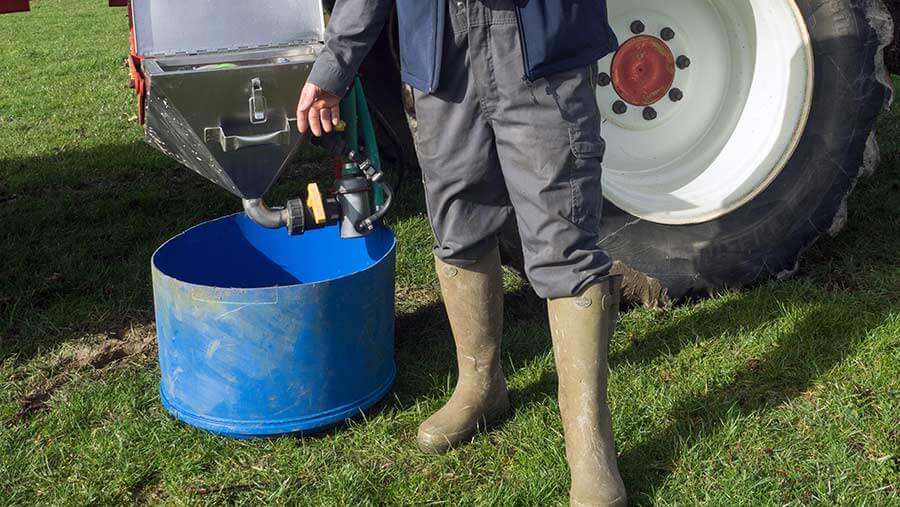
    One of the biggest risk of contamination is at fill up. “A fantastic, cheap trick that I learned through Farm Sprayer Operator of the Year is to take a 200 litre plastic drum and cut it in half to create two drip trays to catch any spillages under the induction hopper and the tank overfill.” This eliminates point source contamination, he says.

    “Finally, there’s a plethora of information out there on the internet, loads of good apps to download. The technology is there to help us do the best job possible and make our job as safe as possible.”

  • Alternate Row Spraying

    Alternate Row Spraying

    Alternate Row (aka Alternate Row Middle [ARM]) spraying is an application method where the air-assist sprayer does not pass down every alley during an application. The sprayer operator is relying on the spray to pass through one or more rows and provide acceptable coverage to the entire canopy (or canopies) on a single pass.

    Some state agencies promote this spraying strategy to various degrees, and many sprayer operators (whether they admit it or not) have used this method of spraying. I have advised it myself for very young and/or very sparse vineyard and orchard plantings, but never without confirming coverage. When I tell operators that I have serious reservations about alternate row spraying, they defend it. Here are the most common justifications I’ve heard over the years, and my response:

    JustificationReply
    “I do not have enough spray capacity to spray every row when time is short.”You need more sprayer capacity. Get another sprayer so you can get spray on in time or invest in a multi-row sprayer is possible.
    “ARM spraying saves money and reduces environmental impact because I use less pesticide.”Technically, if you travel every second row with a sprayer calibrated to travel every row, you have indiscriminately reduced your carrier and chemical inputs by half (or more). Without close monitoring you may compromise your efficacy.
    “I only perform ARM spraying early in the season when canopies are empty, or only on young plantings.”I grudgingly grant this one as long as coverage is closely monitored. I’ve prescribed it myself in young or sparse plantings where I couldn’t get the sprayer output low enough to prevent drenching the targets.
    “The spray plume in the alley beyond the target row must mean the spray is providing adequate coverage. More is better!”If the spray is blowing through the canopy, it isn’t landing in the canopy. Further, if the air speed/volume is too high, droplets can ‘slipstream’ past the target without impinging on them. I’ve removed water-sensitive paper from canopies with barely any spray on them despite the plume in the downwind alleys. It looks like a magic trick, albeit an unhappy one.
    “Uncooperative weather doesn’t always leave me enough time to spray the entire crop, and it is the lesser of two evils to spray alternate rows than not at all. I’ll make sure I come back to spray the other rows later.”Choosing to do half a job requires an understanding of the products’ mode of action. If you are spraying an insect at a particular stage of development, there’s no “coming back later” to get that generation – if you missed, your window has closed. If it’s a protective fungicide that offers no kick-back, then once the disease has infected tissue, the damage is done. Get the spray on as best you can, but if it washes away before it has a chance to dry sufficiently, be prepared to reapply at the earliest opportunity as long as the label allows it.
    “ARM has always worked in the past.”Would you mind picking my lotto numbers for me? You’re a very lucky person!

    My reservations about ARM spraying come from published research and personal experience that show that coverage is almost always compromised when spraying from one side of a canopy. The spray must pass through the canopy to reach the far side, and the canopy filters droplets from the air as it passes through. This reduces the number of droplets available to cover the far side. In addition, high velocity spray will create “shadows” where any targets on the immediate far side of a leaf or branch become shielded and receive little if any coverage. Further still, fine droplets slow quickly as they leave the nozzle and take a long time to settle. As the entraining air slows and becomes erratic, the droplets float and change course, making their behaviour hard to predict.

    The cumulative impact can be seen in this infographic I built in 2016. The orchardist was a dyed-in-the-wool ARM applicator and he was resistant to driving every row because it took so much time. I wanted to show that he could claw back some of the lost time by spraying less pesticide every row versus his current volume every second row. He would need fewer refills, and save a LOT of unnecessary pesticide. The water sensitive paper does the talking, and while I’d like to think I’ve convinced him, I’ll bet he’s still out there dicing with fate.

    2016_ARM

    A very popular argument in favour of ARM spraying comes from orchardists that are shifting from semi dwarf to high-density plantings. They ask “How it is different to spray a four foot diameter tree from one side compared to an eight foot diameter tree from both sides”? 

    Well, we know coverage is reduced as a factor of distance. Spraying from one side gives a single opportunity to cover the middle and far side of a canopy, whereas spraying from both sides provides an opportunity for an overlap in coverage. Essentially, the centre of a canopy receives the cumulative benefit of two sprays. Coverage is therefore always improved when spraying from both sides, period.

    Spraying from one side gives a single opportunity to cover the far side of a canopy. However, spraying from both sides provides an opportunity for an overlap in coverage. In other words, the centre of a canopy receives less spray than the outside, but is essentially sprayed twice resulting in a compounding effect.
    Spraying from one side gives a single opportunity to cover the far side of a canopy. However, spraying from both sides provides an opportunity for an overlap in coverage. In other words, the centre of a canopy receives less spray than the outside, but is essentially sprayed twice resulting in a compounding effect.

    Why, then, do some sprayer operators claim that alternate row applications work? Because sometimes, they do! Just because coverage is reduced doesn’t mean it isn’t sufficient to protect the crop. It simply means that the potential for poor coverage and reduced dose is dramatically increased by alternate row applications. A sprayer operator might perform alternate applications successfully for years before conditions conspire to defeat the application: unfavourable wind, poor timing, increased pest pressure, poor pruning practices, excessive ground speed, high temperatures, low humidity, insufficient spray volume, and several other factors might occur simultaneously and reduce coverage below a minimal threshold for control. This confluence of bad luck may not happen the first year, or the second, but eventually…

    Product failure isn’t the only concern. Repeated reduced dosages may play a role in developing resistance. In those situations where the operator recognizes insufficient coverage, they may have to spray more often to compensate, negating any savings in time or product. Reduced dosage is a common error when a sprayer operator elects to use ARM.

    If you still aren’t convinced, at least perform alternate row spraying the “right” way. Here are three situations that I’ve heard operators refer to as alternate row spraying. Situation 1 is most common, but to my mind only Situation 2 would be considered acceptable. Even then, confirming coverage is a must.

    Situation 1:

    The sprayer has a typical calibration for spraying every row, but only drives alternate rows. The first application (solid line) covers different rows from the second application (broken line). The operator will claim to spray more frequently, but generally does not perform the second application unless there is high pest pressure. The result is half-a-dose per hectare per application.

    The sprayer has a typical calibration for spraying every row, but only drives alternate rows. The first application (solid line) covers different rows from the second application (broken line). The operator will claim to spray more frequently, but generally does not perform the second application unless there is high pest pressure. The result is half-a-dose per hectare per application.
    The sprayer has a typical calibration for spraying every row, but only drives alternate rows. The first application (solid line) covers different rows from the second application (broken line). The operator will claim to spray more frequently, but generally does not perform the second application unless there is high pest pressure. The result is half-a-dose per hectare per application.

    Situation 2:

    The sprayer is calibrated for double output compared to a typical every-row situation, and the operator drives alternate rows. The result is that the hectare gets the whole dose per application, but coverage is always inconsistent.

    The sprayer is calibrated for double output compared to a typical every-row situation, and the operator drives alternate rows. The result is that the hectare gets the whole dose per application, but coverage is always inconsistent.
    The sprayer is calibrated for double output compared to a typical every-row situation, and the operator drives alternate rows. The result is that the hectare gets the whole dose per application, but coverage is always inconsistent.

    Situation 3:

    Since the sprayer will only drive alternate rows, the operator mistakenly sets the sprayer to emit half the output compared to a typical every-row situation. The first application (solid line) covers different rows from the second application (broken line). The result is a quarter-dose per application, and if the operator chooses to spray a second time, the hectare will only ever get half-a-dose. Yes, this happens.

    The sprayer has a typical calibration for spraying every row, but only drives alternate rows. The first application (solid line) covers different rows from the second application (broken line). The operator will claim to spray more frequently, but generally does not perform the second application unless there is high pest pressure. The result is half-a-dose per hectare per application.
    The sprayer has a typical calibration for spraying every row, but only drives alternate rows. The first application (solid line) covers different rows from the second application (broken line). The operator will claim to spray more frequently, but generally does not perform the second application unless there is high pest pressure. The result is half-a-dose per hectare per application.

    So, my final word on alternate row applications is that they should be performed with extreme caution. I’ve used them myself in early season applications in new plantings, but never without confirming coverage with water-sensitive paper, and never in conditions that might further compromise coverage to the point that the application does not give control.

    Caveat Emptor!

    Well, I thought it was funny. My apologies to J. Luymes from British Columbia (pictured) and Obi Wan Kenobi (not pictured… or is he?)
    Well, I thought it was funny. My apologies to J. Luymes from British Columbia (pictured) and Obi Wan Kenobi (not pictured… or is he?)
  • Calibrating a Plot Sprayer

    Calibrating a Plot Sprayer

    It’s the rite of passage of many agricultural summer students across the world: applying experimental treatments to field plots using a research sprayer. The results of these experiments may be the basis of new product use registrations, or provide clues into future scientific studies. Needless to say, the application method needs to be bullet proof to ensure the results are reliable. Here are a few guidelines, starting with some tips:

    Pro Tips:

    1. When assembling a hand-held boom, ensure the threads are properly sealed using Teflon tape. More or less tape can be used to create a snug fit at the right part of the thread rotation.

    2. Choose nozzle bodies with diaphragm shutoff valves. These valves stop flow below 10 psi and prevent dripping of the nozzles after shutoff, without pressure drop during operation.

    3. Avoid the use of older style “check-valve strainers”. Although these also prevent drips, they create a pressure loss of about 5 psi which creates uncertainty around the actual spray pressure.

    4. Install a trusted pressure gauge on the handle of the sprayer in clear view for the operator. This provides important information. Don’t believe the gauge on the regulator. Ours, for example, is stuck at 30 psi.

    5. For hand-held booms, rotate the booms so that the nozzles point down, for each application. Different size people or height of crops will change this angle and make accuracy more difficult.

    6. Set the boom height so that you achieve 100% pattern overlap. This means that a nozzle’s pattern width should be twice the boom’s nozzle spacing. Boom height will be close to 50 to 55 cm above target, depending on fan. Too low, and the pattern may cause striping. Your supervisor will see that all year long and think of you.

    7. You can test the spray pattern by applying water to a concrete pad. At the right boom height, the entire boom width should dry at a similar rate.

    8. Install a visual guide for boom height. For example, place a wire flag at the end of the plot, at the correct height. This will provide a handy reference of boom height as your arms get weary. Or hang a wire, zip tie, or chain from a spot that doesn’t interfere with your spray pattern (thanks ACC).

    9. Minimize weight by using smaller bottles of CO2. We use 20 oz paintball bottles, they are much lighter, last long enough, and can be legally refilled with liquid CO2 or topped up with gas from a nurse tank in the field.

    10. Spray out leftover mix in a designated part of the plot area. Do not pour any mix on the ground. Please. Consider a biobed on your research farm.

    11. When completing a treatment, spray the boom completely empty so air comes out of each nozzle. This provides certainty that the next liquid at the nozzles is from the next bottle, be it water or another treatment.

    12. When spraying dose responses of the same product, always start with the lowest dose. Again, spray out in a designated place until the boom produces air, no need to flush.

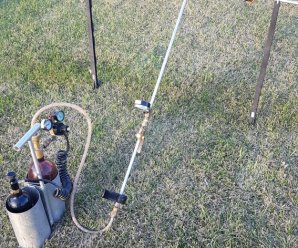
    13. Construct a boom hanger from electric fence posts and coat hangers. Nozzles face down and can be serviced. The boom should never lie on the ground.

    14. Use nozzle screens to prevent time delays due to plugging. Usually 50 (blue) or 80 (yellow) mesh is sufficient. Any finer mesh may interfere with some dry formulations. Note: Beware old screens – ISO mesh colours have changed. Learn more here.

    15. It’s very useful to apply research sprays with low-drift nozzles. Air-induction tips are most effective. These reduce drift, and are also closer to the commercial spray quality used by producers.

    16. 01 size (orange) air-induced nozzles are available from Albuz (AVI Twin and AVI), Arag (CFA, CFAU, AFC), Billericay (Air Bubble Jet), Greenleaf (AirMix and TurboDrop XL), Lechler (ID3 and IDK). No other major manufacturer produces this small size of tips in air-induction.

    17. 015 size tips (green) and larger are produced by the above, as well as Albuz (CVI Twin and CVI), Hypro (GuardianAIR or ULD) and TeeJet (AIXR, AI, and TTI), within both manufacturers listed in order of increasing coarseness.

    18. Always carry several other nozzles of the same size and type already on the boom. Should a nozzle plug, replace it, don’t clean it. Clean it later.

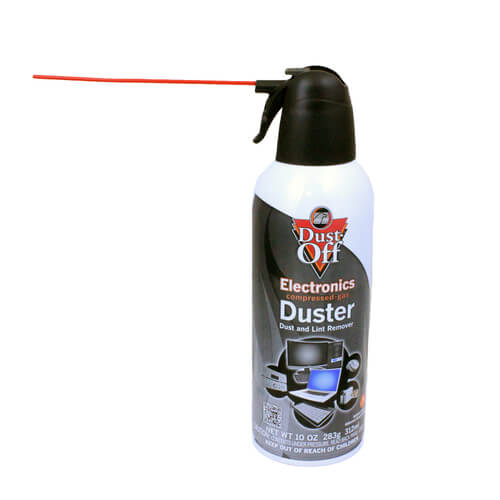
    19. If a nozzle plugs and there is no extra nozzle, use compressed air to clean it. Compressed air electronics cleaners are available in most electronic stores.

    20. If a plugged nozzle can’t be cleaned, simply place it at the end of the boom and continue. Plot ratings and yields are usually taken from the centre. Remind your supervisor of this.


    21. Always de-pressurize a sprayer before disconnecting any liquid hoses. You can’t rely on check valves. If two people work together, make sure you practice and communicate this with each other.

    Calibration:

    1. Assemble the sprayer and run water through it to ensure it’s free from silt or residue. Repair leaks.

    2. Install nozzles and ensure none are plugged and the pattern looks good.

    3. While spraying water, set pressure to what you intend to spray with. (Note: boom pressure will be lower than regulator (attached to CO2 canister) by a few psi, hence the separate pressure gauge on the boom. Also note that the set pressure will always be higher when the system is at rest.)

    4. Obtain four containers of similar size that can hold about 500 mL, and place on ground at nozzle spacing. Using stopwatch, emit spray directly into all four for a set time, say 30 s.

    5. Expected spray volume at 40 psi: 01 tip, 380 mL/min; 015 tip, 570 mL/min; 02 tip, 760 mL/min. In other words, from a 2 L bottle you’ll not get much more than 30 s spray time from 4 tips.

    6. Measure collected volume from four tips using the same graduated cylinder.

    7. Repeat, for total of three times.

    8. Average three reps for each nozzle and convert to mL/min. Make sure all nozzles are within 5% of the average flow. Replace those that aren’t or place worst offender on outside edge of boom.

    9. Advance to “Calculations”, but be prepared to conduct another calibration

    Now for the fun part.

    Calculations

    There are three options for applying the correct amount. We’ll be using metric in these examples:

    1. Use the average nozzle flow from the calibration (mL/min) and the target application volume (L/ha) to calculate the necessary walking speed (km/h);

      or
    2. Use the flow from the calibration and a set walking speed to arrive at an application volume;

      or
    3. Use a set walking speed and a set application volume to calculate a required calibrated flow.

    Option 1:

    Walking Speed = (60*flow)/(Volume*nozzle spacing)

    If your nozzle flow was 330 mL/min and you wanted to apply 100 L/ha using a sprayer with 50 cm nozzle spacing, your required walking speed is 60*330/100/50 = 3.96 km/h

    Option 2:

    Application Volume = (60*flow)/(Speed*spacing)

    If your nozzle flow was 330 mL/min and you wanted to walk 5 km/h using a sprayer with 50 cm nozzle spacing, your application volume is 60*330/5/50 = 79 L/ha

    Option 3:

    Required flow = (Speed *Volume*spacing)/60

    If your speed is 5 km/h and you wanted to apply 100 L/ha using a sprayer with 50 cm nozzle spacing, your required flow is 5*100*50/60 = 417 mL/min

    If you selected Option 3, you now need to return to your sprayer and find a nozzle, or a pressure, that delivers an average of 417 mL/min. You can use math to get into the ballpark with the nozzle you already have:

    New Pressure = (required flow/calibrated flow)2*calibrated pressure

    If your required flow is 417 mL/min and the calibrated flow is 330 mL/min, and you calibrated at 30 psi, then you should be close to your required flow at (417/330)2*30 = 48 psi

    Now, return to your sprayer, set the pressure to 48 psi, and confirm this estimate.

    We use Option 3 when comparing nozzles of the same size but from different manufacturers. It’s not uncommon for these to have slightly different outputs. Rather than adjusting our walking speed slightly, which is very difficult to do accurately, we change pressure slightly so all nozzles produce the same flow. This is also useful when comparing water volumes by switching to a larger nozzle.

    Travel Speed:

    The last step is to confirm travel speed. Say you want to walk at 5 km/h. The best way to calibrate walking speed is to measure a known distance (m) in the field you’ll spray. Wearing the gear and carrying the sprayer you will use to spray, walk this distance. Use a wire flag to mark the start and end points; when the boom hits the flags, start and stop the timer. Repeat until comfortable.

    Time needed to walk distance:

    Time (s) = Distance *3.6/required speed

    Say your walking distance is 10 m, and you need to walk 5 km/h.

    10*3.6/5 = 7.2 s

    A simple spreadsheet that can be used for the calculations can be found here.

    Congratulations! You’re done. Happy spraying! Remember to not worry too much about a 5% deviation from your expected application. That’s definitely an acceptable error, as long as you don’t allow too many of those to add up.

    Low Volume Research (Aerial)

    Some product uses are by air, and the label volumes for those are often 30 to 50 L/ha. Registrants need to provide efficacy data at those volumes. Ground application can be accepted as a surrogate for aerial as long as the volumes are correct.

    Since the spray nozzles aren’t typically available below the 01 (orange) size and if they are, they usually plug so easily and make such a fine spray that they’re frustrating to use. The alternative, to travel faster, is also problematic on research plots.

    We recommend that Turbo TeeJet nozzles be used for this purpose. They produce such a wide fan angle that a 100 cm spacing is justifiable. Simply cap off every second nozzle body. Booms need to be elevated to ensure overlap, for uniformity. The value of the small nozzles and wider spacings is the low total application volume that is now possible.

    The TT tips can also be used at fairly low spray pressures (say 20 psi) further reducing their output.

    Spray Quality of TeeJet Turbo TeeJet (ASABE S572.1). This tip is available in smaller sizes and, due to its wide fan angle, can be used at 40″ (100 cm) spacing, therefoe applying low water volumes.

    /