Canada, like most of the world, is officially Metric. America operates using the US Imperial system. It sounds very cut and dried, doesn’t it?
However, anyone that’s tried to calibrate a sprayer in Canada quickly discovers that we’re really an amalgam of the two systems. We like to call it “Mock-tric“. By way of evidence, some operators still adhere to the dreaded L/ac. You know who you are. To be fair, some of our sprayers and nozzles originate from the states, meaning nozzle tables and rarely, sprayer indicators, can be in US Imperial.
This leads to mind-bending questions such as:
I drive 12 mph, spraying 150 L/ha and my pressure is about 40 psi. How many ml/min should my 72 nozzles emit for a product that wants a 6 oz/acre acid equivalent?
Cue the quiet sobbing…
Frustrated back in 2017, we created a set of conversion tables to help operators with almost any Imperial/Metric emergency. Admittedly, they were in 4-point font and therefore too cumbersome for practical use. We’ll keep one here for posterity.
The good old days of “look-up tables”. RIP.
Happily time has marched on and we now have a better way. Explore our new Unit Conversion Tool, below. It allows you to convert between common (and some uncommon) agriculturally-relevant units.
There are many factors that affect the work rate of an airblast application. If an operator can improve their work rate, without compromising spray efficacy or safety, they improve operational efficiency and save money.
But how does each variable factor in? Is it worth the cost of a tender truck and operator to fill more efficiently? Should you upgrade to a multi-row sprayer? Should your next planting have longer rows? We have a simple calculator that can help you make these decisions. You can build and compare multiple scenarios to explore the relative impact of small changes to your typical spray program. We recommend making only one change for each scenario so you can better understand the results. Print the comparison page for your records.
Whether you’re a sprayer operator, or a manager of sprayer operators, this exercise will help you see your spray program in a whole new light. Try our productivity calculator at the end of the article and explore your productivity.
Spoiler: It’s amazing how changes to travel speed have only a marginal impact on work rate. Often less than 60% of the total spray job is spent actually spraying!
If you’d like to see just how productive you can be, check out this rare (possibly unique) sprayer from Ed Oxley Farms in Michigan. Built on an OXBO 7550, this sprayer is the fourth iteration of a concept developed over the last 20 years by Ed Oxley Farms and ag engineers from Michigan State University.
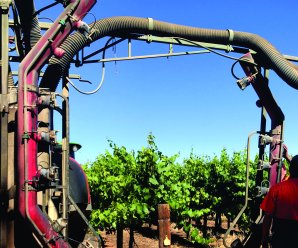
Capable of spraying five rows at a time, this self-propelled beast is a hybrid wrap-around and targeting-tower system that uses CurTec spray heads equipped with tangential fans and wire-mesh basket rotary atomizers.
That’s not dribbling – that’s purging the boom prior to spraying.
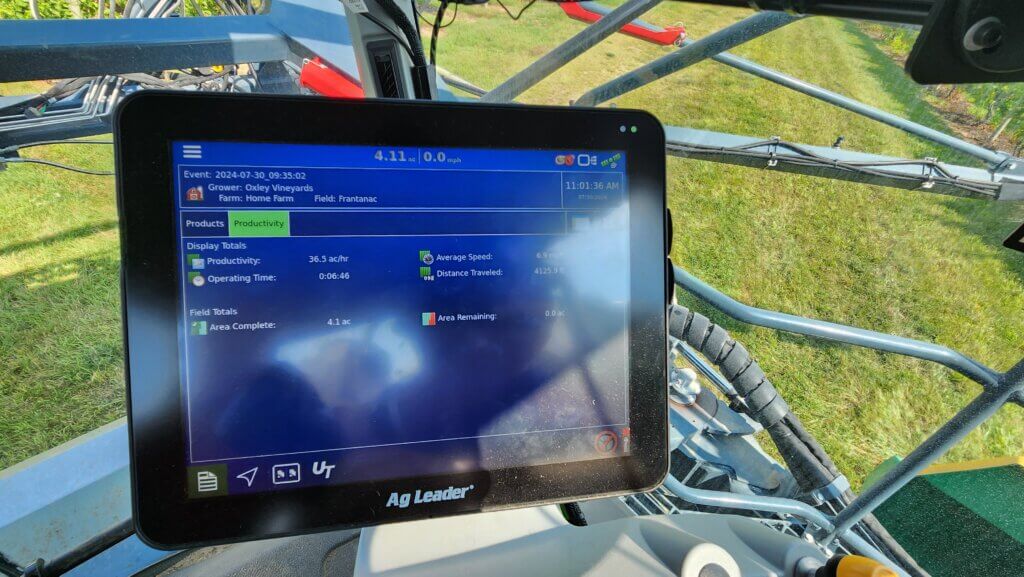
It sprays a mere 150 L/ha (~ 15 gallons/acre) at a ripping 13 km/h (~8 mph), as seen on the Ag Leader monitor below.
When row spacing and turn time are accounted for, that means it’s capable of covering almost 15 hectares (~40 acres) per hour.
And, when not spraying grapes, the boom can be swapped to make it a high-clearance corn sprayer. It doesn’t get much more efficient than this.
The following videos will show the view from inside and outside the cab. Note that the row that’s straddled is sprayed from an overhead spray head mounted to the centre rack behind the sprayer. The two adjacent rows are covered from one side from vertical spray heads mounted on the chassis. Finally, the boom holds two more overhead spray heads for the outer-most rows.
Ideally, the boom-mounted spray heads would be suspended vertically inside the row, but it makes for such a wide turn radius that it would take too long to turn… assuming there was enough headland to allow it. They’re also swept-back to minimize the turn radius and reduce the amount of airborne spray that deposits on the sprayer itself.
A clever design that makes a few compromises to ideal coverage in order to improve productivity. The balance works for them and this sprayer might be a sign of things to come in horticultural crop production systems. Want to see how your sprayer stacks up? Download the calculator and see where you might be able to make improvements.
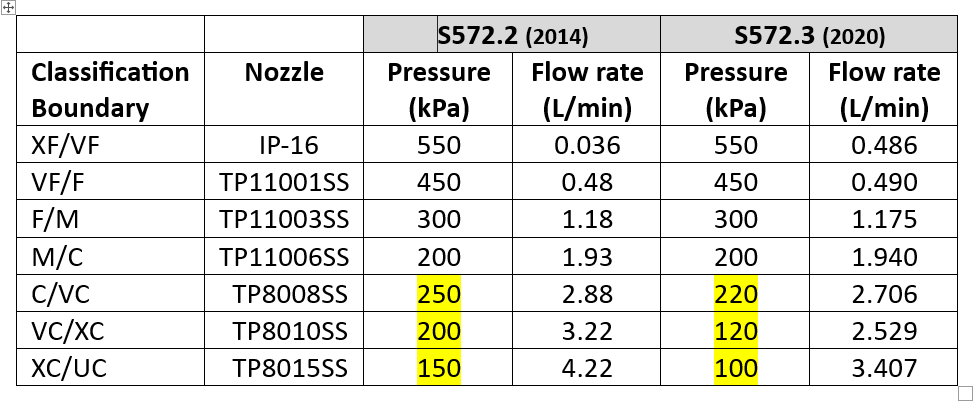
A new version of standard ASABE S572.3 (adopted 2020) and its international equivalent, ISO 25358 (adopted 2018) addresses a limitation of the previous standards. In ASABE S572.2, the nozzle that defined the category boundary between the XC and UC sprays was the TP8015 SS at 4.22 L/min, corresponding to 150 kPa. Only very few nozzles produced UC sprays, and those that did only did so at the lower pressures and higher flow rates. For those nozzles, the categories worked.
The emergence of a host of new low-drift nozzles designed to meet the regulatory requirement for drift protection for Xtendimax and other dicamba formulations in soybeans revealed the limitation of this boundary nozzle choice. In essence, all the new dicamba-compliant low drift sprays were UC, regardless of nominal flow rate or spray pressure. Any effect of, say, higher pressure that would create a finer spray, was not revealed. It was decided that new boundary nozzles were needed so that the coarser sprays’ response to flow rate, pressure, and formulation or adjuvant choice, could be better described.
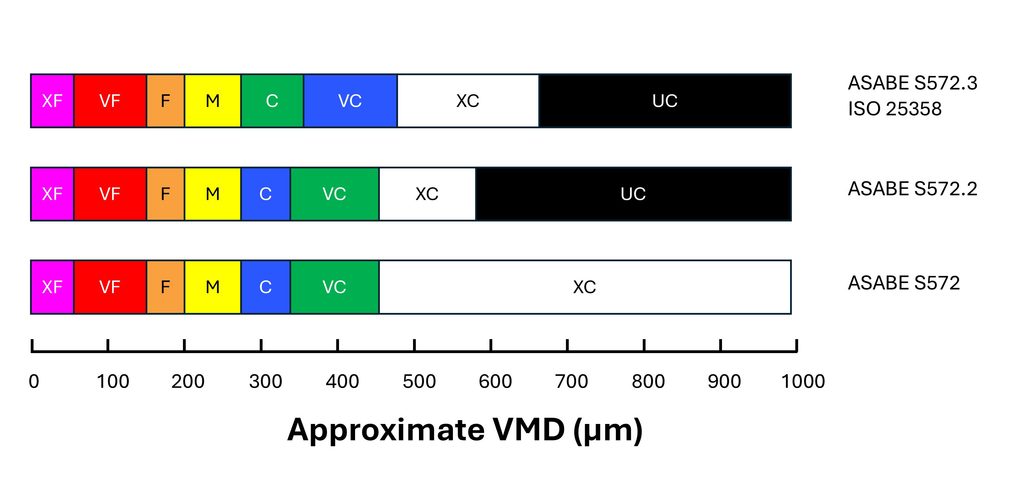
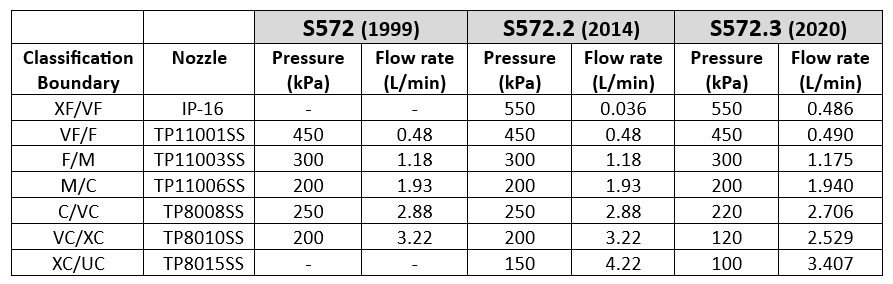
S572.3 therefore lowered the defining flow rate of the XC/UC nozzle from 4.22 to 3.41 L/min, with a new spray pressure of 100 kPa (from 150 kPa). This made the new boundary spray coarser. Because this change made the adjacent spray quality class, the XC, broader, the VC and C categories were each also widened somewhat, by lowering their respective boundary nozzle flow rates and pressures (Table 1).
Table 1: Change in spray pressure of three coarsest boundary nozzles from ASABE S572.2 to S572.3
For XF, VF, F, and M spray classes, there is no change with this new standard because the boundary nozzle conditions were not changed. But the C, VC, XC, and UC classes became coarser.
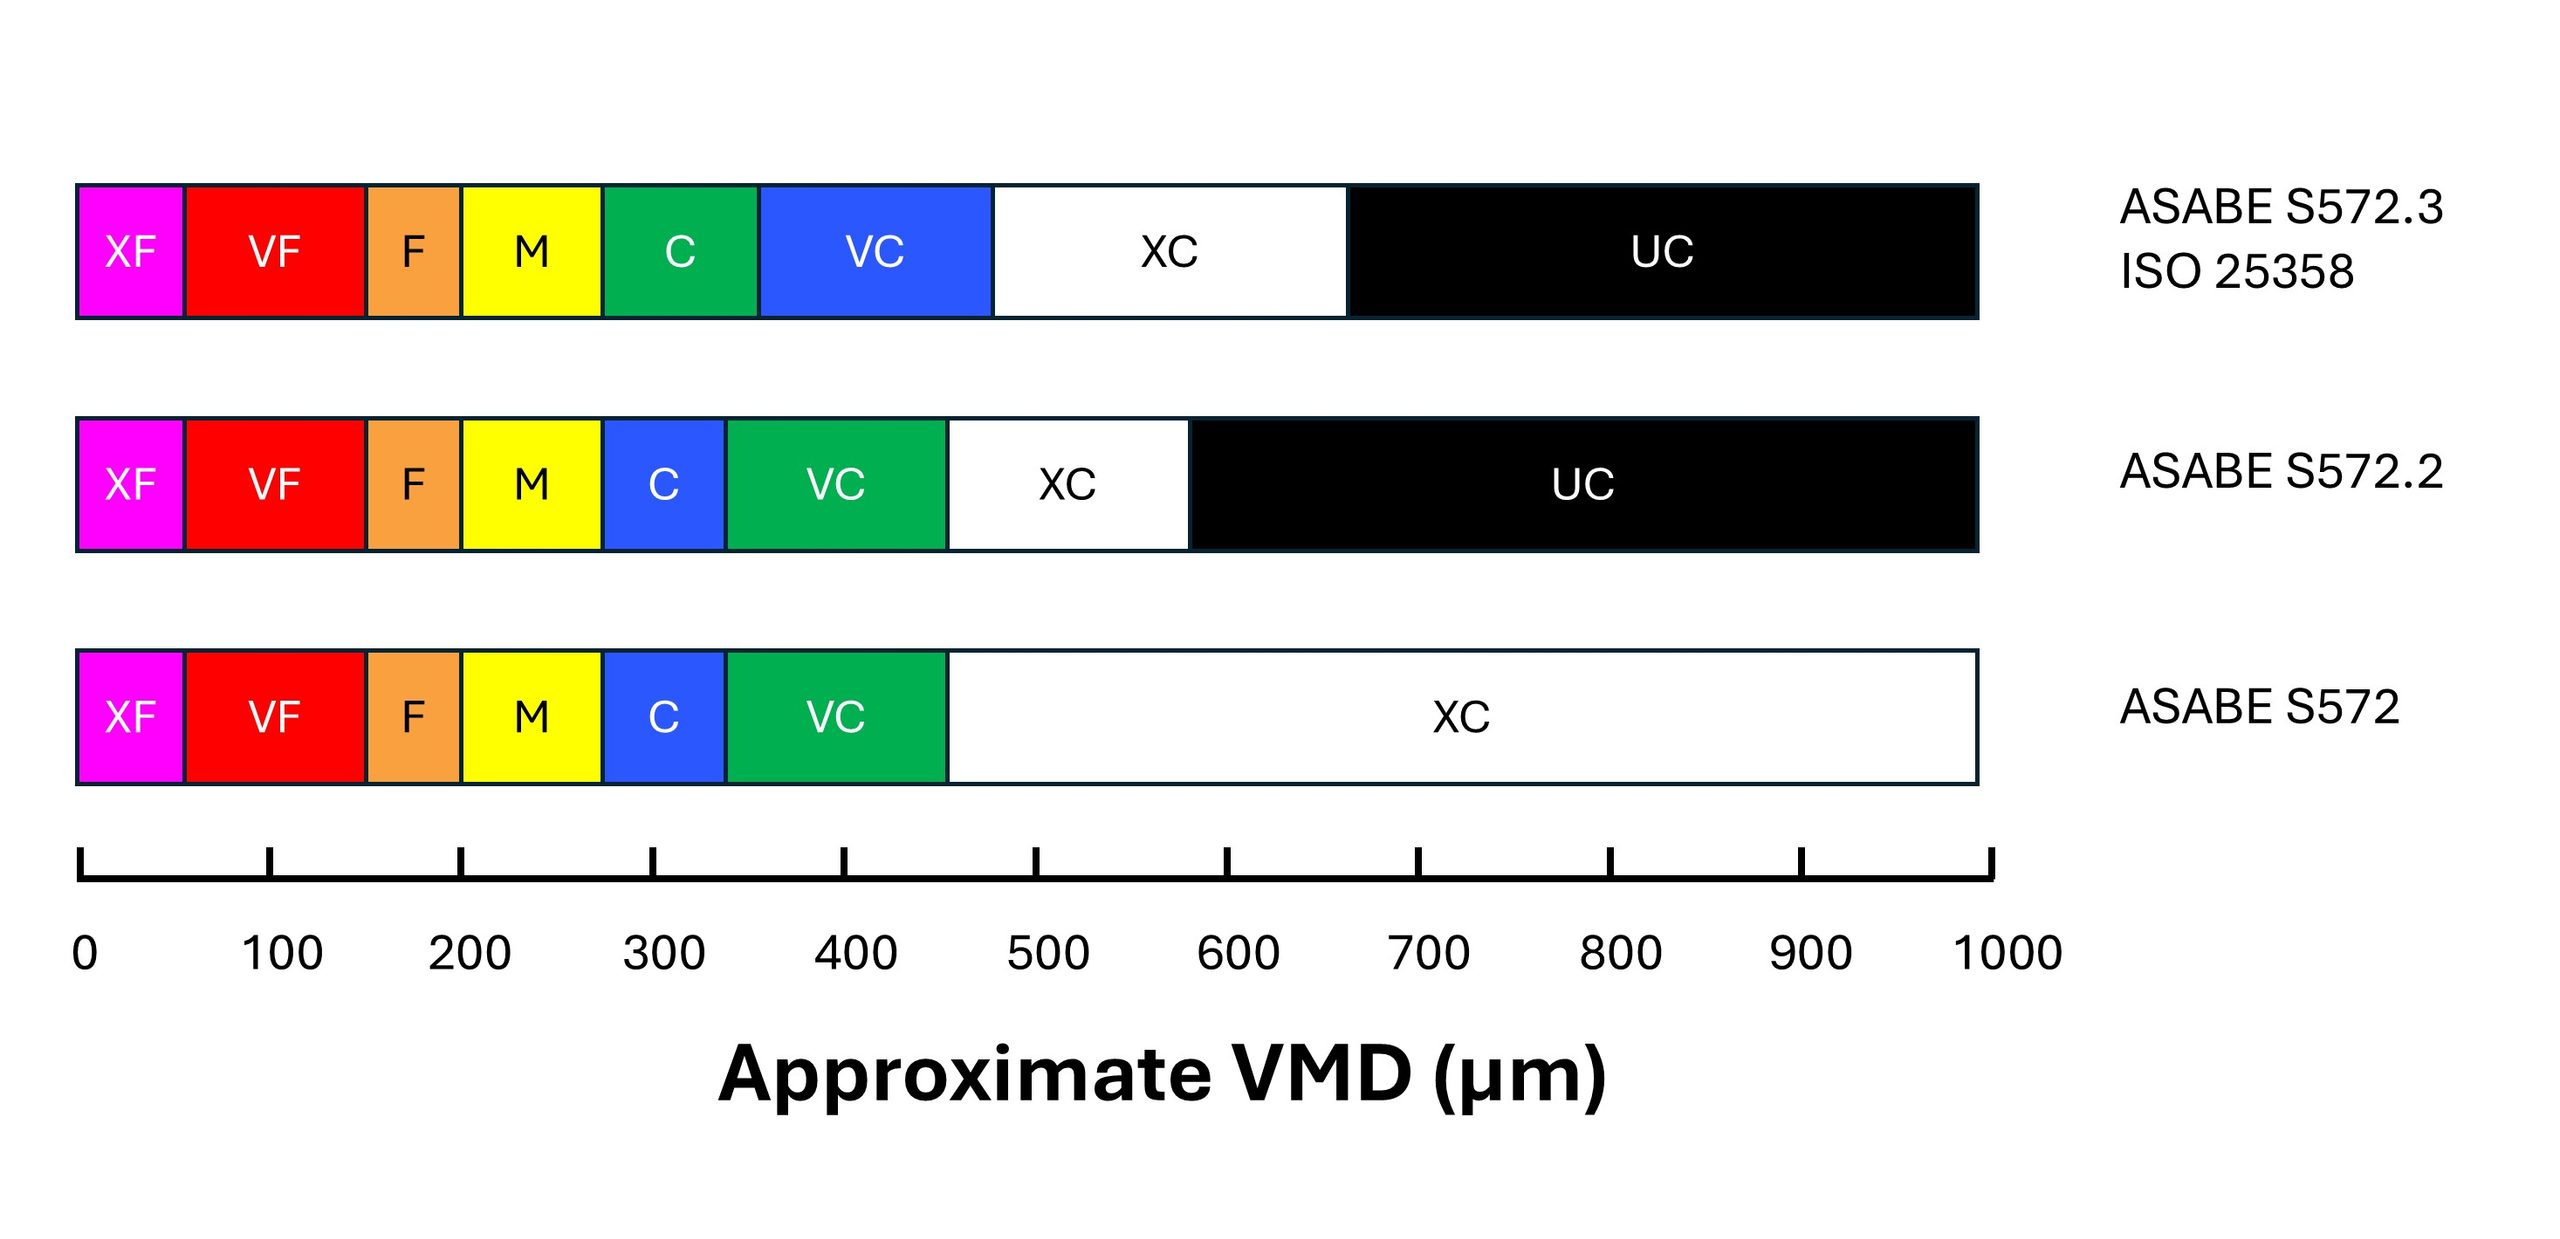
In order to signal the change to consumers, the colour coding of the Coarse and Very Coarse sprays was switched. With S572.2, C was blue and VC was green. With S572.3, C is now green and VC is blue (Figure 1).
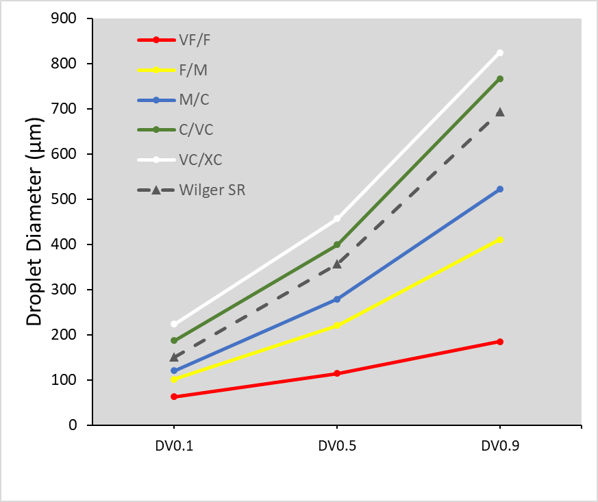
Figure 1: Approximate changes in the Volume Median Diameter (VMD) of boundary nozzles under the S572 standard versions. Note that the coarsest spray quality categories are more equally distributed in the newest standard versions.
The change means that low-drift sprays categorized using S572.2 can no longer be accurately compared to nozzles categorized using S572.3. For example, if a researcher conducted efficacy studies and concluded that ASABE S572.2 Coarse sprays provided acceptable efficacy, but S572.2 Very Coarse sprays had lower performance, they might recommend Coarse sprays. But would that recommendation be safe for nozzles classified with S572.3? In that standard, the C category extends into the territory formerly occupied by VC, deemed too coarse by the research.
A similar problem exists for spray drift risk assessments. Let’s say a regulator recommends a 25 m buffer zone for ASABE S572.2 VC sprays based on modelling the drift from that C/VC boundary nozzle. What will the buffer zone be for the new S572.3 VC spray? Since the newer VC spray is coarser at its lower boundary, drift, and therefore the buffer zone, would be less. Determining how much so would require a new spray drift dataset for the new boundary nozzle.
In fairness, most of the risk assessments are done on finer sprays such as Medium and Coarse, and those would remain unchanged because to be conservative, the regulator would assume the finest spray within each category (i.e., the lower boundary nozzle). But when a registrant requests that risk assessment be done with a coarser spray quality such as VC, XC, or UC, the regulator would need a new dataset.
Another problem is that not all spray quality data reported by manufacturers use the new standard. Of the major North American manufacturers, Spraying Systems started reporting their products using the S572.3 standard in 2023. Pentair Hypro, and by extension John Deere, as well as Wilger Industries have not yet followed suit.
The European manufacturers are well on their way. Agrotop (Greenleaf in the US), Lechler and Arag are both reporting using ISO 25358. But Billericay Farm Systems (BFS) are still reporting using the older standard.
It may have been some years since nozzle manufacturers last tested the spray quality of their nozzles. If they now measure their sprays using the new standard, some other changes have also have ocurred in the interim. For example, new laser measurement systems may have been acquired. New scanning techniques may have been developed. New staff are operating the systems. And while the ASABE and ISO reference nozzles are intended to negate these differences, we are still seeing some discrepancies. It is also possible that changes to the manufacturing of the nozzles has also altered the spray quality they produce.
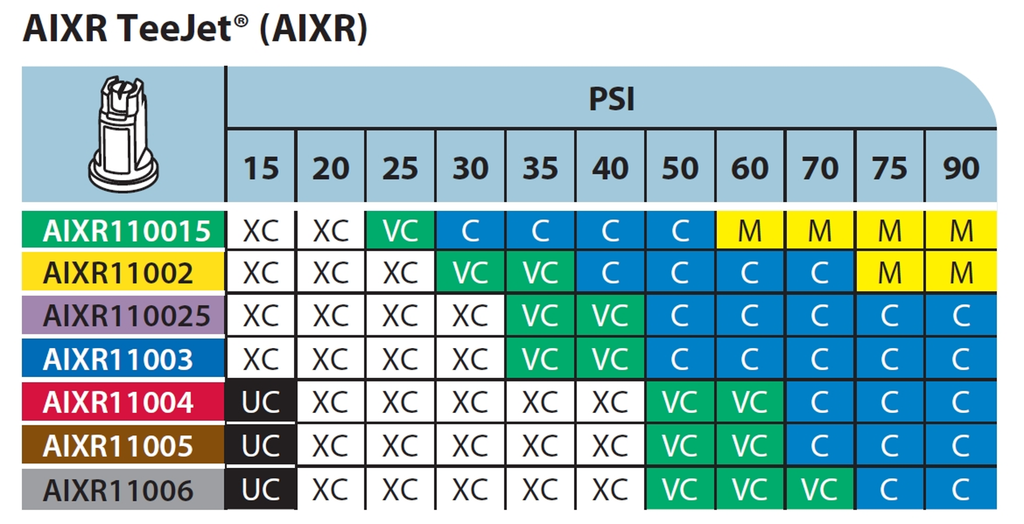
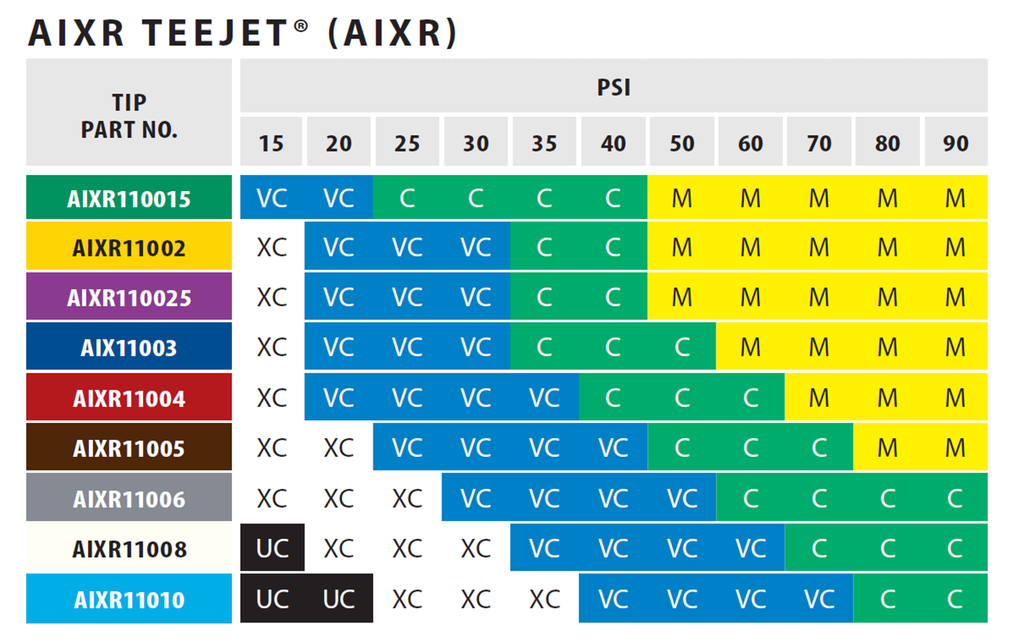
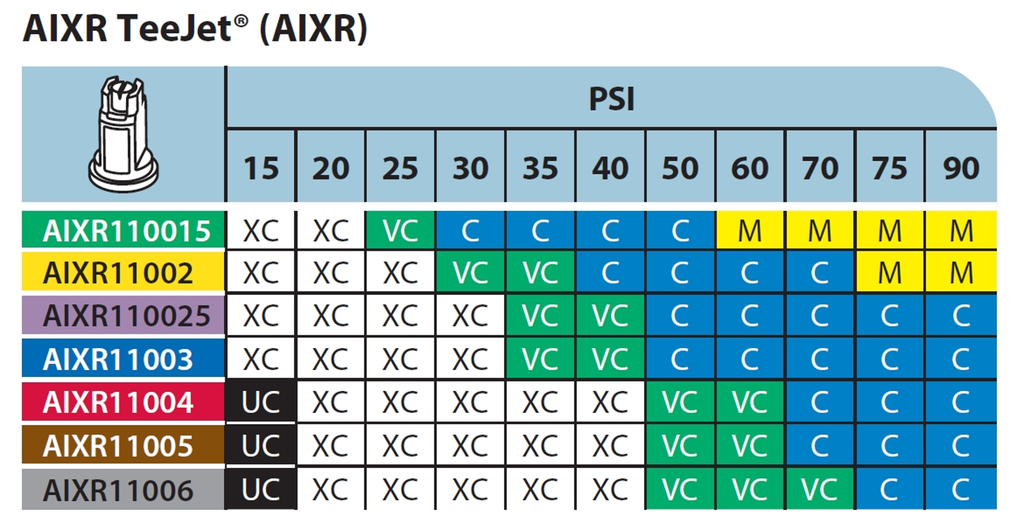
For example, compare Figure 2, the TeeJet AIXR nozzle spray quality chart, developed using ASABE S572.2 and published in 2015, to Figure 3, the same nozzle whose spray quality was categorized using ASABE S572.3 and published in 2023.
Figure 2: Spray quality of TeeJet AIXR tips according to S572.2, published by Spraying Systems in 2015. Reproduced from TeeJet Catalog 51A.
First, let’s compare the portion of the chart that reports Medium spray qualities in Figure 2 to that in Figure 3. These should be the same given that the same boundary nozzle and pressure was used in both. But under the new testing, the region reporting a Medium spray has significantly expanded towards the lower pressures. The Medium sprays begin at 60 and 75 psi in the old standard, but at 50 psi for the new standard.
Spray quality of TeeJet AIXR tips according to S572.3, published by Spraying Systems in 2023. Reproduced from TeeJet Catalog 52.
The region occupied by the Coarse category has shifted towards lower pressures, as expected with the coarser upper (C/VC) boundary nozzle. It would be wider, as was the intent, had the M catergory not encroached.
The region occupied by VC and XC have grown towards the lower left, more or less as expected. The VC category in particular, now dominates in the lower pressure region, a space previously occupied by the XC category. The small region which the UC category occupied under S572.2 in Figure 7 was replaced entirely by the XC category.
Looking at it another way, the commonly used AIXR11004 size at pressures between 30 and 90 psi would have produced XC, VC, and C spray qualities in the old catalogue. The same nozzle now apparently produces VC, C, and M sprays at the same pressure range.
These changes may or may not extend across all nozzles and manufacturers to the same extent as this example illustrates. But they add another level of complexity, and perhaps confusion, to applicators striving to be compliant with label directions. I am hopeful that the sector can quickly move to adopt the changes universally so that the mixed messaging is short lived and mistakes are minimized.
In particular, the regulatory bodies that rely on these spray quality classes to communicate drift potential and buffer zones must recognize that their risk assessments will need to reflect these new standards as more nozzle manufacturers begin communicating them.
Droplet size continues to explain most of what matters in spraying, from deposition uniformity, to coverage and spray drift. Hopefully this series of articles explaining the measurement of spray droplet sizes is useful and sheds some light on how the industry measures and communicates it.
When scientists with laser droplet sizing instruments compared their results with other labs using the same nozzles, the numbers didn’t agree exactly. Laser equipment type and age, optics, operating settings, scanning techniques, and software versions were important. Everybody had their own numbers that they trusted more than their colleagues’ in another lab. In order to communicate droplet sizes to the end user consistently, a way to resolve these differences needed to be found.
Scientists ushered in a new approach, that of using reference nozzles.
Rather than argue about whose instrument or measurement method was correct, experts decided to allow each lab to use their equipment but with measurement protocols that met certain standards for scanning accuracy. The way the systems were compared was with a set of agreed-on reference nozzles. These reference nozzles defined the boundaries of spray qualities and were measured by the lab at the same time they tested other nozzles. When a nozzle of interest produced a spray whose parameters fell between two reference nozzles, the spray quality was thus defined. In this way, the peculiar results of a certain measurement approach became irrelevant. All that mattered was where the result lay with respect to the reference nozzles tested by the same lab.
Credit is due to members of the British Crop Protection Council, who pioneered this result in the UK in the mid 1980s, and on which today’s droplet size classification standards are based. Their initial standard was first proposed in this paper:
Doble S J, Matthews G A, Rutherford 1, Southcombe E S E (1985). A System for Classifying Hydraulic and Other Atomizers Into Categories of Spray Quality. Proceedings British Crop Protection Conference – Weeds, 3, 1125-1133.
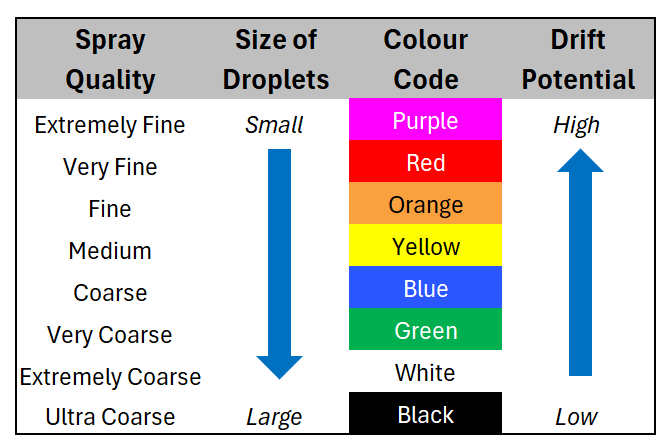
Thus the term “Spray Quality” was born, and after various incremental revisions, sprays were named Extremely Fine, Very Fine, Medium, Coarse, Very Coarse, Extremely Coarse, and Ultra Coarse and given a colour code for easy identification.
The American Society of Agricultural and Biological Engineers (ASABE) published the first Spray Quality Standard, S572, in 1999. It specified reference nozzles that formed boundaries from VF/F to VC/XC. It was updated to S572.2 in 2014 with the addition of the Ultra-Coarse category.
Figure 1: Symbols and colours used to designate spray qualities according to ASABE S572.1 and S572.2
In order to better represent nozzles that produced finer and coarser sprays, boundary nozzles for XF/VF and XC/UC were introduced with ASABE S572.1 in 2004. ASABE S572.2 corrected an error in the flow rate of the XC/UC in 2014.
In 2020, ASABE S572.3 was introduced, following on the heels of ISO 25358 that changed the operating conditions for the C/VC, CV/XC, and XC/UC boundary nozzles. S572.3 and ISO 25358 share the same boundary nozzles, allowing for similar implementation of the spray qualities across borders.
Table 1: ASABE S572 spray quality categories and their respective boundary nozzles and operating parameters.
The newest standards changed the boundary nozzle conditions for C/VC, VC/XC, and XC/UC as shown in Table 1. This was done in order to create more equally sized spray quality categories for the coarsest sprays.
How the Standard is Implemented
A laboratory that measures spray qualities would start by running the ASABE reference nozzles on their instrument. They would then calculate the three parameters we described in Part 2 (DV0.1, DV0.5, and DV0.9) and plot them as shown in Figure 2. Next, the lab would atomize various nozzles, pressures, adjuvants, etc. of interest to see where their parameters fall with regard to the reference nozzles and make a spray quality designation. In the example we’ve been showing, the Wilger SR nozzle is in the “Coarse” category using this approach.
Figure 2: ASABE S572.2 reference nozzles showing spray quality boundaries. Note that the example Wilger SR 11005 tip falls between the Medium/Coarse and the Coarse/Very Coarse border nozzles, making the spray quality “Coarse”.
Nozzle manufacturers have a responsibility to publish the spray qualities of their nozzles, and they do so on their web sites or catalogues. This makes it much easier for applicators to select the right nozzle for the job. With spray quality, the nozzle brand becomes less important. In fact, nozzles that produce the same spray quality can be expected to have very similar performance. Various nozzle models still have important distinguishing features, such as pressure range, fan angle, pattern tilt, etc. But a 110 degree air-induced nozzle that produces a “Coarse” spray quality should perform very similarly to a different manufacturer’s 110 degree air-induced nozzle that also produces a “Coarse” spray quality.
Figure 3: Spray qualities of the TeeJet AIXR nozzles according to standard ASABE S572.2. Note the sensitivity of spray quality to both spray pressure and nozzle size. Source: TeeJet catalog 51A.
Note that the spray quality categories are quite broad. Within any given spray quality range, we might see a two-fold range of drift potential, for example. It remains important to have a sense of where one is operating withing the spray quality range.
As these standards change, there are implications for how they can be used. An important change occurred with the latest version of the spray quality standard, and that will be discussed in Part 4.
In 2025 I ran a comparison between five florescent dyes and three UV lamps to determine which combination worked best for tracing spray deposition. If you haven’t read part 1, go do so and come back.
In early 2026 my colleague and I used the winning combination to evaluate spot sprayer deposition in an onion field, and it worked “OK”. Only “OK”. In fact, I think many of the growers attending that twilight meeting were being polite when they said they could clearly discern the coverage. The fundamental problem was that we required almost complete darkness for the dye to be visible, and even then, you had to hold the lights just right. Photography was nearly impossible.
That’s when my colleague showed me that I’d brought a knife to a gunfight when he illuminated the scene with a new UV lamp. It was a veritable lightsaber! The high wattage and different wavelength changed everything. I knew immediately that we would have to redo the dye comparison in “light” of this new development.
The Old (left) and the New (right).UV dyes are more easily discerned at twilight or darker. Note that this image was taken while it was still light outside using the new UV lamp. A game changer.
In September, 2026 we returned to Falcon Blueberries to paint the town red (well, green, orange and yellow). The images, which were taken with a cellphone, are stunning and yet they really don’t capture what we were able to see in person.
Dyes Used
We used the same dyes, mixed in the same ratios with NIS as in the previous study:
Risk Reactor IFWB-C81PT
Risk Reactor UVTRACER-G1PT
Eco Pigment Blaze Orange SPL15JX
Tri Art Fluorescent Yellow Tempura Paint
We omitted the Phosphor Powder (Zinc Orthosilicate: Manganese CAS#11-47-2) used in the last study because the SDS really didn’t qualify it as non-toxic, and it’s not within reach of most people. Also, you won’t see any photos of the Tempura paint, because there was nothing to see. Historically, I’ve held out hope that it was a viable option, but it’s really only ever worked when super-concentrated and applied by a hand sprayer. So, if you’re doing that, go ahead, but I’ll never use it in a commercial sprayer again.
Application
We used the same Turbomist airblast sprayer, and the operational settings aren’t really relevant, here. Suffice it to say we made a single pass with their conventional settings, and left 8 rows between blocks (that is, a buffer of four rows on each side of the pass) to ensure we didn’t cross contaminate the dyes. Then we waited for dark.
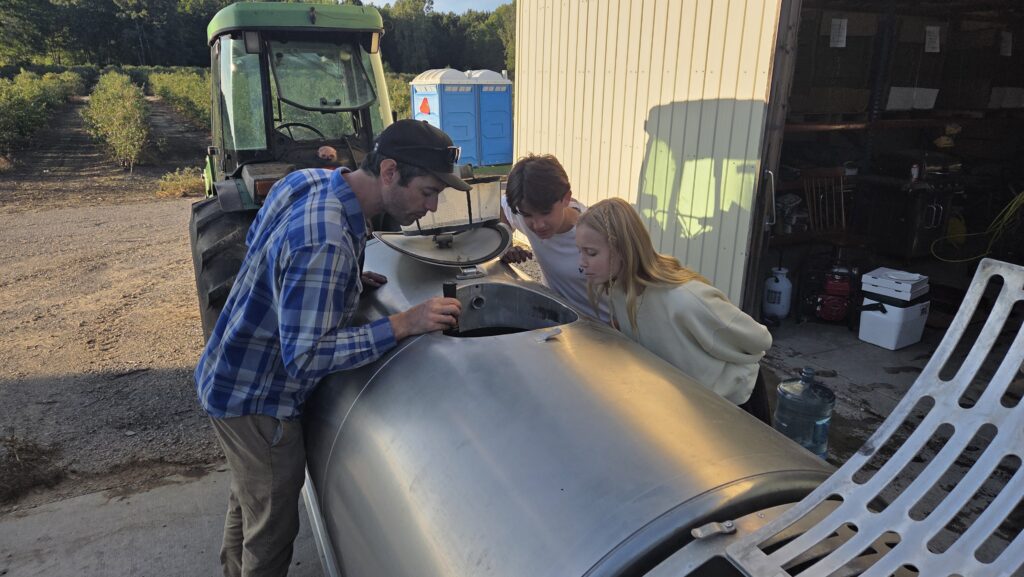
Even in daylight, dye helps visualize spray. Those top nozzles should have been off, but this was a post-harvest mock-up. When the bushes were larger and fuller there would have been better interception at the top.Adding colourful, non-toxic dye to a completely clean sprayer proved very interesting to the next generation of Falcon Blueberries.
Risk Reactor IFWB-C81PT
This dye was pretty spectacular, which it absolutely was not when we tried last year using the weaker UV lamps.
IFWB-C81PT – Immediate row (sprayed directly).IFWB-C81PT – Next row over (sprayed indirectly).
Risk Reactor UVTRACER-G1PT
This dye didn’t perform well. It didn’t seem to leave any residue other than accumulated runoff (drip points) at the tips of the leaves. It wasn’t the volume or adjuvant, because while there was some runoff with the other dyes, they were nothing like this. We speculated it was a function of the dye’s formulation. On the up side, we did capture a few good photos of bad coverage when applying a foliar product.
Risk Reactor UVTRACER-G1PT. Incurred run-off on the immediate row (sprayed directly) and was not visible beyond this row.
Eco Pigment Blaze Orange SPL15JX
Once again, this pigment put on a quite a show. Whole not unique to this dye, we noted particular accumulation along the veins of the leaves where we suspect the pigments (which are not water soluble) collected. It was also visible on the petioles, under-leaf surfaces and the stems, branches and trunks.
Not only did we see it three rows out, but it was all over the ground, the hood of the tractor, the operator’s boots and pretty much everywhere the sprayer went.
The last few shots are a public service announcement. The TOPPS water protection project in Europe once performed a study on a variety of airblast sprayers to determine where pesticide residue accumulated. They concluded that the header was the worst offender (that is, the booms, air ducts and fan at the rear of the unit).
While we saw evidence of dye deposition all over the sprayer, and on the tractor’s radiator grille (air inlet), the sprayer header was by far the most contaminated region. Always assume an unwashed sprayer has residue – wear your PPE.
Four dyes, one pass each, and no wind left the sprayer header completely covered. We would expect far more accumulation following an actual spray day. Do not touch contaminated application equipment, even if it appears clean, without PPE.
Thanks to Cesar Cappa, OMAFA Horticultural Weed Specialist for introducing the new UV lamp, for the photography, and for not complaining every time I blinded him with the light. Thanks to Falcon Blueberries for their time and collaboration.